> ## Documentation Index
> Fetch the complete documentation index at: https://docs.usedatabrain.com/llms.txt
> Use this file to discover all available pages before exploring further.
# Architecture Deep Dive
> Technical deep-dive into DataBrain's embedding architecture, authentication, performance, and deployment patterns
**For Technical Teams:** This guide provides detailed technical documentation of DataBrain's embedding architecture, including authentication flows, query execution paths, performance optimizations, and advanced deployment patterns.
**Prerequisites:**
* Familiarity with REST APIs and authentication concepts
* Understanding of database query execution
* Basic knowledge of cloud infrastructure (for deployment sections)
**Looking for conceptual overview?**
See [Embedding Architecture Concepts](/getting-started/core-concepts/embedding-architecture) for high-level understanding.
***
## Authentication & Security Flow
### Token Generation Process
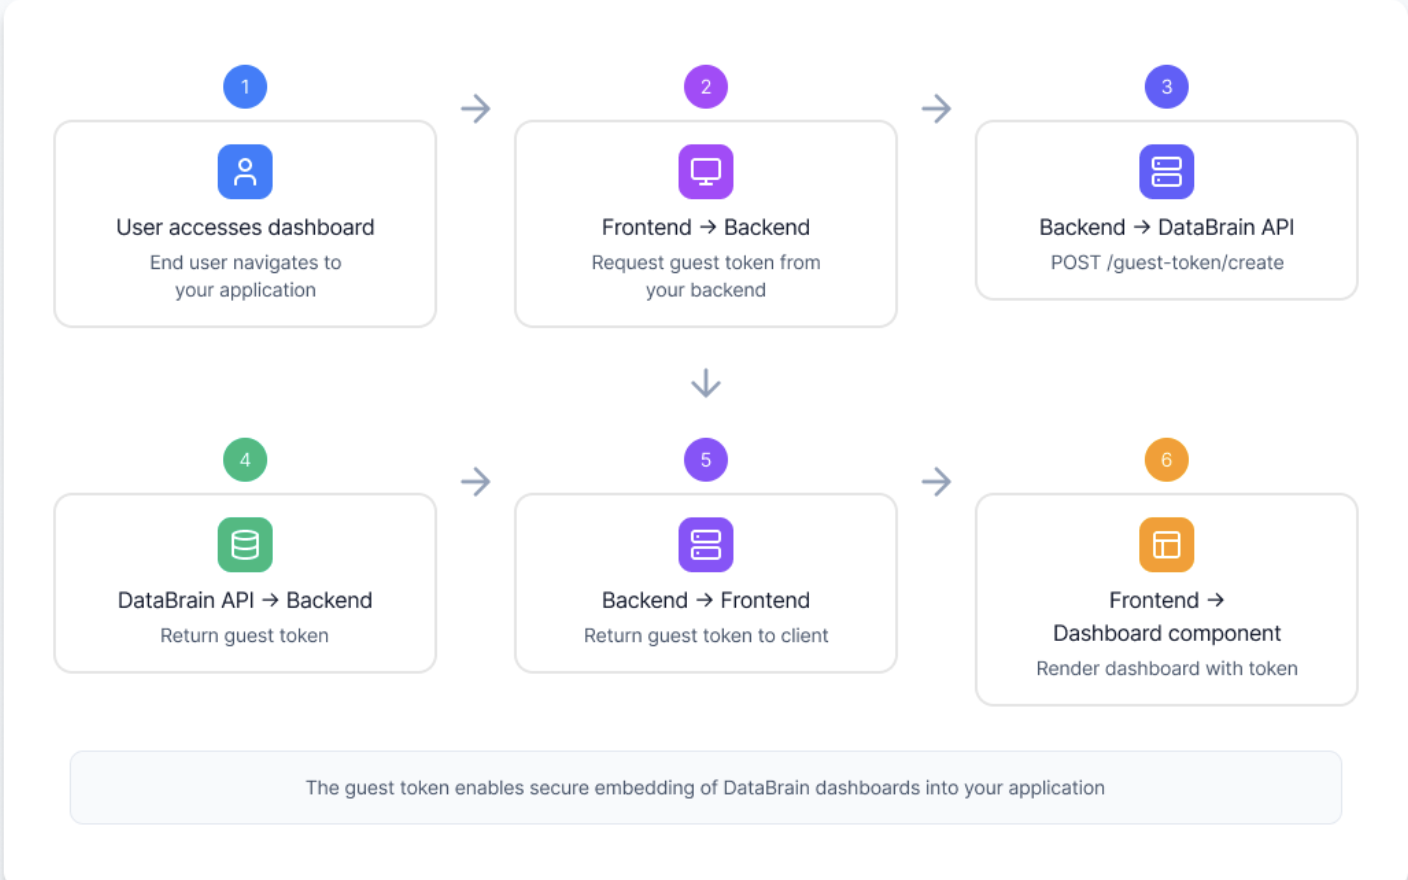 The authentication flow ensures secure, multi-tenant access through stateless guest tokens:
**Step 1: Your backend authenticates with DataBrain**
```javascript theme={"dark"}
const response = await fetch('https://api.usedatabrain.com/api/v2/guest-token/create', {
method: 'POST',
headers: {
'Authorization': `Bearer ${process.env.DATABRAIN_API_KEY}`,
'Content-Type': 'application/json'
},
body: JSON.stringify({
clientId: user.tenantId,
dataAppName: 'customer-portal',
expiryTime: 3600000, // 1 hour
params: {
rlsSettings: [
{ metricId: 'metric_123', values: { customer_id: user.customerId } }
]
}
})
});
const { token } = await response.json();
```
Your API key should only be used server-side. Never expose it to the frontend.
**Step 2: DataBrain validates every request**
When the web component makes requests, DataBrain performs multiple security checks:
1. **Token lookup**: The token (an opaque UUID issued server-side) must exist in the deployment — fails with `INVALID_TOKEN` otherwise
2. **Expiration check**: Ensures token hasn't expired (`TOKEN_EXPIRED`)
3. **Origin validation**: Verifies request comes from whitelisted domain (`UNAUTHORIZED_ORIGIN`)
4. **Permission check**: Validates access to requested dashboard/metric (`UNAUTHORIZED` / `INVALID_ID`)
5. **RLS application**: Applies row-level security rules
If any validation fails, the request is rejected with an appropriate error code.
**Step 3: Configure allowed domains**
In DataBrain dashboard, whitelist scheme-less `host[:port]` entries that can embed your analytics:
* `app.yourcompany.com`
* `dashboard.yourcompany.com`
* `localhost:3000` (for development)
Requests from non-whitelisted domains are automatically blocked, even with valid tokens.
**Step 4: Row-level security enforcement**
The `rlsSettings` you define in the guest token are enforced server-side per metric — the values are fixed at mint time and cannot be changed by the end user.
```json theme={"dark"}
// Defined in the guest token
"params": {
"rlsSettings": [
{ "metricId": "metric_123", "values": { "tenant_id": "customer-123" } }
]
}
```
RLS and token filters are **not** a substitute for the Datamart's tenant filter, and tenant scoping is not applied uniformly to every query. Builder (visual/dataset) metrics get the tenant filter injected automatically when the Datamart's Client ID mapping is set — but **custom SQL metrics do not**: their authors must reference the tenant variable explicitly (`WHERE client_column = 'client_id_variable'`), or the metric runs unscoped. See the [Tenancy Model](/developer-docs/tenancy-model) for the full rules.
### Security Best Practices
* Store API keys in environment variables
* Never expose API keys in frontend code
* Rotate API keys periodically
* Use separate keys for dev/staging/production
* Set reasonable expiration times (1-24 hours)
* Refresh tokens before expiration
* Generate new tokens on user session refresh
* Shorter expiry = better security
* Whitelist only necessary domains
* Remove development domains in production
* Use HTTPS in production (required)
* Review whitelist regularly
* Define RLS rules for all tables
* Test RLS rules thoroughly
* Use parameterized queries
* Avoid SQL injection vulnerabilities
***
## Data Flow Architecture
### Query Execution Path
Understanding how queries flow through the system:
End user interacts with embedded dashboard:
* Applies filters
* Changes date ranges
* Drills down into data
* Refreshes metrics
Web component constructs authenticated API request with the guest token and sends it to DataBrain to fetch metric data with any applied filters.
DataBrain processing pipeline:
1. **Validate token**: Look up the token server-side; check expiration, permissions
2. **Retrieve metric**: Load metric configuration from metadata
3. **Apply filters**: Merge user filters with app filters
4. **Generate SQL**: Create optimized query
5. **Apply RLS**: Wrap query with row-level security
6. **Check cache**: Look for cached results (optional)
Query executes against your database:
```sql theme={"dark"}
-- Example generated query
WITH rls_orders AS (
SELECT * FROM orders
WHERE customer_id = 'customer-123'
AND created_at >= CURRENT_DATE - INTERVAL '30 days'
)
SELECT
DATE_TRUNC('day', created_at) as date,
SUM(amount) as revenue
FROM rls_orders
GROUP BY date
ORDER BY date;
```
DataBrain generates optimized SQL with proper indexing hints and query planning.
DataBrain processes query results:
* Format data for visualization
* Apply number formatting
* Calculate aggregations
* Handle null values
* Apply currency conversions (if configured)
Results streamed to frontend:
```json theme={"dark"}
{
"data": [
{ "date": "2024-01-01", "revenue": 125000 },
{ "date": "2024-01-02", "revenue": 132000 }
],
"metadata": {
"executionTime": 245,
"cached": false
}
}
```
Component renders interactive chart with your theme.
### Performance Optimizations
**Reduce database load with intelligent caching:**
* **Time-based caching**: Cache results for configurable TTL (default: 24 hours)
* **Per-tenant caching**: Cache keys include query hash, datasource ID, filters, and workspace ID — ensuring tenant isolation
* **Two caching modes**: Use DataBrain's managed Redis or bring your own Redis/Elasticache
* **Graceful degradation**: Cache failures never block queries — DataBrain falls back to direct database execution
Configure caching in **Workspace Settings → Cache Settings**. Each workspace can independently choose its caching mode and TTL.
Complete guide to configuring query caching
**Efficient database connection management:**
* Connection pool per datasource
* Automatic connection recycling
* Configurable pool size
* Connection health checks
* Query timeout management
Recommended pool configuration:
| Workload | Min Connections | Max Connections |
| -------- | --------------- | --------------- |
| Light | 2 | 10 |
| Medium | 5 | 25 |
| Heavy | 10 | 50 |
**Automatic query optimization:**
✅ Push-down filters to database\
✅ Minimize data transfer\
✅ Use appropriate indexes\
✅ Parallel query execution\
✅ Result streaming for large datasets\
✅ Automatic query planning
**Fast-loading embedded components:**
* Lazy loading of visualizations
* Progressive rendering
* Debounced filter updates
* Virtual scrolling for tables
* Compressed data transfer
* CDN delivery of assets
***
## Advanced Architecture Patterns
### Proxy Mode Architecture
For enhanced security, route all requests through your own proxy server:
**Benefits of proxy mode:**
* Guest tokens never exposed to frontend
* Additional authentication layer
* Request/response modification
* Custom logging and monitoring
* API rate limiting
* Request validation
Complete guide to implementing proxy authentication
### Multi-Datasource Architecture
Support customers with data in different databases:
```json theme={"dark"}
{
"clientId": "enterprise-customer",
"datasourceName": "customer-dedicated-db",
"dataAppName": "analytics"
}
```
**Use cases:**
* Dedicated database per enterprise customer
* Multi-region data residency
* Database sharding strategies
* Read replica routing
Configure multi-datasource workspaces
### High-Availability Architecture
Deploy DataBrain with redundancy and failover:
**Horizontal scaling with load balancers:**
```
[Load Balancer]
|
┌────┼────┬────┐
│ │ │ │
App App App App
│ │ │ │
└────┴────┴────┘
|
[Database Pool]
```
* Multiple application servers
* Session affinity (sticky sessions)
* Health check endpoints
* Automatic failover
**High availability for databases:**
* Primary-replica setup
* Read replicas for analytics
* Automatic failover
* Cross-region replication
* Point-in-time recovery
**Redis for query result caching:**
* Use DataBrain's managed Redis or bring your own (BYOC)
* Per-workspace cache configuration
* Configurable TTL per workspace
* Graceful degradation on cache failures
Configure caching for your workspace
***
## Deployment Considerations
### Cloud vs Self-Hosted Comparison
**Best for:**
* Fast time-to-market
* Minimal DevOps resources
* Automatic updates and maintenance
* Built-in scalability
* Lower initial investment
**Considerations:**
* Data passes through DataBrain infrastructure
* Requires internet connectivity
* Less customization options
* Monthly/annual subscription pricing
**Best for:**
* Strict data sovereignty requirements
* Air-gapped environments
* Complete infrastructure control
* Custom compliance needs
* High-volume workloads
**Considerations:**
* Requires infrastructure management
* DevOps/IT resources needed
* Responsible for updates and scaling
* Higher initial setup cost
* One-time license + infrastructure costs
### Self-Hosted Deployment
**Required components:**
* DataBrain Application Server (Node.js)
* PostgreSQL Database (metadata storage)
* Redis Cache (session & query caching)
* Web UI (admin interface)
Deployment instructions and installation packages are provided in your self-hosted license package.
**Connect to your databases:**
* Private network connections within VPC
* Connection pooling configuration
* SSL/TLS certificate setup
* Read replica configuration (optional)
**Configure required environment variables:**
```bash theme={"dark"}
# Database
DB_HOST=your-postgres-host
DB_PORT=5432
DB_NAME=databrain
DB_USER=databrain_user
DB_PASSWORD=secure_password
# Redis (query result caching)
REDIS_HOST=your-redis-host
REDIS_PORT=6379
REDIS_PASSWORD=your-redis-password
# Application
NODE_ENV=production
PORT=3000
API_BASE_URL=https://your-databrain.company.com
```
**Set up HTTPS for production:**
* Obtain SSL certificates
* Configure reverse proxy (nginx/Apache)
* Enable HTTPS enforcement
* Set up certificate auto-renewal
**Launch DataBrain platform:**
Refer to your self-hosted package for specific deployment commands based on your infrastructure (Docker, Kubernetes, VMs).
### Infrastructure Sizing Guide
**Estimate your resource requirements:**
| Users (Concurrent) | CPU | Memory | Storage | Bandwidth |
| ------------------ | -------------------------------------- | ------ | ------- | --------- |
| 1-50 | 2 vCPU | 4 GB | 20 GB | 100 Mbps |
| 50-200 | 4 vCPU | 8 GB | 50 GB | 500 Mbps |
| 200-500 | 8 vCPU | 16 GB | 100 GB | 1 Gbps |
| 500-1000 | 16 vCPU | 32 GB | 200 GB | 2 Gbps |
| 1000+ | Contact us for enterprise architecture | | | |
**Sizing factors to consider:**
* Dashboard complexity (number of metrics)
* Query complexity and execution time
* Cache hit rate
* Number of dashboards per user
* Refresh rate requirements
***
## Monitoring & Observability
### Key Metrics to Monitor
* Request rate and latency
* Error rates and types
* Token validation success rate
* API endpoint performance
* Query execution time
* Connection pool utilization
* Cache hit/miss ratio
* Failed query rate
* Concurrent users
* Dashboard load times
* User session duration
* Feature usage patterns
* CPU and memory utilization
* Network throughput
* Disk I/O and space
* Container/pod health
### Health Check Endpoints
DataBrain provides health check endpoints for liveness and readiness (including Hasura, Keycloak, and Postgres). See [Health Check APIs](/developer-docs/helpers/api-reference/health-check) for full details.
```bash theme={"dark"}
# Liveness (process is up)
GET /health/live
Response: { "status": "live" }
# Readiness (backend + Hasura, Keycloak, Postgres)
GET /health/ready
Response: { "status": "ready"|"not_ready", "checks": { "hasura", "keycloak?", "postgres" } }
```
### Recommended Monitoring Stack
**Tools:**
* **DataDog / New Relic**: Full-stack APM
* **Prometheus + Grafana**: Open-source metrics
* **CloudWatch**: AWS native monitoring
**Key dashboards:**
* API response times
* Error rate tracking
* Token generation rate
* Active sessions
**Tools:**
* **pgAdmin / DBeaver**: PostgreSQL monitoring
* **Redis Commander**: Redis monitoring
* **Database-specific tools**: CloudSQL, RDS monitoring
**Key metrics:**
* Query performance
* Connection counts
* Cache efficiency
* Slow query log
**Tools:**
* **Kubernetes Dashboard**: K8s clusters
* **AWS CloudWatch**: AWS infrastructure
* **Grafana**: Cross-platform visualization
**Key alerts:**
* High CPU/memory usage
* Disk space warnings
* Network anomalies
* Container restarts
**Tools:**
* **ELK Stack**: Elasticsearch, Logstash, Kibana
* **Splunk**: Enterprise log management
* **CloudWatch Logs**: AWS logging
**Log categories:**
* Application logs
* Access logs
* Error logs
* Audit logs
***
## Troubleshooting & Debugging
### Common Issues
**Symptoms:**
* "UNAUTHORIZED" errors
* "TOKEN\_EXPIRED" messages
* "UNAUTHORIZED\_ORIGIN" errors
**Solutions:**
* Verify API key is correct and active
* Check token expiration time
* Ensure domain is whitelisted
* Verify token is being sent correctly
* Check for clock skew between systems
**Symptoms:**
* Dashboards loading slowly
* Timeouts on complex queries
* High database load
**Solutions:**
* Enable query caching
* Add database indexes
* Optimize RLS rules
* Increase connection pool size
* Use read replicas for analytics
* Review query execution plans
**Symptoms:**
* "Too many connections" errors
* Intermittent connection failures
* Slow response times
**Solutions:**
* Increase max connections in pool config
* Reduce connection idle timeout
* Scale application horizontally
* Optimize query execution time
* Check for connection leaks
**Symptoms:**
* Stale data displayed
* Inconsistent results
* Memory warnings
**Solutions:**
* Reduce cache TTL
* Clear cache manually if needed
* Increase Redis memory
* Review cache invalidation logic
* Check cache hit rate
### Debug Mode
Enable debug logging for troubleshooting:
```javascript theme={"dark"}
// Frontend debugging
window.dbn = {
debug: true,
logLevel: 'verbose'
};
```
This will log:
* Component lifecycle events
* API requests and responses
* Token validation steps
* Error details
***
## Next Steps
Complete step-by-step production deployment guide
Comprehensive security and compliance documentation
Implement row-level security for multi-tenant apps
Complete API documentation for token generation
Advanced proxy mode implementation
Self-hosted deployment configuration
***
## Additional Resources
**Q: How are queries optimized?**\
A: DataBrain applies push-down filters, uses connection pooling, generates indexed queries, and caches results based on your configuration.
**Q: What database permissions are required?**\
A: DataBrain only needs SELECT permissions on the tables you want to query. No write access is required.
**Q: How is high availability achieved?**\
A: Cloud deployments have built-in HA. Self-hosted can deploy with load balancers, multiple app servers, and database replicas.
**Q: Can I customize query generation?**\
A: While DataBrain optimizes queries automatically, you can control them through metric definitions and filter configurations.
**Q: What's the token refresh strategy?**\
A: Generate new tokens before expiration (e.g., when token has 10% life remaining). Your backend should handle this automatically.
**Application Level:**
* Enable query caching with appropriate TTL
* Use connection pooling (adjust based on load)
* Implement CDN for static assets
* Enable compression for API responses
**Database Level:**
* Create indexes on filtered columns
* Use read replicas for analytics workload
* Optimize RLS queries for performance
* Monitor slow query log
**Infrastructure Level:**
* Scale horizontally with load balancing
* Use Redis cluster for caching layer
* Deploy close to your database (reduce latency)
* Implement proper monitoring and alerting
DataBrain maintains industry-leading security certifications:
* **SOC 2 Type II**: Annual audits of security controls
* **ISO 27001**: Information security management
* **GDPR**: European data protection compliance
* **HIPAA**: Healthcare data protection (self-hosted)
* **PCI DSS**: Payment card data security
[View Security Page →](https://www.usedatabrain.com/security)
**Need technical support?**
* 📚 Documentation: [docs.usedatabrain.com](https://docs.usedatabrain.com)
* 💬 Contact support through your DataBrain dashboard
**Enterprise customers:** Contact your dedicated solutions architect for architecture reviews and optimization guidance.
The authentication flow ensures secure, multi-tenant access through stateless guest tokens:
**Step 1: Your backend authenticates with DataBrain**
```javascript theme={"dark"}
const response = await fetch('https://api.usedatabrain.com/api/v2/guest-token/create', {
method: 'POST',
headers: {
'Authorization': `Bearer ${process.env.DATABRAIN_API_KEY}`,
'Content-Type': 'application/json'
},
body: JSON.stringify({
clientId: user.tenantId,
dataAppName: 'customer-portal',
expiryTime: 3600000, // 1 hour
params: {
rlsSettings: [
{ metricId: 'metric_123', values: { customer_id: user.customerId } }
]
}
})
});
const { token } = await response.json();
```
Your API key should only be used server-side. Never expose it to the frontend.
**Step 2: DataBrain validates every request**
When the web component makes requests, DataBrain performs multiple security checks:
1. **Token lookup**: The token (an opaque UUID issued server-side) must exist in the deployment — fails with `INVALID_TOKEN` otherwise
2. **Expiration check**: Ensures token hasn't expired (`TOKEN_EXPIRED`)
3. **Origin validation**: Verifies request comes from whitelisted domain (`UNAUTHORIZED_ORIGIN`)
4. **Permission check**: Validates access to requested dashboard/metric (`UNAUTHORIZED` / `INVALID_ID`)
5. **RLS application**: Applies row-level security rules
If any validation fails, the request is rejected with an appropriate error code.
**Step 3: Configure allowed domains**
In DataBrain dashboard, whitelist scheme-less `host[:port]` entries that can embed your analytics:
* `app.yourcompany.com`
* `dashboard.yourcompany.com`
* `localhost:3000` (for development)
Requests from non-whitelisted domains are automatically blocked, even with valid tokens.
**Step 4: Row-level security enforcement**
The `rlsSettings` you define in the guest token are enforced server-side per metric — the values are fixed at mint time and cannot be changed by the end user.
```json theme={"dark"}
// Defined in the guest token
"params": {
"rlsSettings": [
{ "metricId": "metric_123", "values": { "tenant_id": "customer-123" } }
]
}
```
RLS and token filters are **not** a substitute for the Datamart's tenant filter, and tenant scoping is not applied uniformly to every query. Builder (visual/dataset) metrics get the tenant filter injected automatically when the Datamart's Client ID mapping is set — but **custom SQL metrics do not**: their authors must reference the tenant variable explicitly (`WHERE client_column = 'client_id_variable'`), or the metric runs unscoped. See the [Tenancy Model](/developer-docs/tenancy-model) for the full rules.
### Security Best Practices
* Store API keys in environment variables
* Never expose API keys in frontend code
* Rotate API keys periodically
* Use separate keys for dev/staging/production
* Set reasonable expiration times (1-24 hours)
* Refresh tokens before expiration
* Generate new tokens on user session refresh
* Shorter expiry = better security
* Whitelist only necessary domains
* Remove development domains in production
* Use HTTPS in production (required)
* Review whitelist regularly
* Define RLS rules for all tables
* Test RLS rules thoroughly
* Use parameterized queries
* Avoid SQL injection vulnerabilities
***
## Data Flow Architecture
### Query Execution Path
Understanding how queries flow through the system:
End user interacts with embedded dashboard:
* Applies filters
* Changes date ranges
* Drills down into data
* Refreshes metrics
Web component constructs authenticated API request with the guest token and sends it to DataBrain to fetch metric data with any applied filters.
DataBrain processing pipeline:
1. **Validate token**: Look up the token server-side; check expiration, permissions
2. **Retrieve metric**: Load metric configuration from metadata
3. **Apply filters**: Merge user filters with app filters
4. **Generate SQL**: Create optimized query
5. **Apply RLS**: Wrap query with row-level security
6. **Check cache**: Look for cached results (optional)
Query executes against your database:
```sql theme={"dark"}
-- Example generated query
WITH rls_orders AS (
SELECT * FROM orders
WHERE customer_id = 'customer-123'
AND created_at >= CURRENT_DATE - INTERVAL '30 days'
)
SELECT
DATE_TRUNC('day', created_at) as date,
SUM(amount) as revenue
FROM rls_orders
GROUP BY date
ORDER BY date;
```
DataBrain generates optimized SQL with proper indexing hints and query planning.
DataBrain processes query results:
* Format data for visualization
* Apply number formatting
* Calculate aggregations
* Handle null values
* Apply currency conversions (if configured)
Results streamed to frontend:
```json theme={"dark"}
{
"data": [
{ "date": "2024-01-01", "revenue": 125000 },
{ "date": "2024-01-02", "revenue": 132000 }
],
"metadata": {
"executionTime": 245,
"cached": false
}
}
```
Component renders interactive chart with your theme.
### Performance Optimizations
**Reduce database load with intelligent caching:**
* **Time-based caching**: Cache results for configurable TTL (default: 24 hours)
* **Per-tenant caching**: Cache keys include query hash, datasource ID, filters, and workspace ID — ensuring tenant isolation
* **Two caching modes**: Use DataBrain's managed Redis or bring your own Redis/Elasticache
* **Graceful degradation**: Cache failures never block queries — DataBrain falls back to direct database execution
Configure caching in **Workspace Settings → Cache Settings**. Each workspace can independently choose its caching mode and TTL.
Complete guide to configuring query caching
**Efficient database connection management:**
* Connection pool per datasource
* Automatic connection recycling
* Configurable pool size
* Connection health checks
* Query timeout management
Recommended pool configuration:
| Workload | Min Connections | Max Connections |
| -------- | --------------- | --------------- |
| Light | 2 | 10 |
| Medium | 5 | 25 |
| Heavy | 10 | 50 |
**Automatic query optimization:**
✅ Push-down filters to database\
✅ Minimize data transfer\
✅ Use appropriate indexes\
✅ Parallel query execution\
✅ Result streaming for large datasets\
✅ Automatic query planning
**Fast-loading embedded components:**
* Lazy loading of visualizations
* Progressive rendering
* Debounced filter updates
* Virtual scrolling for tables
* Compressed data transfer
* CDN delivery of assets
***
## Advanced Architecture Patterns
### Proxy Mode Architecture
For enhanced security, route all requests through your own proxy server:
**Benefits of proxy mode:**
* Guest tokens never exposed to frontend
* Additional authentication layer
* Request/response modification
* Custom logging and monitoring
* API rate limiting
* Request validation
Complete guide to implementing proxy authentication
### Multi-Datasource Architecture
Support customers with data in different databases:
```json theme={"dark"}
{
"clientId": "enterprise-customer",
"datasourceName": "customer-dedicated-db",
"dataAppName": "analytics"
}
```
**Use cases:**
* Dedicated database per enterprise customer
* Multi-region data residency
* Database sharding strategies
* Read replica routing
Configure multi-datasource workspaces
### High-Availability Architecture
Deploy DataBrain with redundancy and failover:
**Horizontal scaling with load balancers:**
```
[Load Balancer]
|
┌────┼────┬────┐
│ │ │ │
App App App App
│ │ │ │
└────┴────┴────┘
|
[Database Pool]
```
* Multiple application servers
* Session affinity (sticky sessions)
* Health check endpoints
* Automatic failover
**High availability for databases:**
* Primary-replica setup
* Read replicas for analytics
* Automatic failover
* Cross-region replication
* Point-in-time recovery
**Redis for query result caching:**
* Use DataBrain's managed Redis or bring your own (BYOC)
* Per-workspace cache configuration
* Configurable TTL per workspace
* Graceful degradation on cache failures
Configure caching for your workspace
***
## Deployment Considerations
### Cloud vs Self-Hosted Comparison
**Best for:**
* Fast time-to-market
* Minimal DevOps resources
* Automatic updates and maintenance
* Built-in scalability
* Lower initial investment
**Considerations:**
* Data passes through DataBrain infrastructure
* Requires internet connectivity
* Less customization options
* Monthly/annual subscription pricing
**Best for:**
* Strict data sovereignty requirements
* Air-gapped environments
* Complete infrastructure control
* Custom compliance needs
* High-volume workloads
**Considerations:**
* Requires infrastructure management
* DevOps/IT resources needed
* Responsible for updates and scaling
* Higher initial setup cost
* One-time license + infrastructure costs
### Self-Hosted Deployment
**Required components:**
* DataBrain Application Server (Node.js)
* PostgreSQL Database (metadata storage)
* Redis Cache (session & query caching)
* Web UI (admin interface)
Deployment instructions and installation packages are provided in your self-hosted license package.
**Connect to your databases:**
* Private network connections within VPC
* Connection pooling configuration
* SSL/TLS certificate setup
* Read replica configuration (optional)
**Configure required environment variables:**
```bash theme={"dark"}
# Database
DB_HOST=your-postgres-host
DB_PORT=5432
DB_NAME=databrain
DB_USER=databrain_user
DB_PASSWORD=secure_password
# Redis (query result caching)
REDIS_HOST=your-redis-host
REDIS_PORT=6379
REDIS_PASSWORD=your-redis-password
# Application
NODE_ENV=production
PORT=3000
API_BASE_URL=https://your-databrain.company.com
```
**Set up HTTPS for production:**
* Obtain SSL certificates
* Configure reverse proxy (nginx/Apache)
* Enable HTTPS enforcement
* Set up certificate auto-renewal
**Launch DataBrain platform:**
Refer to your self-hosted package for specific deployment commands based on your infrastructure (Docker, Kubernetes, VMs).
### Infrastructure Sizing Guide
**Estimate your resource requirements:**
| Users (Concurrent) | CPU | Memory | Storage | Bandwidth |
| ------------------ | -------------------------------------- | ------ | ------- | --------- |
| 1-50 | 2 vCPU | 4 GB | 20 GB | 100 Mbps |
| 50-200 | 4 vCPU | 8 GB | 50 GB | 500 Mbps |
| 200-500 | 8 vCPU | 16 GB | 100 GB | 1 Gbps |
| 500-1000 | 16 vCPU | 32 GB | 200 GB | 2 Gbps |
| 1000+ | Contact us for enterprise architecture | | | |
**Sizing factors to consider:**
* Dashboard complexity (number of metrics)
* Query complexity and execution time
* Cache hit rate
* Number of dashboards per user
* Refresh rate requirements
***
## Monitoring & Observability
### Key Metrics to Monitor
* Request rate and latency
* Error rates and types
* Token validation success rate
* API endpoint performance
* Query execution time
* Connection pool utilization
* Cache hit/miss ratio
* Failed query rate
* Concurrent users
* Dashboard load times
* User session duration
* Feature usage patterns
* CPU and memory utilization
* Network throughput
* Disk I/O and space
* Container/pod health
### Health Check Endpoints
DataBrain provides health check endpoints for liveness and readiness (including Hasura, Keycloak, and Postgres). See [Health Check APIs](/developer-docs/helpers/api-reference/health-check) for full details.
```bash theme={"dark"}
# Liveness (process is up)
GET /health/live
Response: { "status": "live" }
# Readiness (backend + Hasura, Keycloak, Postgres)
GET /health/ready
Response: { "status": "ready"|"not_ready", "checks": { "hasura", "keycloak?", "postgres" } }
```
### Recommended Monitoring Stack
**Tools:**
* **DataDog / New Relic**: Full-stack APM
* **Prometheus + Grafana**: Open-source metrics
* **CloudWatch**: AWS native monitoring
**Key dashboards:**
* API response times
* Error rate tracking
* Token generation rate
* Active sessions
**Tools:**
* **pgAdmin / DBeaver**: PostgreSQL monitoring
* **Redis Commander**: Redis monitoring
* **Database-specific tools**: CloudSQL, RDS monitoring
**Key metrics:**
* Query performance
* Connection counts
* Cache efficiency
* Slow query log
**Tools:**
* **Kubernetes Dashboard**: K8s clusters
* **AWS CloudWatch**: AWS infrastructure
* **Grafana**: Cross-platform visualization
**Key alerts:**
* High CPU/memory usage
* Disk space warnings
* Network anomalies
* Container restarts
**Tools:**
* **ELK Stack**: Elasticsearch, Logstash, Kibana
* **Splunk**: Enterprise log management
* **CloudWatch Logs**: AWS logging
**Log categories:**
* Application logs
* Access logs
* Error logs
* Audit logs
***
## Troubleshooting & Debugging
### Common Issues
**Symptoms:**
* "UNAUTHORIZED" errors
* "TOKEN\_EXPIRED" messages
* "UNAUTHORIZED\_ORIGIN" errors
**Solutions:**
* Verify API key is correct and active
* Check token expiration time
* Ensure domain is whitelisted
* Verify token is being sent correctly
* Check for clock skew between systems
**Symptoms:**
* Dashboards loading slowly
* Timeouts on complex queries
* High database load
**Solutions:**
* Enable query caching
* Add database indexes
* Optimize RLS rules
* Increase connection pool size
* Use read replicas for analytics
* Review query execution plans
**Symptoms:**
* "Too many connections" errors
* Intermittent connection failures
* Slow response times
**Solutions:**
* Increase max connections in pool config
* Reduce connection idle timeout
* Scale application horizontally
* Optimize query execution time
* Check for connection leaks
**Symptoms:**
* Stale data displayed
* Inconsistent results
* Memory warnings
**Solutions:**
* Reduce cache TTL
* Clear cache manually if needed
* Increase Redis memory
* Review cache invalidation logic
* Check cache hit rate
### Debug Mode
Enable debug logging for troubleshooting:
```javascript theme={"dark"}
// Frontend debugging
window.dbn = {
debug: true,
logLevel: 'verbose'
};
```
This will log:
* Component lifecycle events
* API requests and responses
* Token validation steps
* Error details
***
## Next Steps
Complete step-by-step production deployment guide
Comprehensive security and compliance documentation
Implement row-level security for multi-tenant apps
Complete API documentation for token generation
Advanced proxy mode implementation
Self-hosted deployment configuration
***
## Additional Resources
**Q: How are queries optimized?**\
A: DataBrain applies push-down filters, uses connection pooling, generates indexed queries, and caches results based on your configuration.
**Q: What database permissions are required?**\
A: DataBrain only needs SELECT permissions on the tables you want to query. No write access is required.
**Q: How is high availability achieved?**\
A: Cloud deployments have built-in HA. Self-hosted can deploy with load balancers, multiple app servers, and database replicas.
**Q: Can I customize query generation?**\
A: While DataBrain optimizes queries automatically, you can control them through metric definitions and filter configurations.
**Q: What's the token refresh strategy?**\
A: Generate new tokens before expiration (e.g., when token has 10% life remaining). Your backend should handle this automatically.
**Application Level:**
* Enable query caching with appropriate TTL
* Use connection pooling (adjust based on load)
* Implement CDN for static assets
* Enable compression for API responses
**Database Level:**
* Create indexes on filtered columns
* Use read replicas for analytics workload
* Optimize RLS queries for performance
* Monitor slow query log
**Infrastructure Level:**
* Scale horizontally with load balancing
* Use Redis cluster for caching layer
* Deploy close to your database (reduce latency)
* Implement proper monitoring and alerting
DataBrain maintains industry-leading security certifications:
* **SOC 2 Type II**: Annual audits of security controls
* **ISO 27001**: Information security management
* **GDPR**: European data protection compliance
* **HIPAA**: Healthcare data protection (self-hosted)
* **PCI DSS**: Payment card data security
[View Security Page →](https://www.usedatabrain.com/security)
**Need technical support?**
* 📚 Documentation: [docs.usedatabrain.com](https://docs.usedatabrain.com)
* 💬 Contact support through your DataBrain dashboard
**Enterprise customers:** Contact your dedicated solutions architect for architecture reviews and optimization guidance.