> ## Documentation Index
> Fetch the complete documentation index at: https://docs.usedatabrain.com/llms.txt
> Use this file to discover all available pages before exploring further.
# End User Metric Creation
1. **Create a Datamart**
Create a Datamart in "Data Studio" page. Kindly refer the below link on how to create datamarts:
2. **Create a Workspace with Datamart connection**
For more details, kindly refer the below link:
3. **Create a Dashboard with few defined metrics**
For more details, kindly refer the below link:
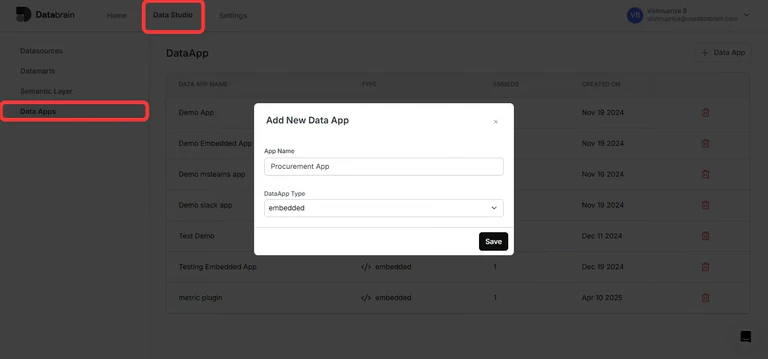
4. **Create a DataApp**
For more details, kindly refer the below link:

5. **Create an Embed Type using either dashboard or metric**
* Navigate to the Data App.
* In the "Embed Info" section, create an embed type using workspace name, embed type: dashboard or metric, name of dashboard or metric.

6. **Generate API Token**
In the "API Token" section, generate the API token by specifying the name of company and description (optional)
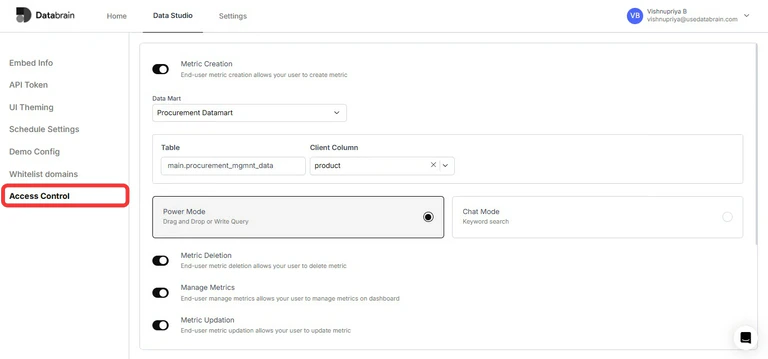
7. **Configure options in Access control section**
* Navigate to the Data App.
* In the "Access Control" section, enable **Metric Creation** for the embed.
Metric creation is controlled at three levels, in priority order:
1. **Guest token** — if the token sets `permissions.isDisableMetricCreation: true`, metric creation is off no matter what else is configured.
2. **Data App Access Control** — the server-side setting you enable in this step.
3. **Embed component** — `options.disableMetricCreation` on `dbn-dashboard` hides the UI client-side.
There is no `isAllowMetricCreation` embed prop — the component option is `disableMetricCreation`.
8. **Create Guest token by passing Client ID and DataApp Name**
When you need a guest token that you want to use across dashboards and metrics. All you have to do is pass `clientId`, `dataAppName`. If `expiryTime` is not passed, the token will not expire.
**Cloud Databrain:**
```http theme={"dark"}
POST https://api.usedatabrain.com/api/v2/guest-token/create
```
**Self-hosted Databrain:**
```http theme={"dark"}
POST /api/v2/guest-token/create
```
## Generating GUEST TOKEN for your Dashboard/Metric Component
### Headers
| Name | Type | Description |
| --------------- | ------ | ------------------ |
| Authorization\* | String | Bearer (API Token) |
### Request Body
| Name | Type | Description |
| -------------- | ------ | ---------------------------------------------------------------------------------------------------------------------------------------- |
| dataAppName\* | String | Your Data App Name |
| clientId\* | String | Client ID for whom this guest token is generated. (`"clientId": "None"` if no tenancy is selected for connected datasource/datamart) |
| params | Object | Additional Params: `appFilters`, `rlsSettings`, `userIdentifier`, `allowedEmbeds` — see [Token Body](/developer-docs/helpers/token-body) |
| expiryTime | Number | In milliseconds. If omitted, the token never expires |
| datasourceName | String | Datasource name from Data Studio (\*important and supported in multi-datasource connection in workspace) |
**Example Response: 200 OK "token": "..."**
```json theme={"dark"}
when the response is successful it returns a token that you can pass to the frontend.
```
When the response is successful it returns a token that you can pass to the frontend.
### Simple Request Body
```json theme={"dark"}
{
"clientId": "Vaccine",
"dataAppName": "Procurement App"
}
```
Once you acquire the guest token, you can seamlessly pass it to your frontend application, where it can be integrated with the web component.
9. **End User Metric Creation / Updation**
**Metric Creation**
* Click on the "+Create Metric" button near the settings icon

* Drag and drop necessary dimensions and measures to create the metric

* Then, click on "Save" icon at the top right corner and specify metric details to save the metric to dashboard
**Metric Updation**
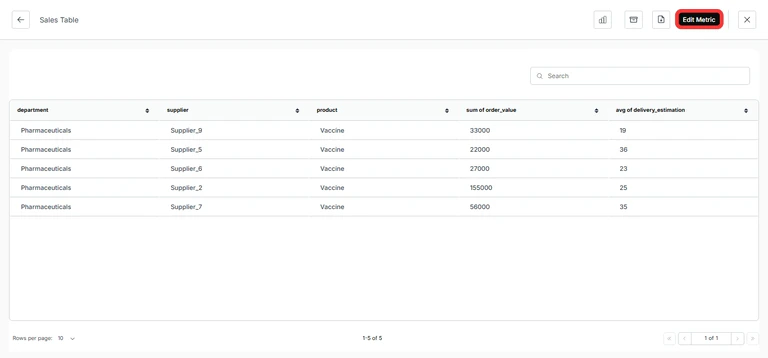
* View the metric in full screen and click on the "Edit Metric" button
* Update the metric according to your requirements and save it to dashboard
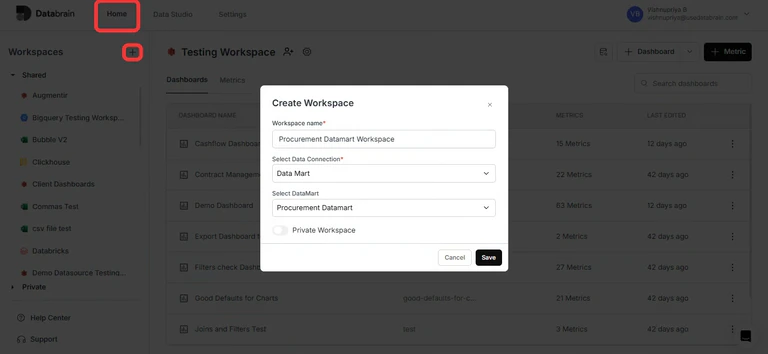 For more details, kindly refer the below link:
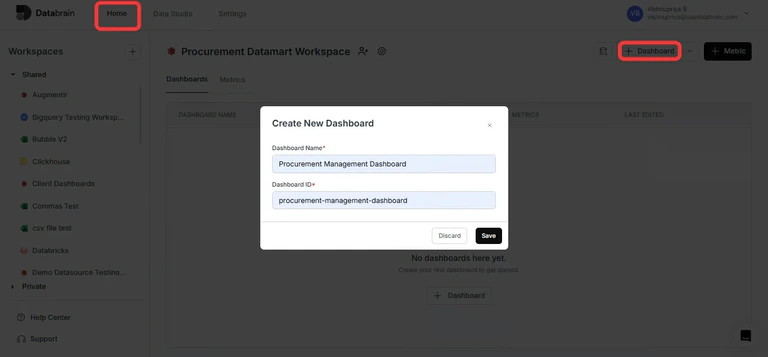
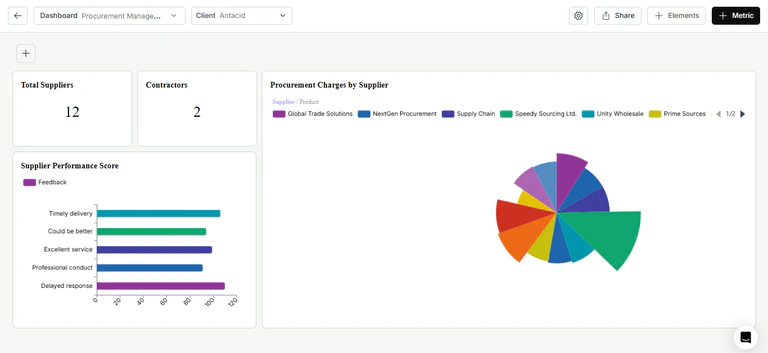 For more details, kindly refer the below link:
 For more details, kindly refer the below link:
 6. **Generate API Token**
In the "API Token" section, generate the API token by specifying the name of company and description (optional)
6. **Generate API Token**
In the "API Token" section, generate the API token by specifying the name of company and description (optional)
 7. **Configure options in Access control section**
* Navigate to the Data App.
* In the "Access Control" section, enable **Metric Creation** for the embed.
7. **Configure options in Access control section**
* Navigate to the Data App.
* In the "Access Control" section, enable **Metric Creation** for the embed.
 8. **Create Guest token by passing Client ID and DataApp Name**
When you need a guest token that you want to use across dashboards and metrics. All you have to do is pass `clientId`, `dataAppName`. If `expiryTime` is not passed, the token will not expire.
**Cloud Databrain:**
```http theme={"dark"}
POST https://api.usedatabrain.com/api/v2/guest-token/create
```
**Self-hosted Databrain:**
```http theme={"dark"}
POST
8. **Create Guest token by passing Client ID and DataApp Name**
When you need a guest token that you want to use across dashboards and metrics. All you have to do is pass `clientId`, `dataAppName`. If `expiryTime` is not passed, the token will not expire.
**Cloud Databrain:**
```http theme={"dark"}
POST https://api.usedatabrain.com/api/v2/guest-token/create
```
**Self-hosted Databrain:**
```http theme={"dark"}
POST 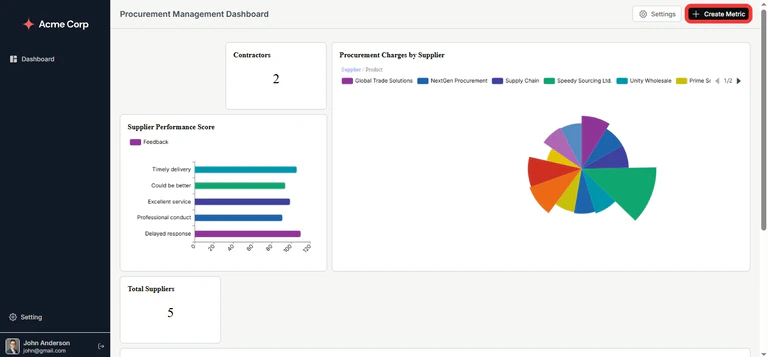 * Drag and drop necessary dimensions and measures to create the metric
* Then, click on "Save" icon at the top right corner and specify metric details to save the metric to dashboard
* Drag and drop necessary dimensions and measures to create the metric
* Then, click on "Save" icon at the top right corner and specify metric details to save the metric to dashboard
 **Metric Updation**
* View the metric in full screen and click on the "Edit Metric" button
**Metric Updation**
* View the metric in full screen and click on the "Edit Metric" button
 * Update the metric according to your requirements and save it to dashboard