> ## Documentation Index
> Fetch the complete documentation index at: https://docs.usedatabrain.com/llms.txt
> Use this file to discover all available pages before exploring further.
# Dashboard Settings
> The dashboard settings offer various tools to enhance, manage, and customize your analytics experience.
1. **Navigate to Dashboard Settings**
* On the dashboard, click the **"Settings"** icon in the top right corner, next to the **"Share"** button.
* A list of drop-down options will be displayed.
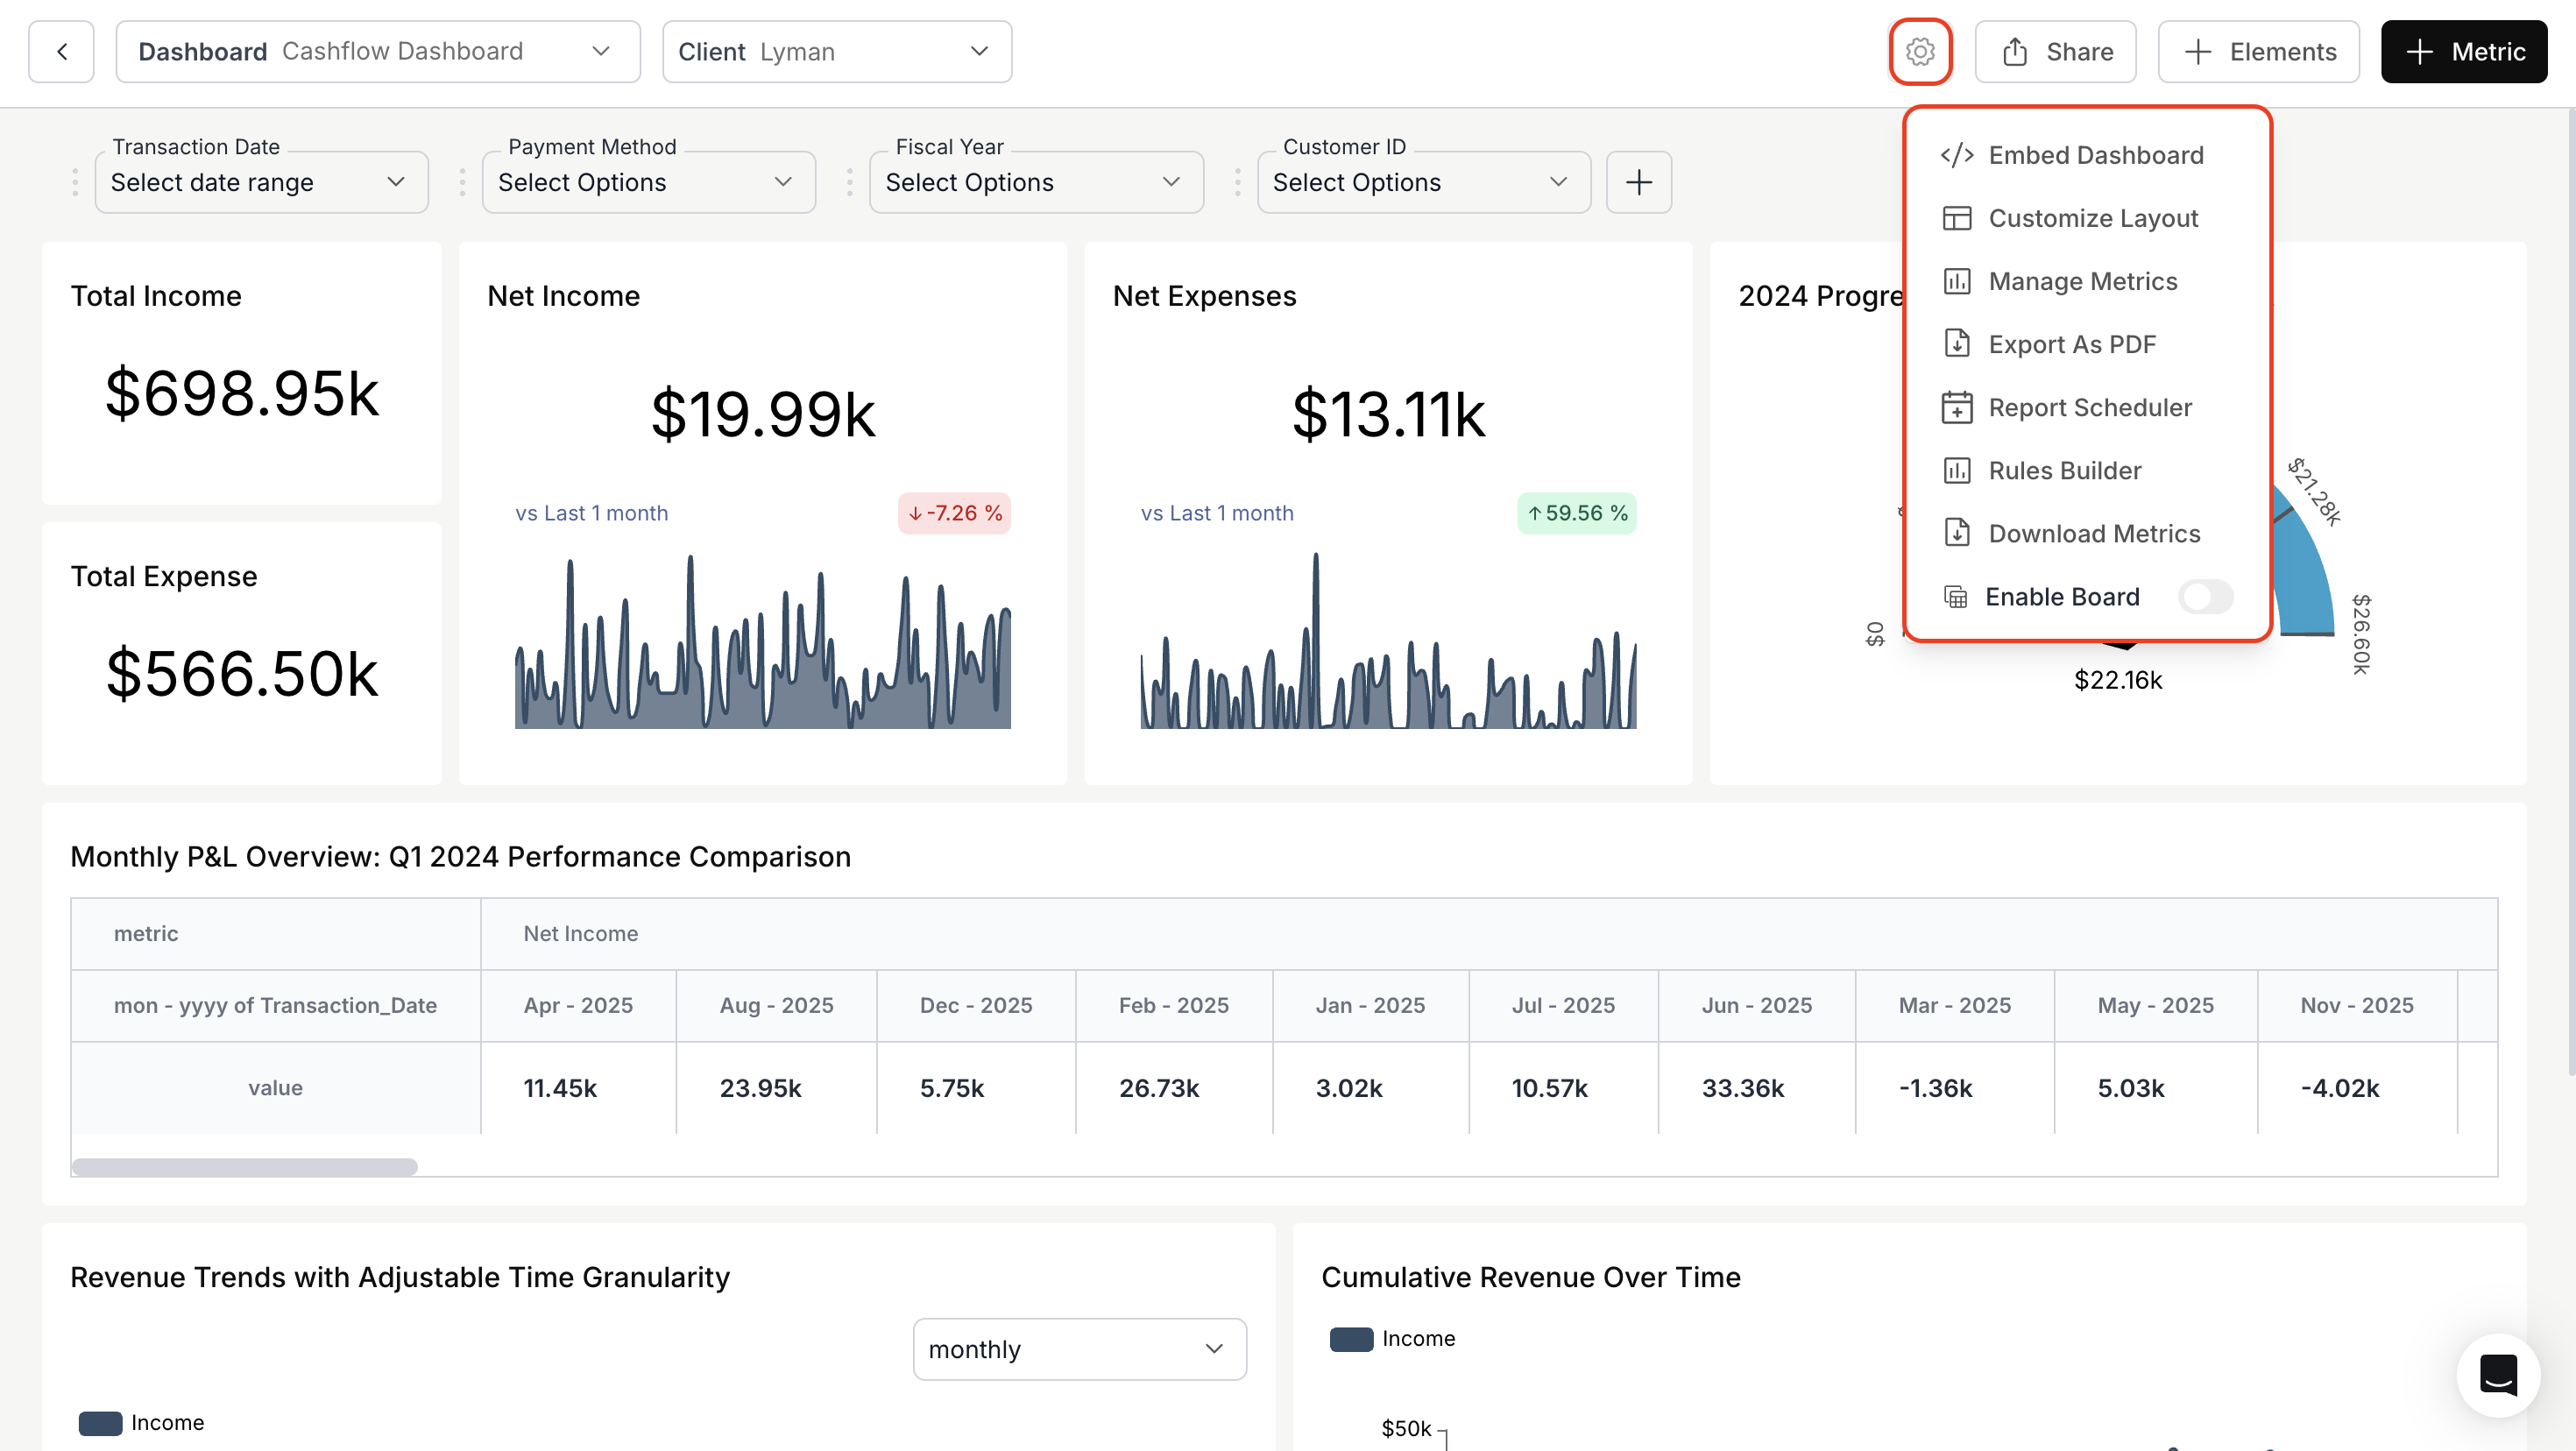 2. **`` Embed Dashboard**:
Here, you can retrieve the embeddable code or the Databrain app dashboard UI plugin, available in both React and Vue languages.
3. **Customize Layout**:
* Organize your dashboard metrics to create a personalized view.
* For more details, please refer to the link below:
Customize Layout
4. **Manage Metrics**:
* This tool lets you oversee the metric cards on the dashboard.
* From the dropdown, decide which metrics to display and which to hide. Unselected metrics are sent to the archive metric store. If needed, you can recover them later by unarchiving.
2. **`` Embed Dashboard**:
Here, you can retrieve the embeddable code or the Databrain app dashboard UI plugin, available in both React and Vue languages.
3. **Customize Layout**:
* Organize your dashboard metrics to create a personalized view.
* For more details, please refer to the link below:
Customize Layout
4. **Manage Metrics**:
* This tool lets you oversee the metric cards on the dashboard.
* From the dropdown, decide which metrics to display and which to hide. Unselected metrics are sent to the archive metric store. If needed, you can recover them later by unarchiving.
 5. **Report Scheduler**
* Create, schedule, and manage automated dashboard reports with customizable delivery options to meet your reporting needs.
* For more details, please refer to the link below:
6. **Rules Builder**\
Users can now hide or unhide metrics based on selected charts.
7. **Download Metrics**\
Users can now download the underlying data for all metrics with just one click.
8. **Boards**\
Users can now create multiple views of a dashboard based on applied dashboard filters and easily switch between them. For more details, please refer to the link below:\
[https://docs.usedatabrain.com/guides/dashboards/boards#boards](https://docs.usedatabrain.com/guides/dashboards/boards#boards)
Report Scheduler
You’ve successfully reviewed Dashboard Settings. All core management tools—layout customization, metric controls, rules, reports, and embedding—are now configured for a tailored dashboard experience.
5. **Report Scheduler**
* Create, schedule, and manage automated dashboard reports with customizable delivery options to meet your reporting needs.
* For more details, please refer to the link below:
6. **Rules Builder**\
Users can now hide or unhide metrics based on selected charts.
7. **Download Metrics**\
Users can now download the underlying data for all metrics with just one click.
8. **Boards**\
Users can now create multiple views of a dashboard based on applied dashboard filters and easily switch between them. For more details, please refer to the link below:\
[https://docs.usedatabrain.com/guides/dashboards/boards#boards](https://docs.usedatabrain.com/guides/dashboards/boards#boards)
Report Scheduler
You’ve successfully reviewed Dashboard Settings. All core management tools—layout customization, metric controls, rules, reports, and embedding—are now configured for a tailored dashboard experience.