> ## Documentation Index
> Fetch the complete documentation index at: https://docs.usedatabrain.com/llms.txt
> Use this file to discover all available pages before exploring further.
# Custom SQL Console
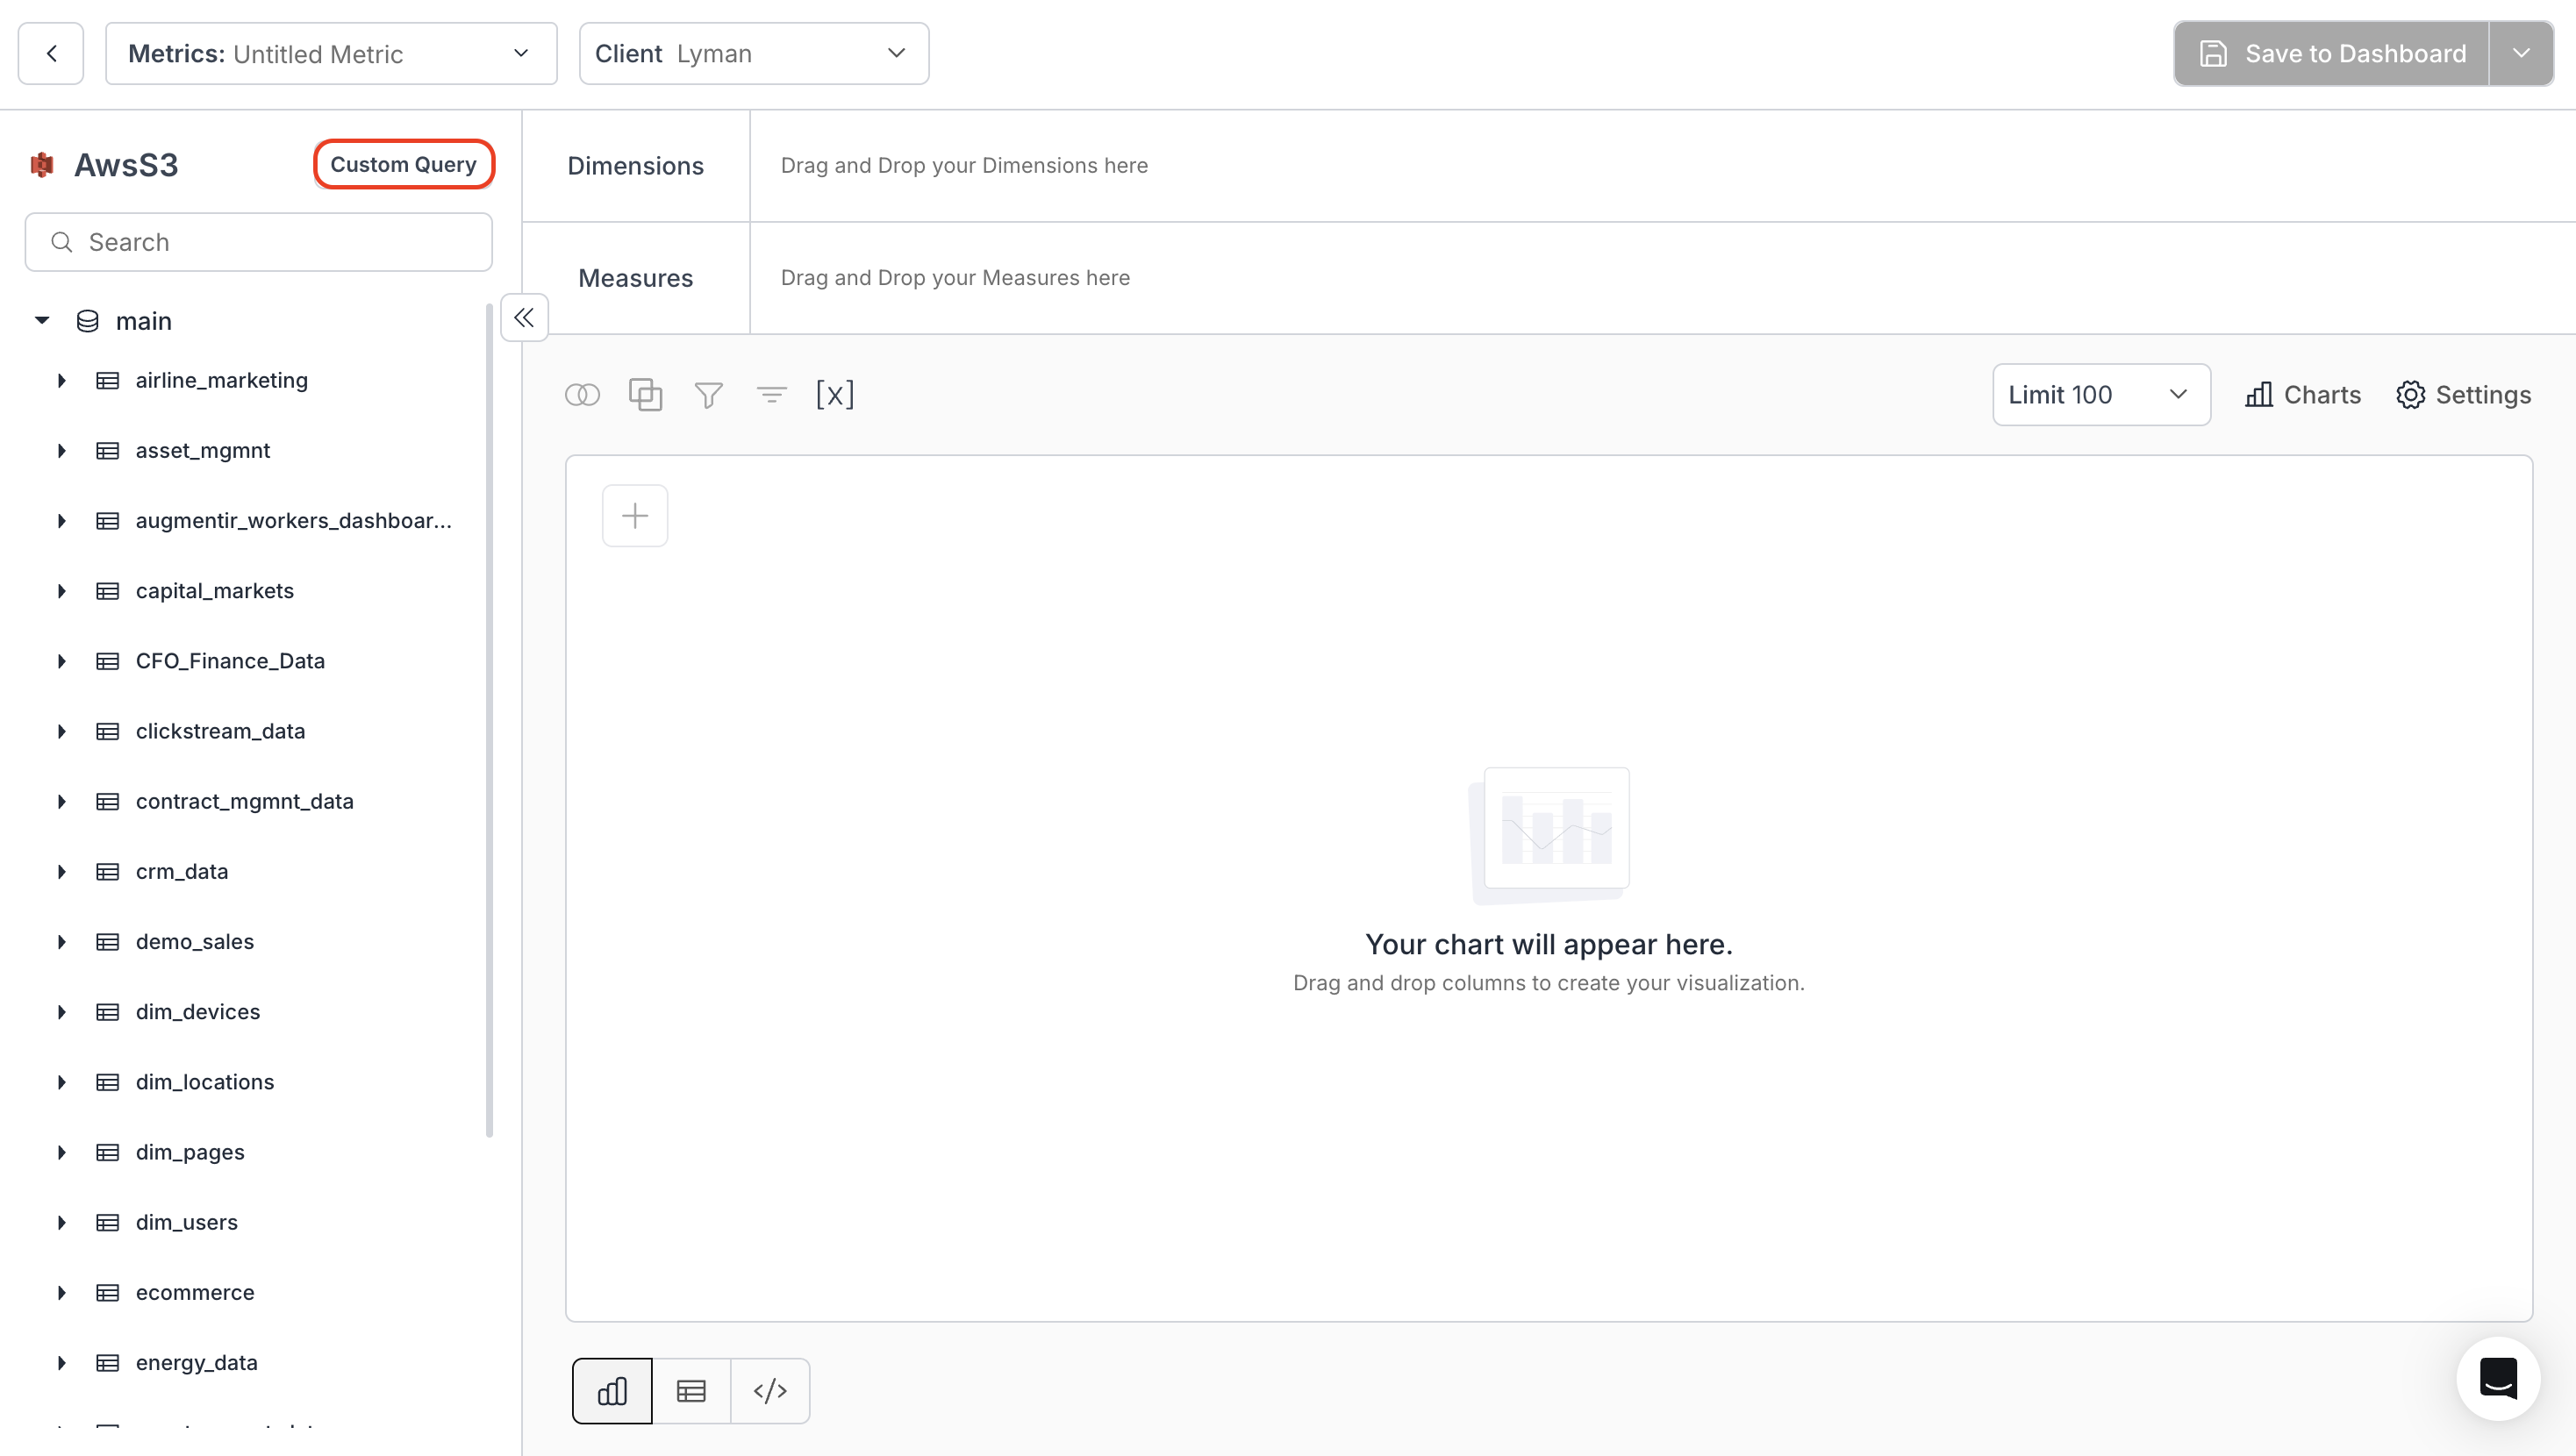
### 1. **Access the Custom SQL**
On the **Create Metric** page, select the **"Custom Query"** option.
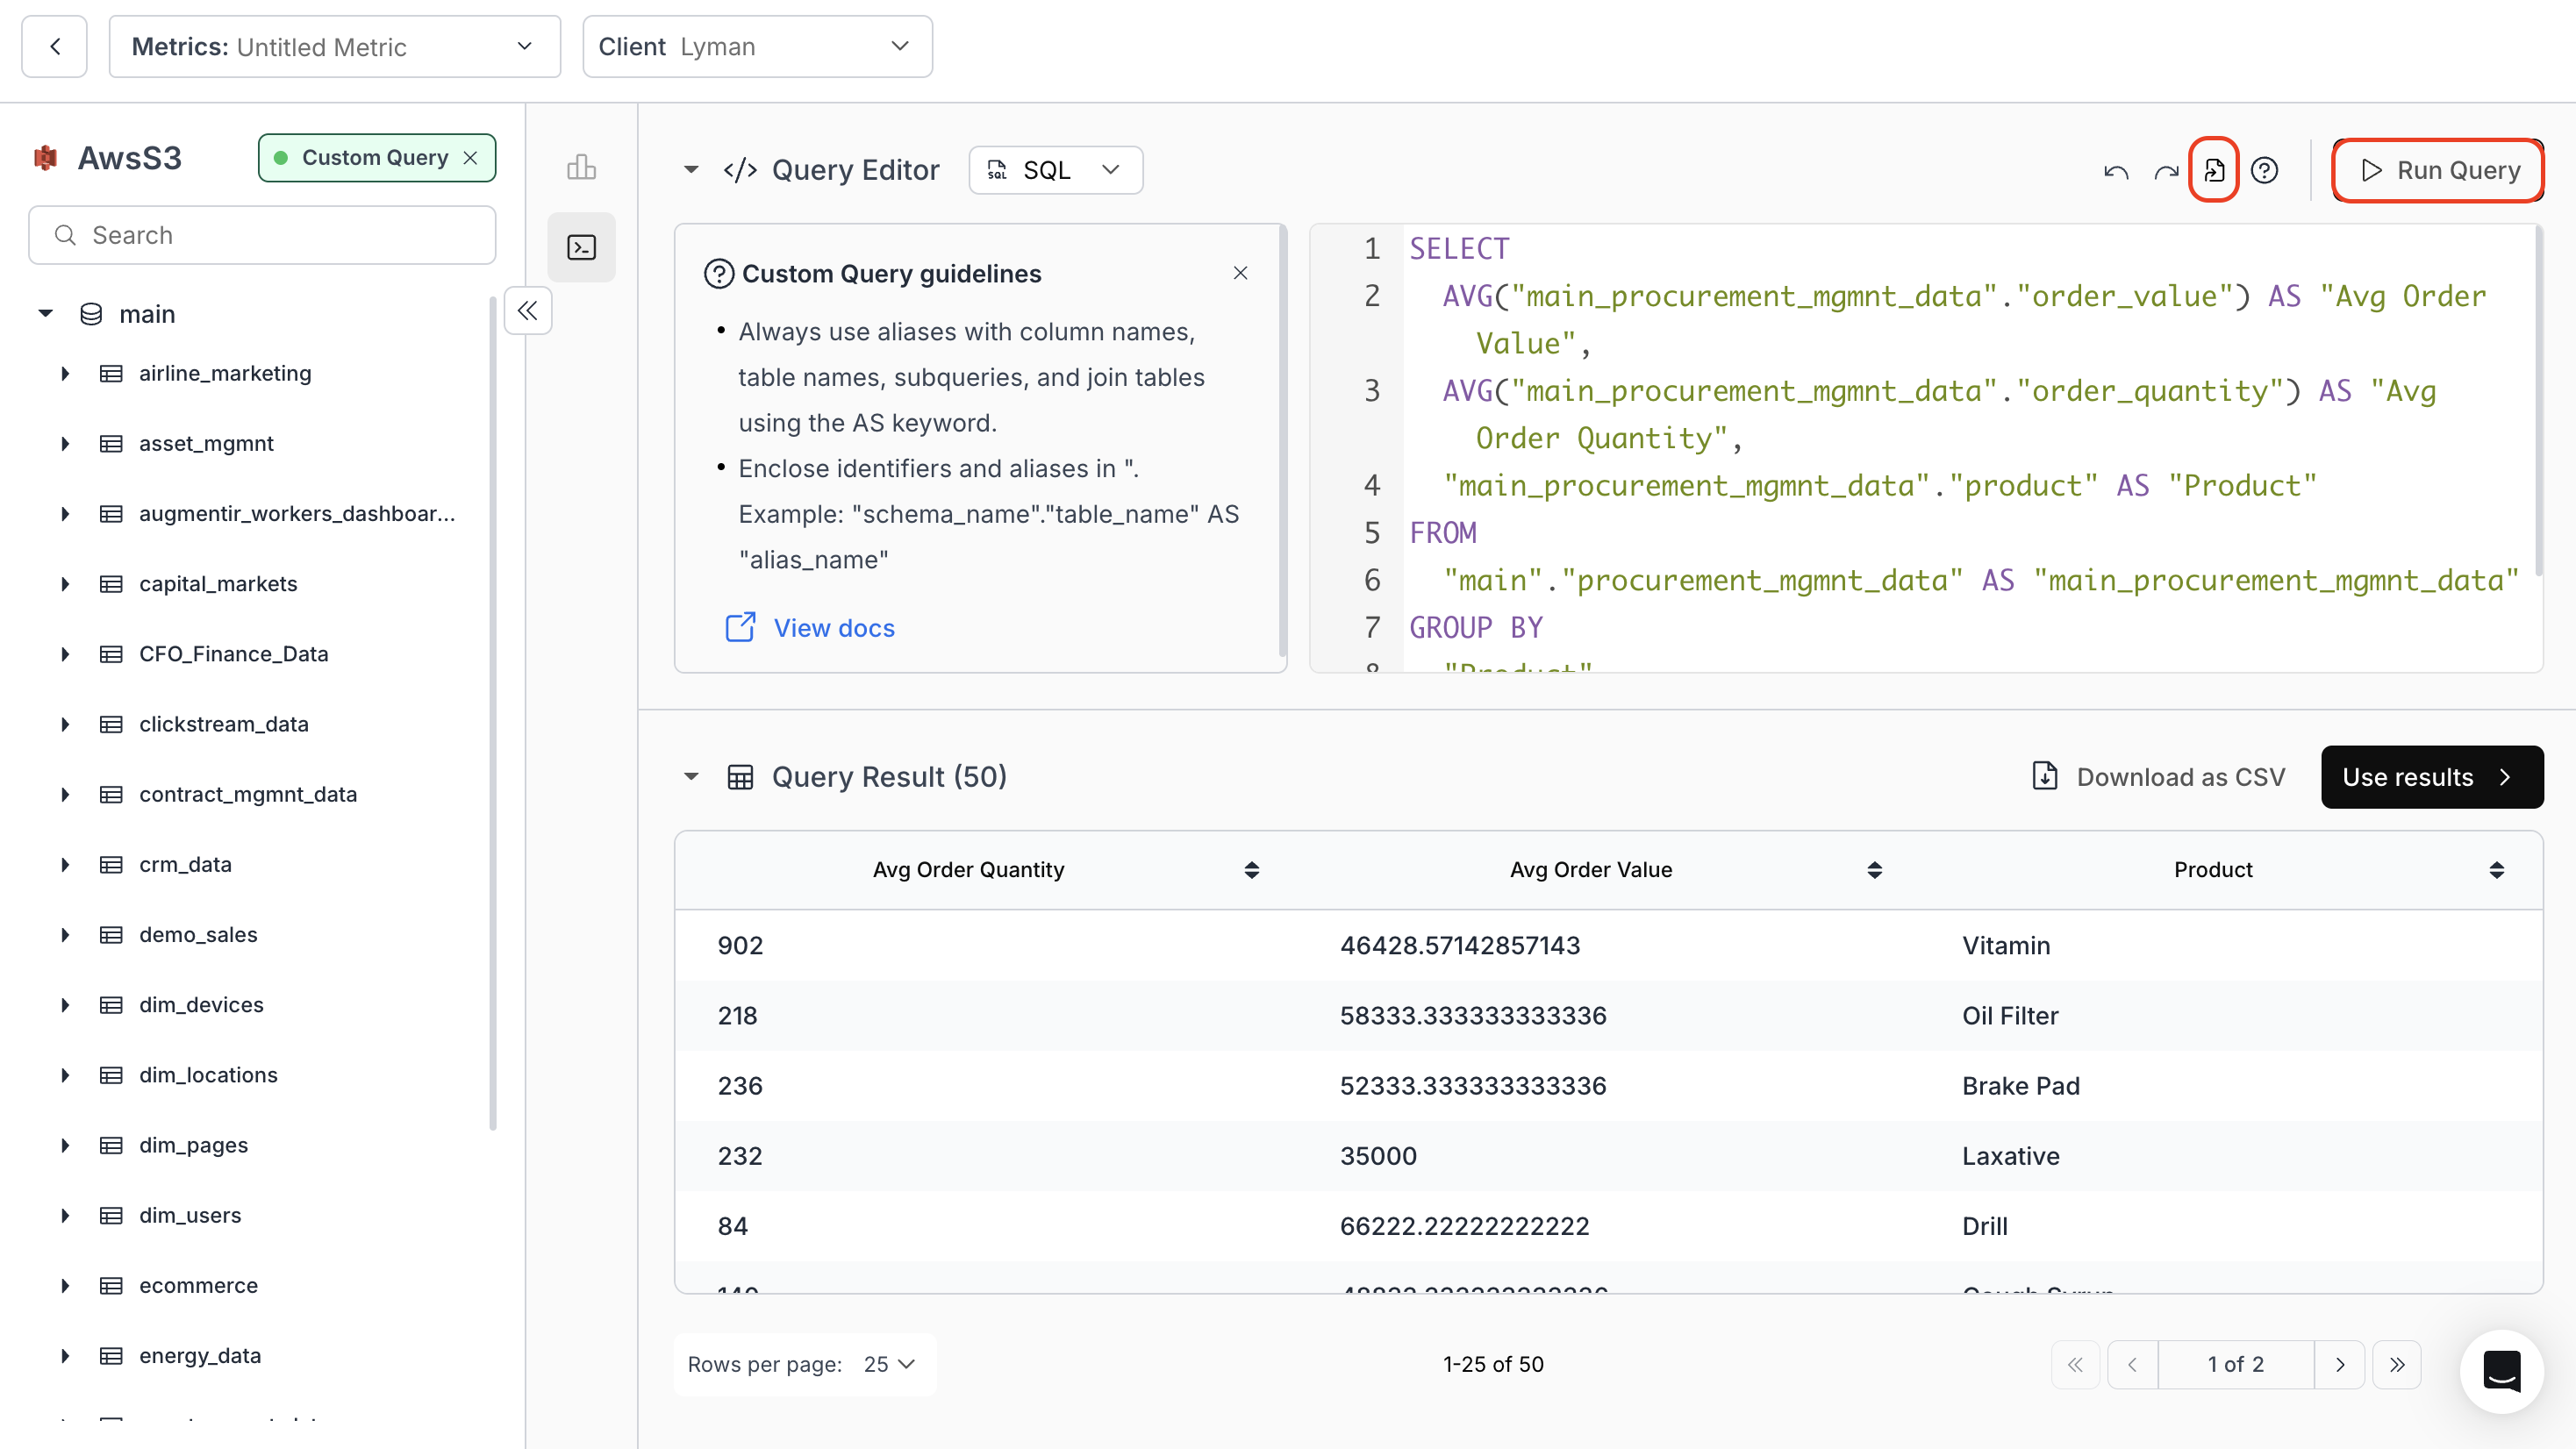
 ### 2. **Writing SQL Scripts**
* Enter your SQL code and click **"Run Query"** to generate the chart.
* (Optional) Use the **"Format Query with AI"** option to ensure proper formatting of your query.
* **Query Result** displays the data returned for your SQL query. This data can be downloaded as a CSV file if required.
### 2. **Writing SQL Scripts**
* Enter your SQL code and click **"Run Query"** to generate the chart.
* (Optional) Use the **"Format Query with AI"** option to ensure proper formatting of your query.
* **Query Result** displays the data returned for your SQL query. This data can be downloaded as a CSV file if required.
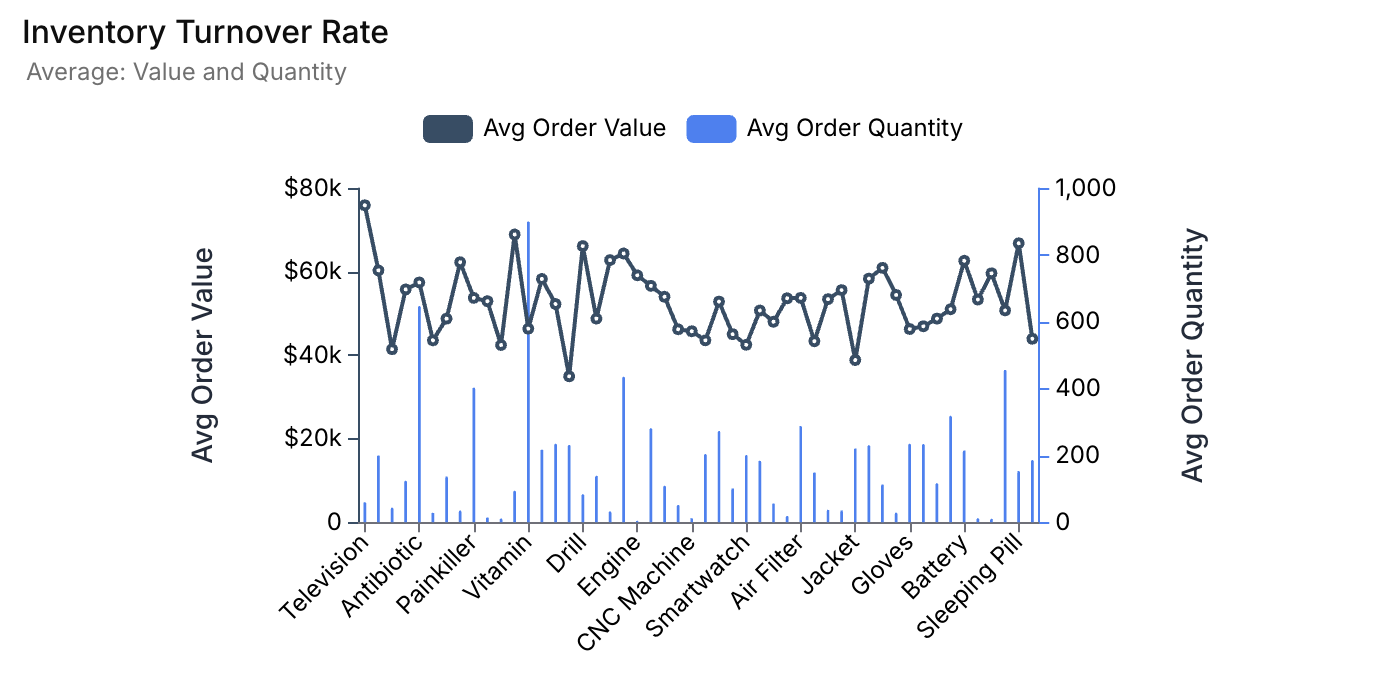
 ### 3. **Usage Example**
Below is an example SQL code to visualize the value and quantity of all orders based on the products ordered.
```sql theme={"dark"}
SELECT
AVG("main_procurement_mgmnt_data"."order_value") AS "Avg Order Value",
AVG("main_procurement_mgmnt_data"."order_quantity") AS "Avg Order Quantity",
"main_procurement_mgmnt_data"."product" AS "Product"
FROM
"main"."procurement_mgmnt_data" AS "main_procurement_mgmnt_data"
GROUP BY
"Product"
LIMIT
100
```
### 4. **Output of the above SQL Code**
### 3. **Usage Example**
Below is an example SQL code to visualize the value and quantity of all orders based on the products ordered.
```sql theme={"dark"}
SELECT
AVG("main_procurement_mgmnt_data"."order_value") AS "Avg Order Value",
AVG("main_procurement_mgmnt_data"."order_quantity") AS "Avg Order Quantity",
"main_procurement_mgmnt_data"."product" AS "Product"
FROM
"main"."procurement_mgmnt_data" AS "main_procurement_mgmnt_data"
GROUP BY
"Product"
LIMIT
100
```
### 4. **Output of the above SQL Code**