> ## Documentation Index
> Fetch the complete documentation index at: https://docs.usedatabrain.com/llms.txt
> Use this file to discover all available pages before exploring further.
# Group By
> This guide offers a straightforward method for organizing data by using the "Group By" feature, enhancing data analysis efficiency.
### 1. **Access Group By**
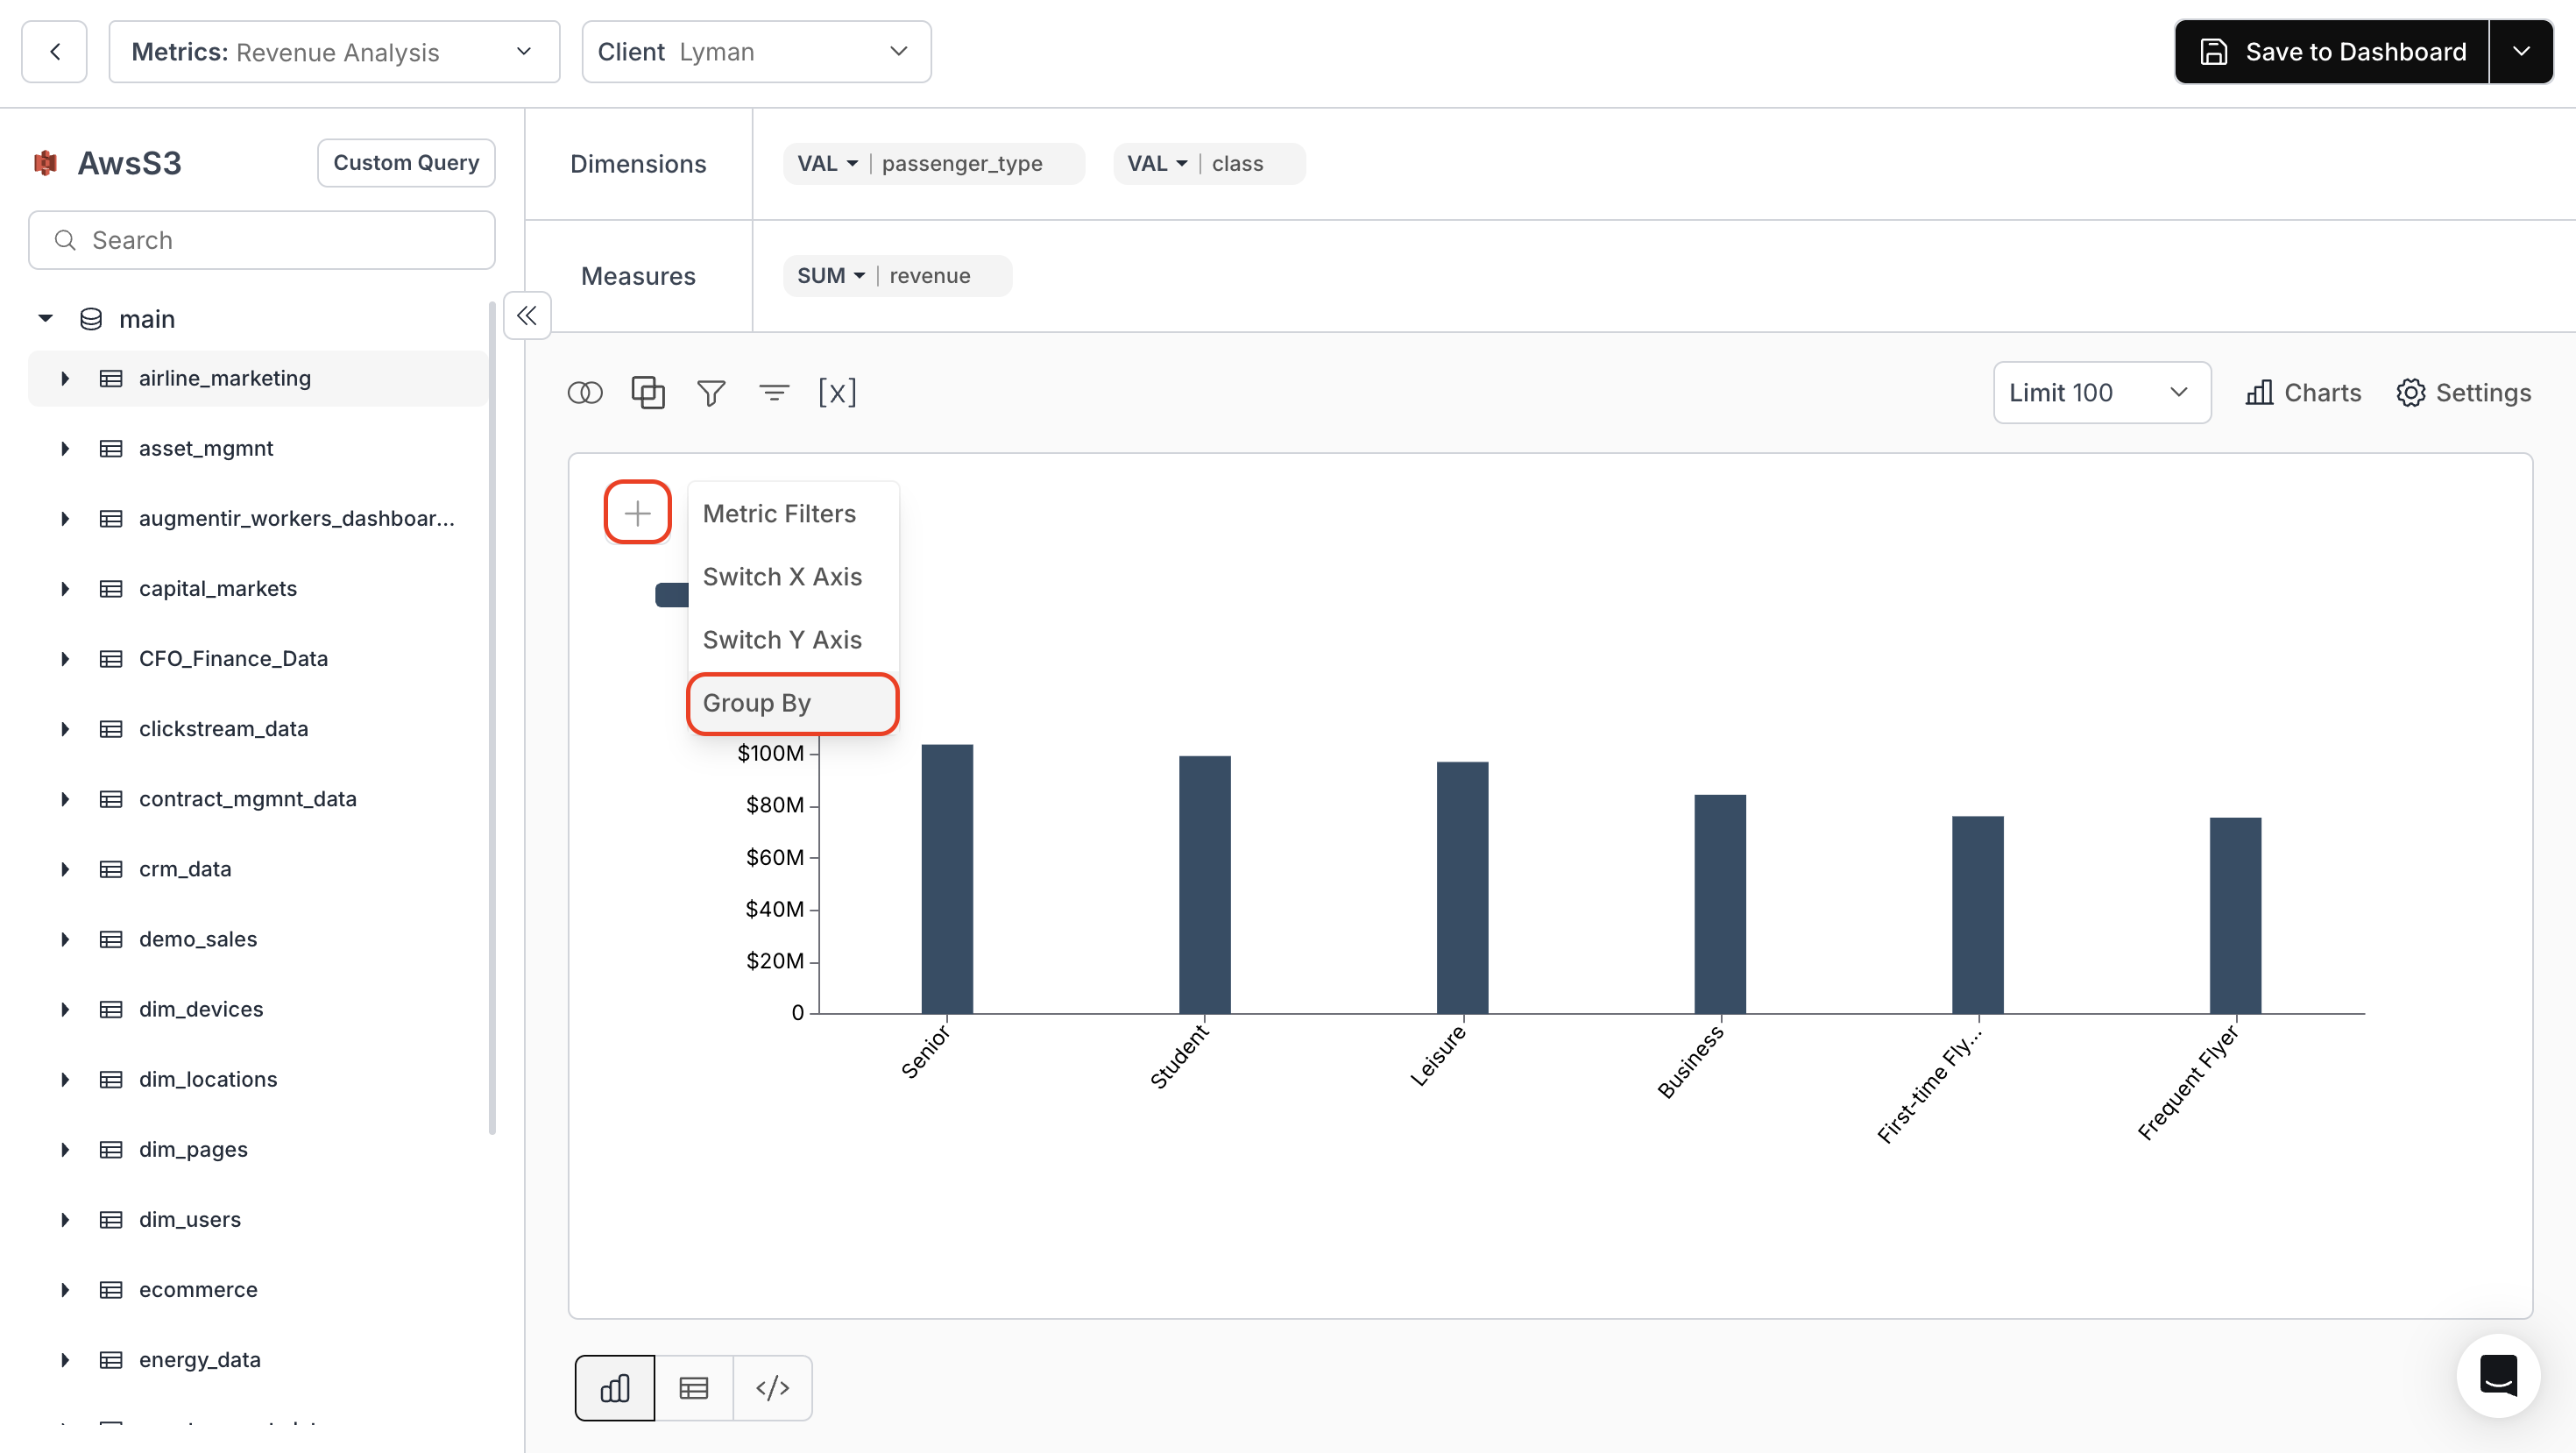
Click the "+" icon at the top of the metric and select the **"Group By"** button.
 ### 2. **Group By a single column**
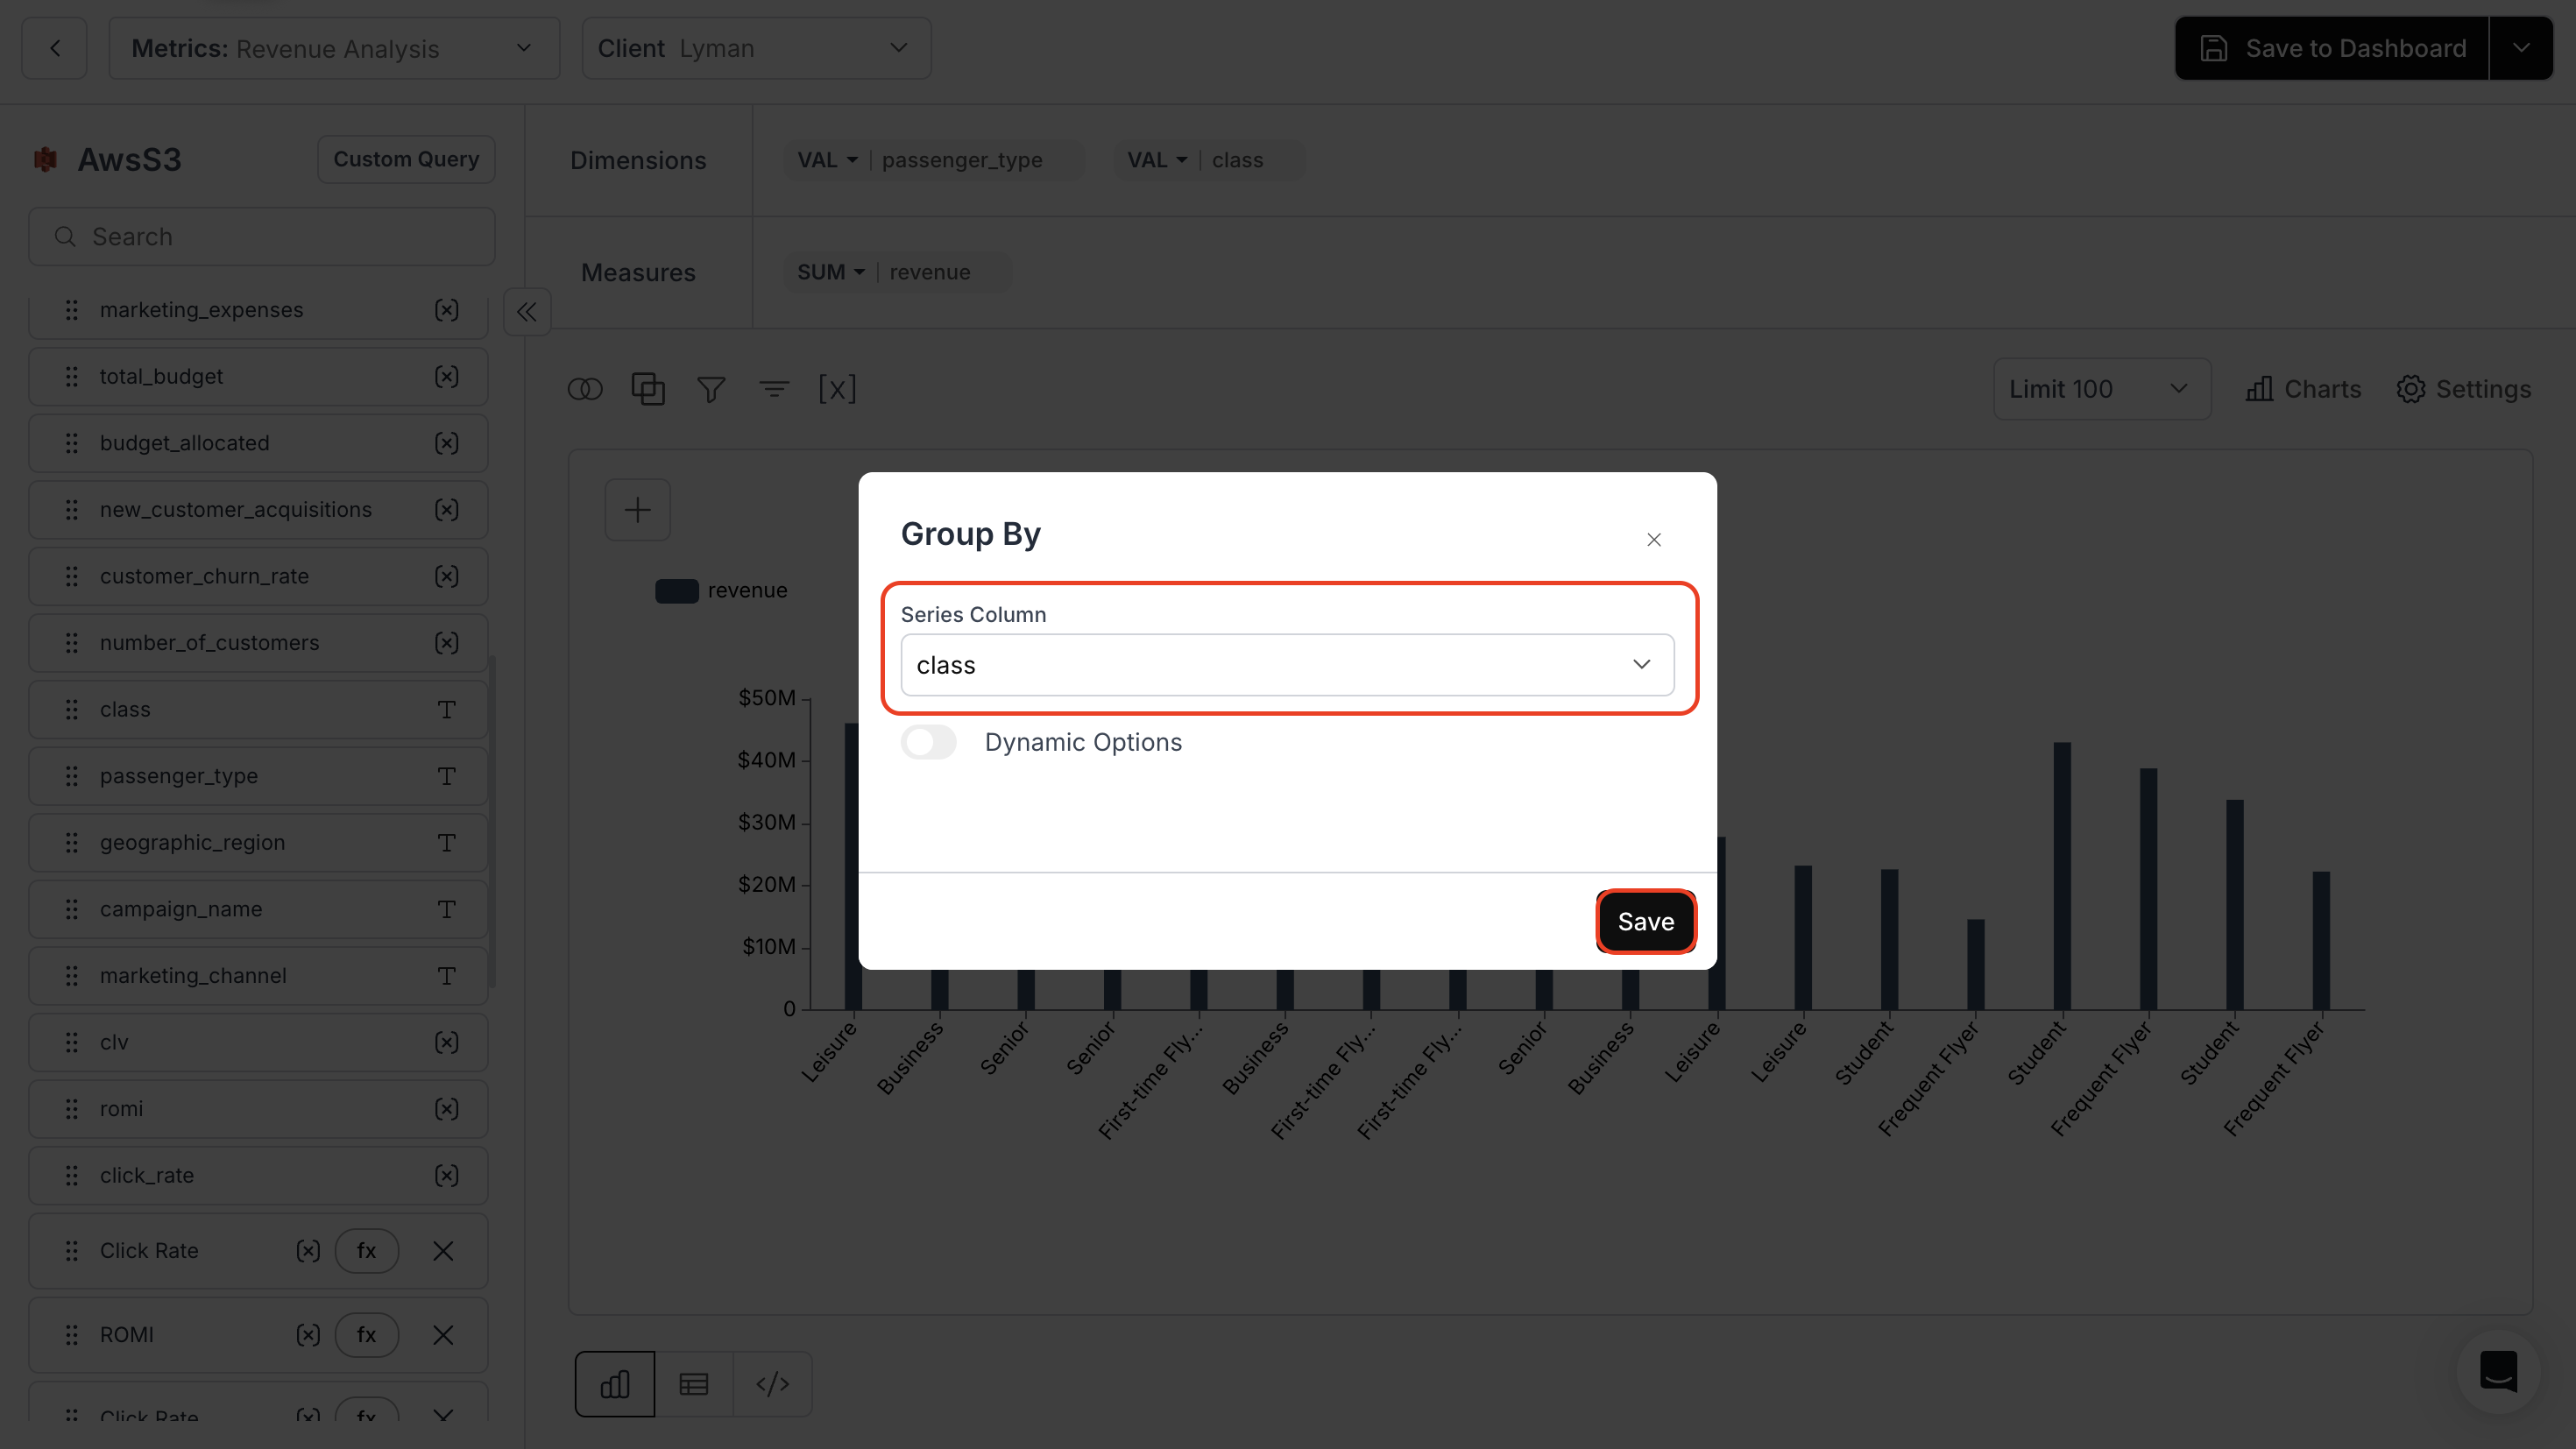
Choose the column you want to group in the **“Series Column”** field.
### 2. **Group By a single column**
Choose the column you want to group in the **“Series Column”** field.
 ### 3. **Group By multiple columns**
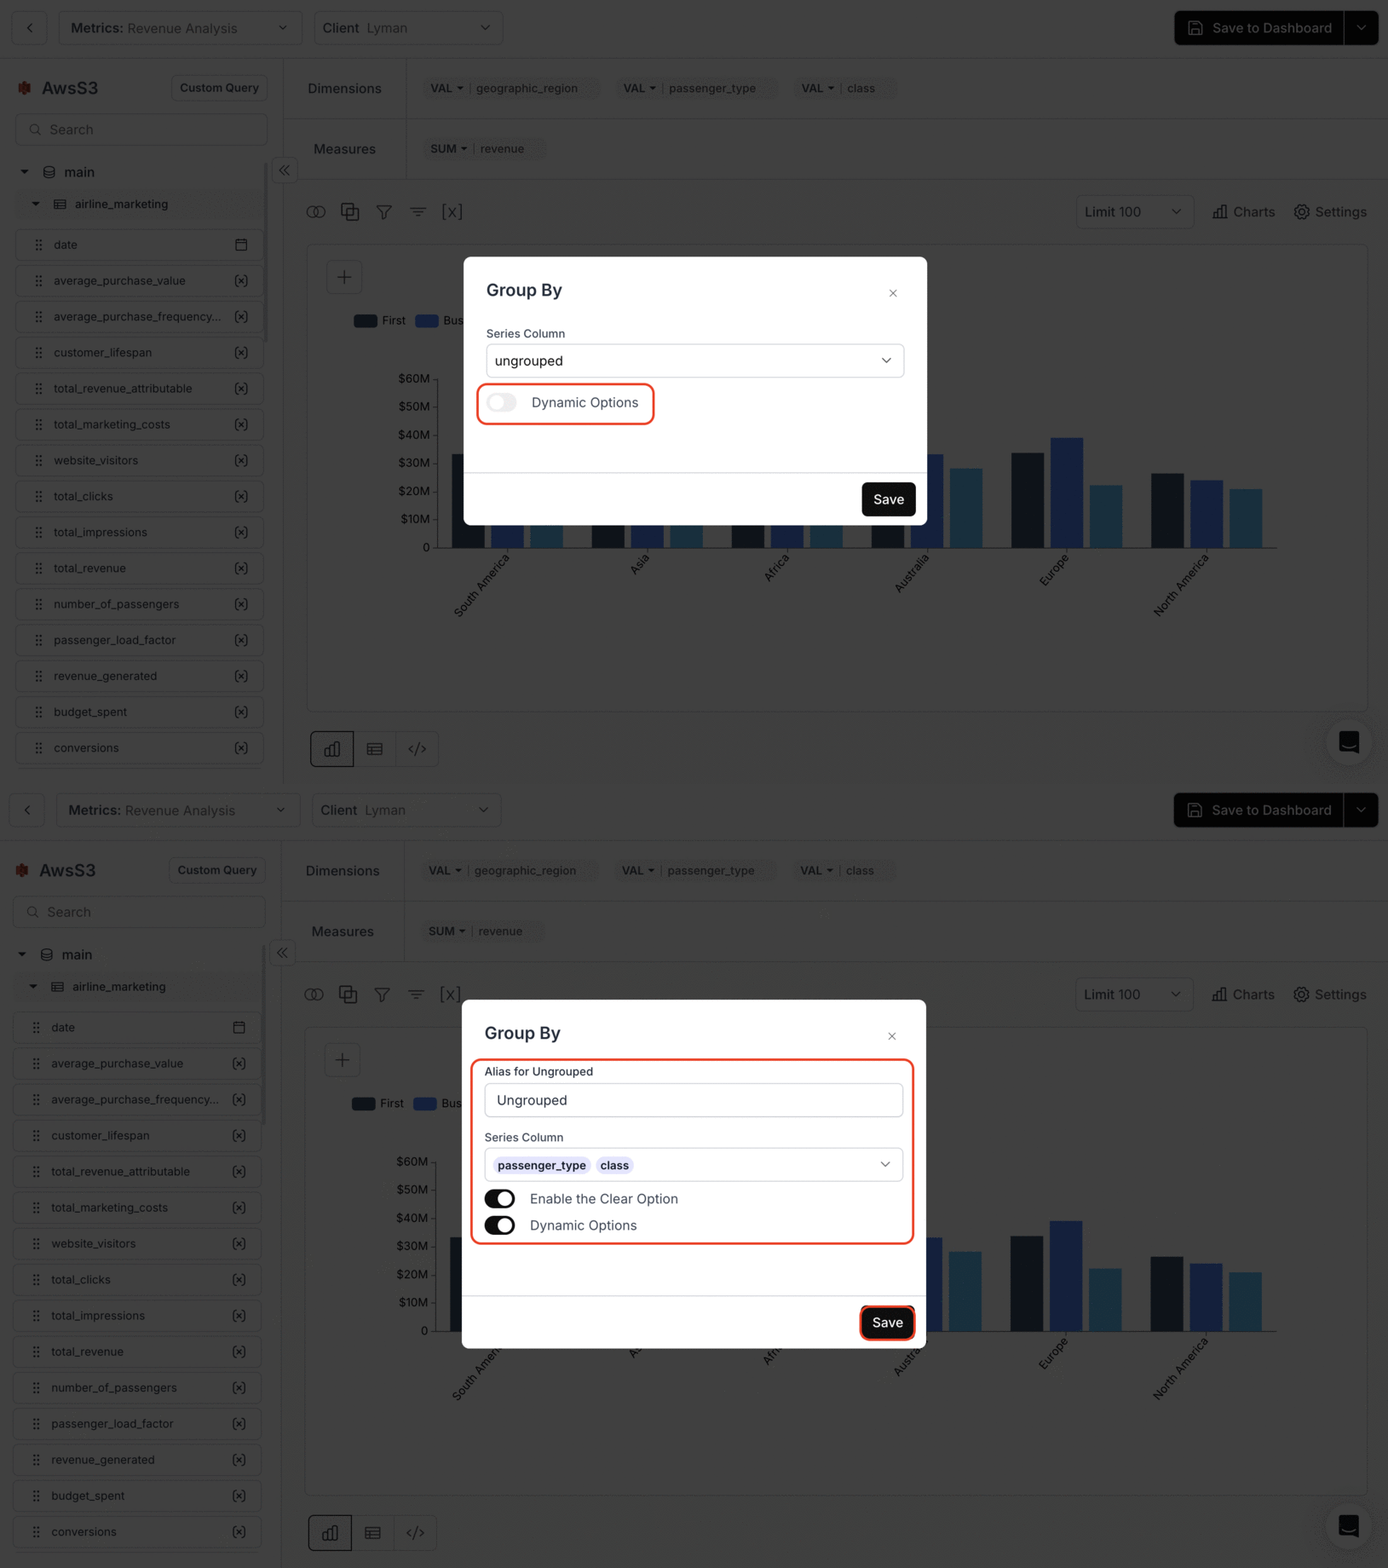
* Enable the toggle of **"Dynamic Options"** to group by multiple columns.
* If necessary, enable the **"Enable the Clear Option"** toggle.
* Select the columns you want to group from the **"Series Column"** drop-down.
### 3. **Group By multiple columns**
* Enable the toggle of **"Dynamic Options"** to group by multiple columns.
* If necessary, enable the **"Enable the Clear Option"** toggle.
* Select the columns you want to group from the **"Series Column"** drop-down.
 ### 4. **Apply Filters**
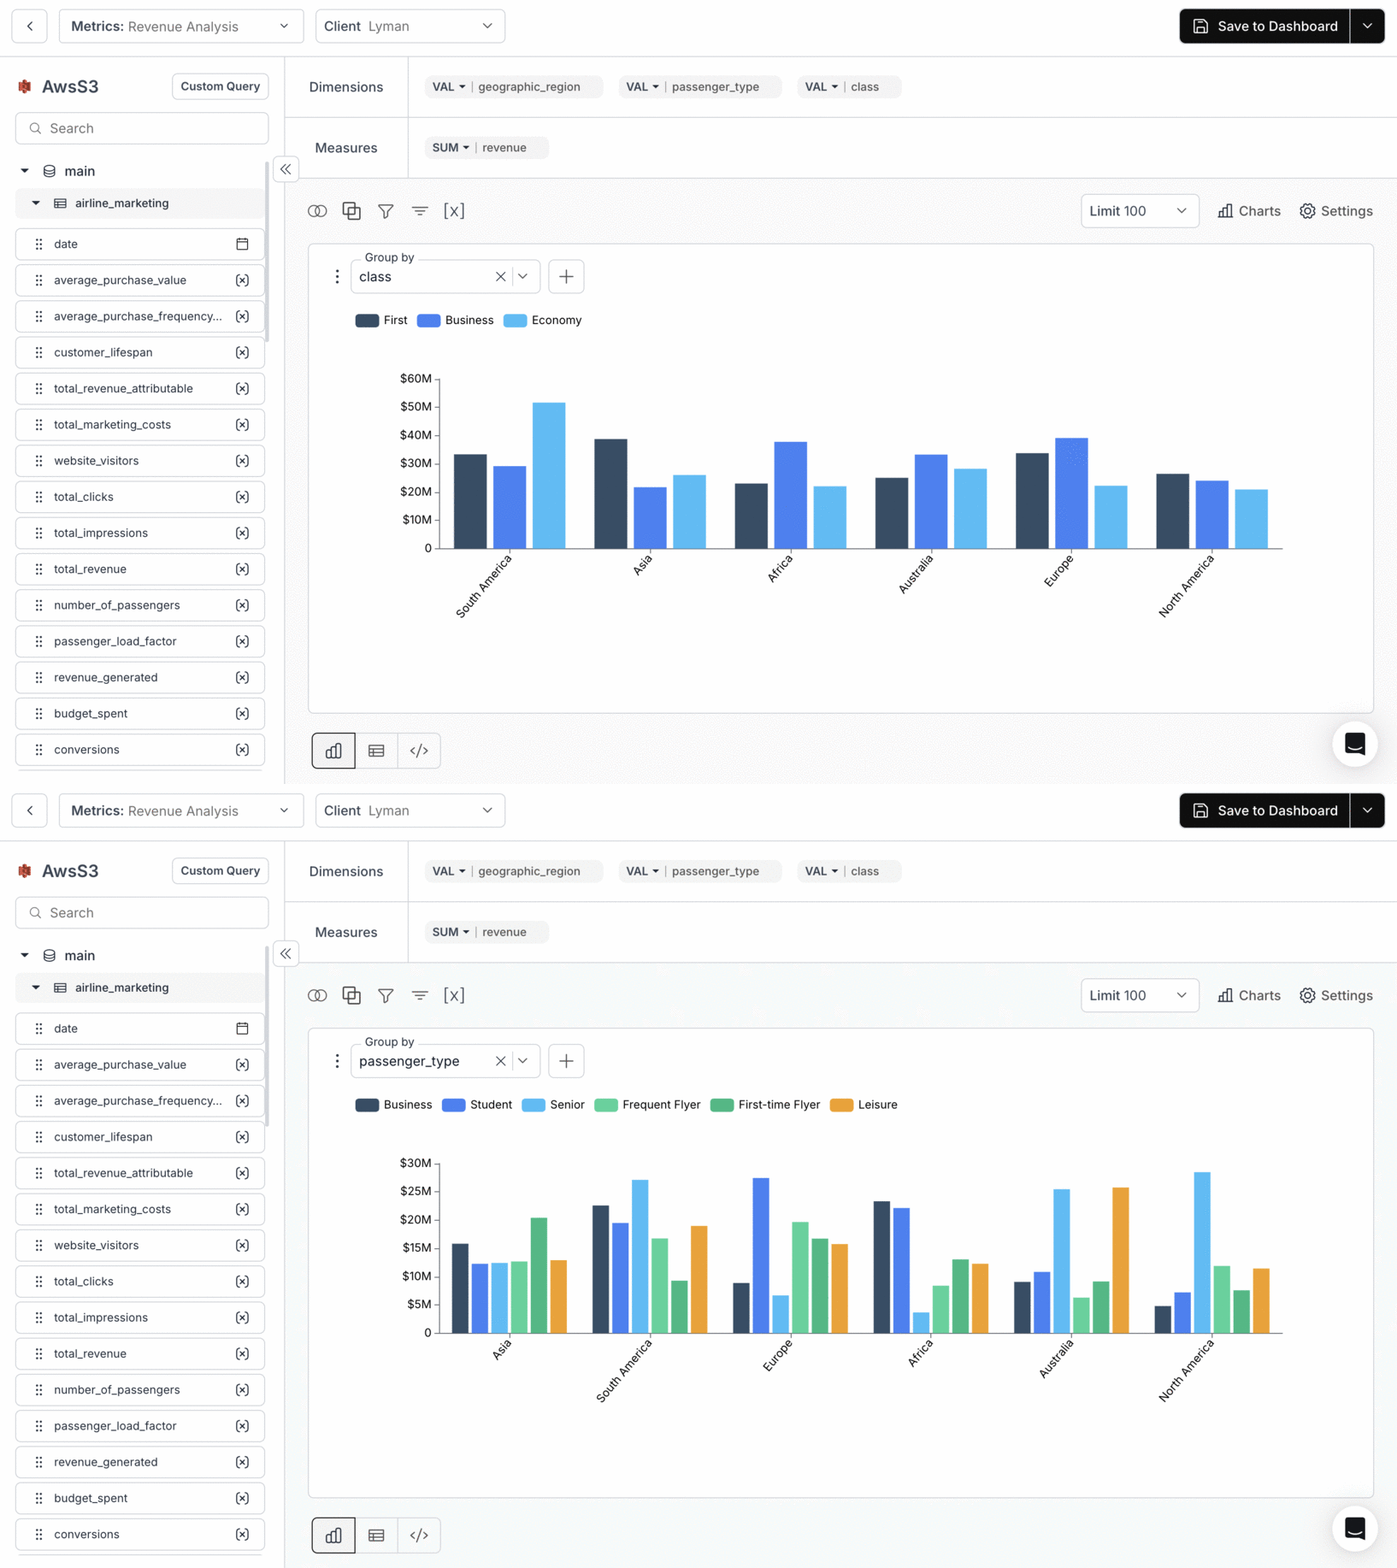
Use filters to view the dynamic changes in your grouped data.
### 4. **Apply Filters**
Use filters to view the dynamic changes in your grouped data.
 You’ve successfully applied Group By to your metric!\
Your visualization now organizes data by the selected columns, enabling clearer comparisons and deeper segmented analysis.
You’ve successfully applied Group By to your metric!\
Your visualization now organizes data by the selected columns, enabling clearer comparisons and deeper segmented analysis.