> ## Documentation Index
> Fetch the complete documentation index at: https://docs.usedatabrain.com/llms.txt
> Use this file to discover all available pages before exploring further.
# Merge Metrics
> This guide provides a straightforward approach to customize your dashboard layout more dynamically by merging metric cards. This enhances readability and streamlines related metrics.
1. **Access Layout Customization**
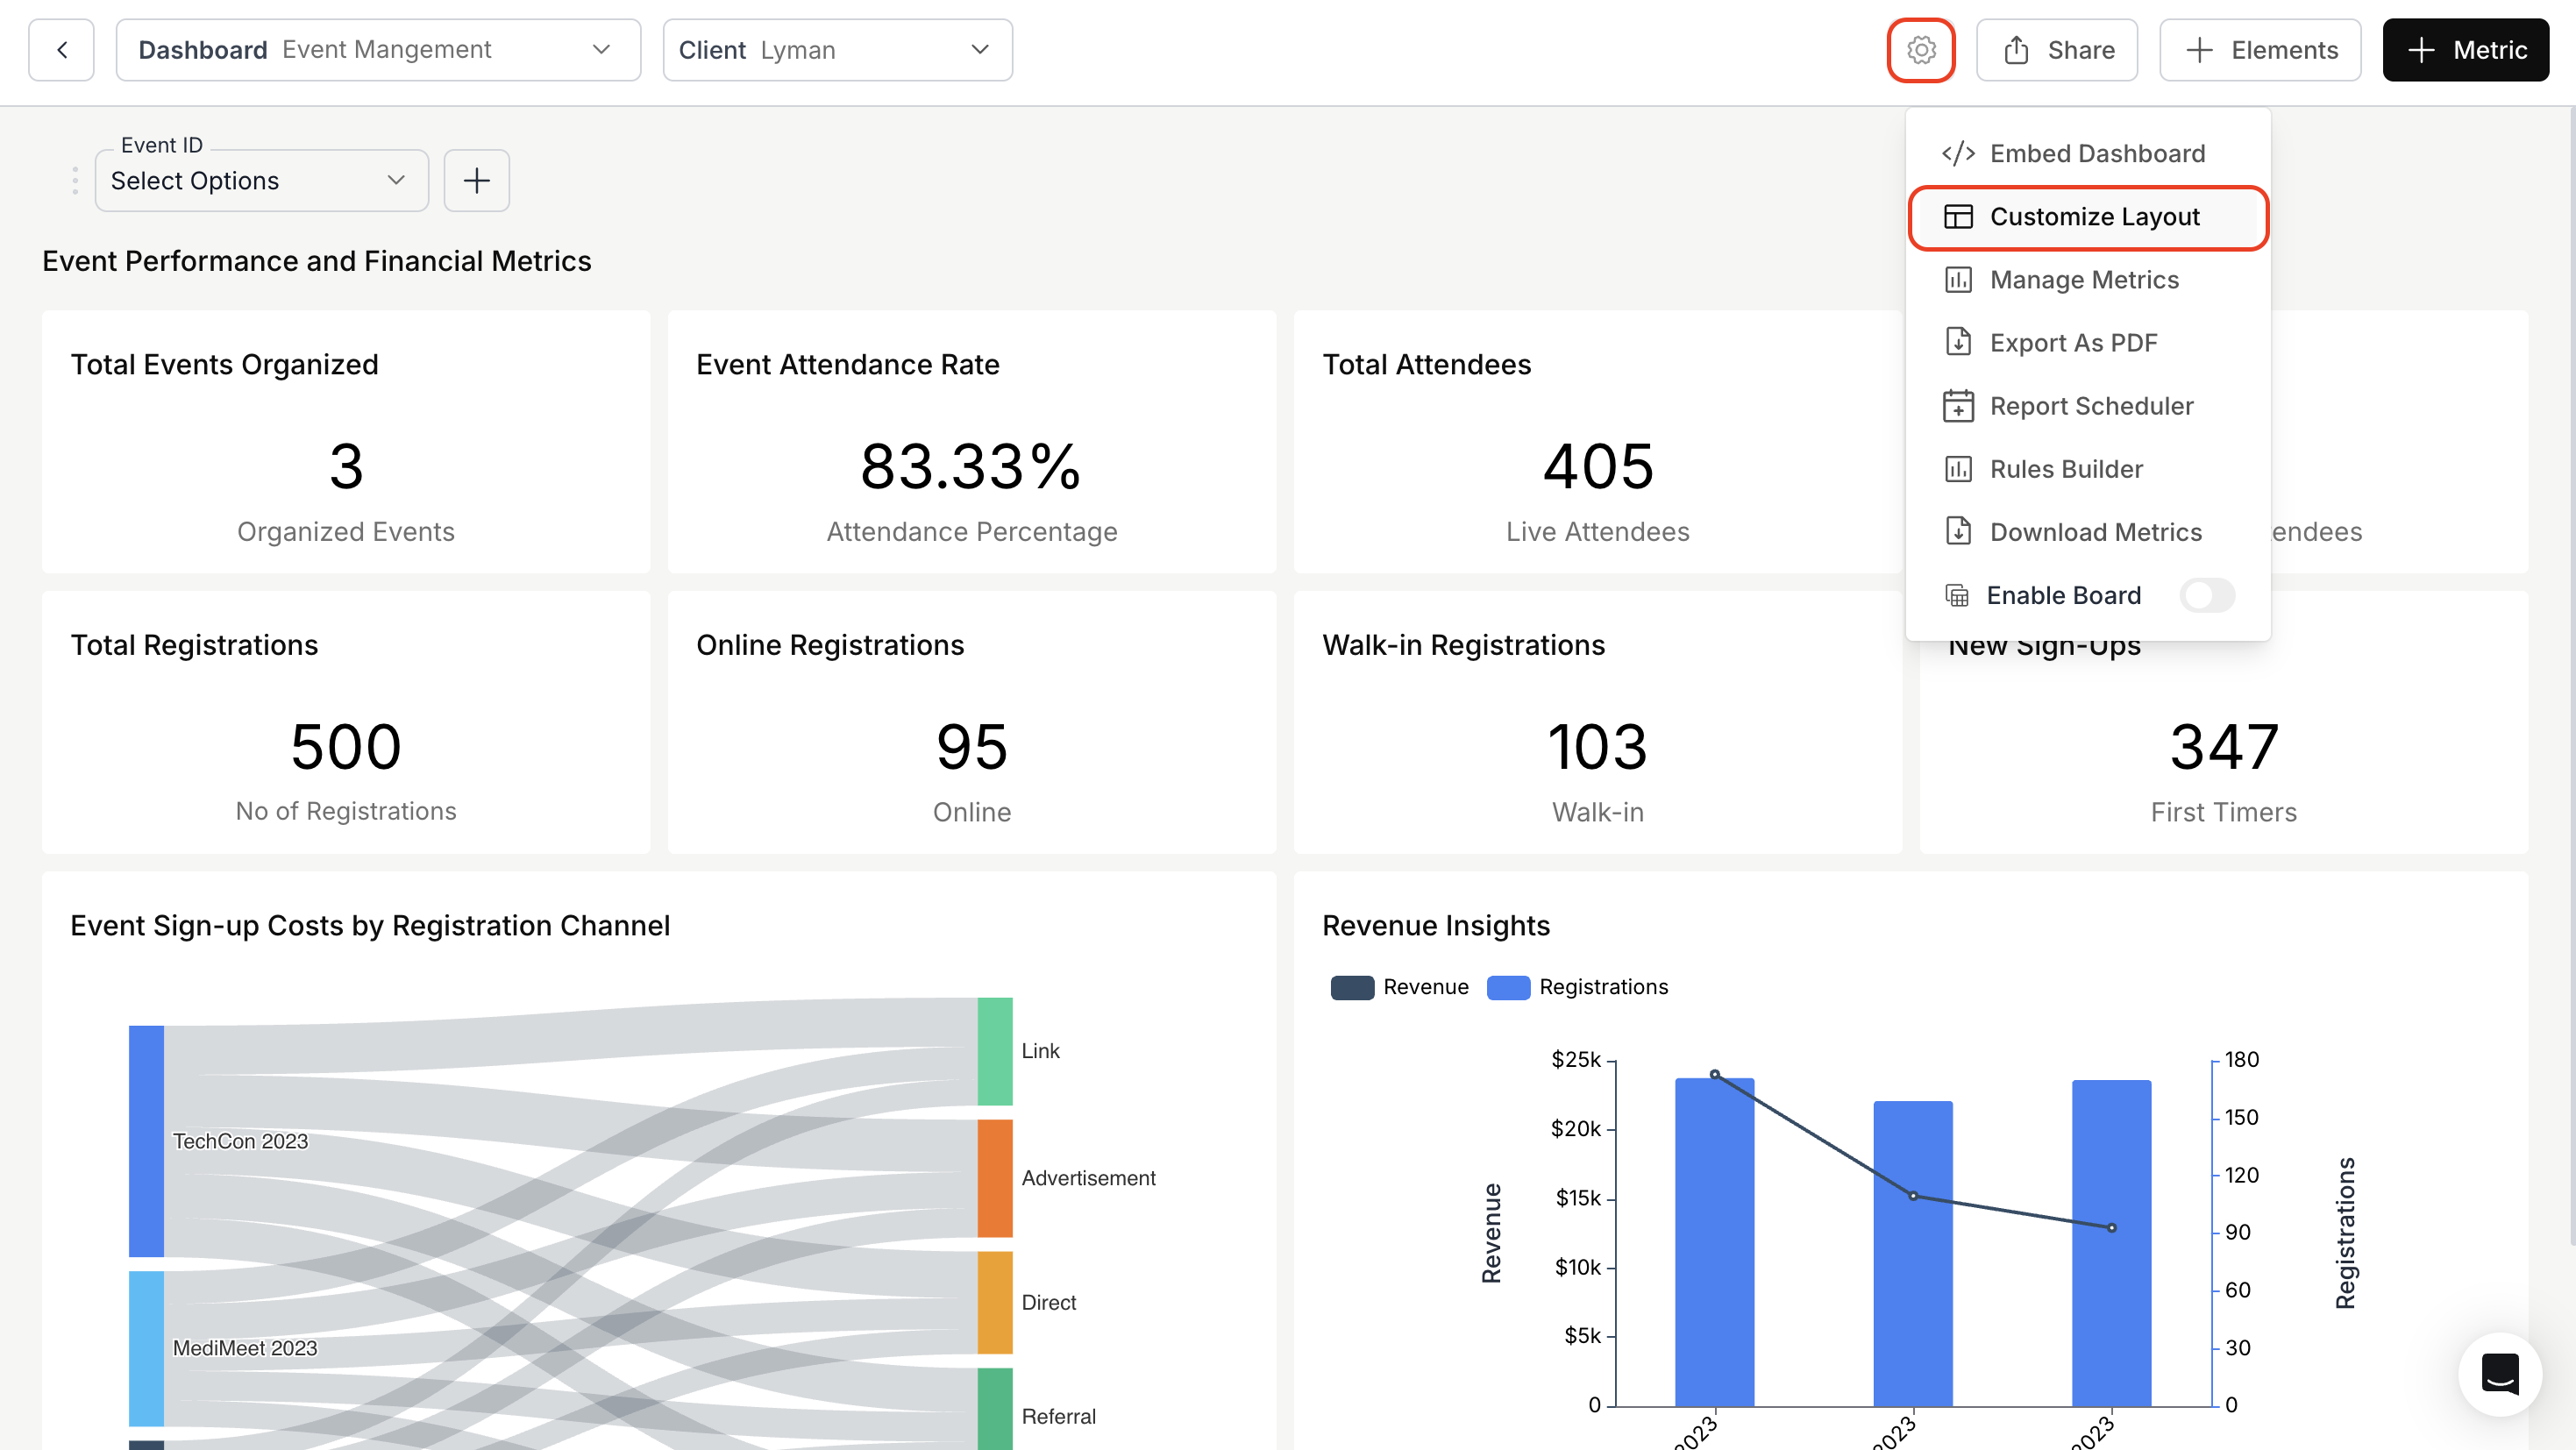
In the Dashboard page, click on **"Dashboard Settings"** in the top-right corner and select **"Customize Layout"** from the dropdown menu.
2. **Merge Metrics:**
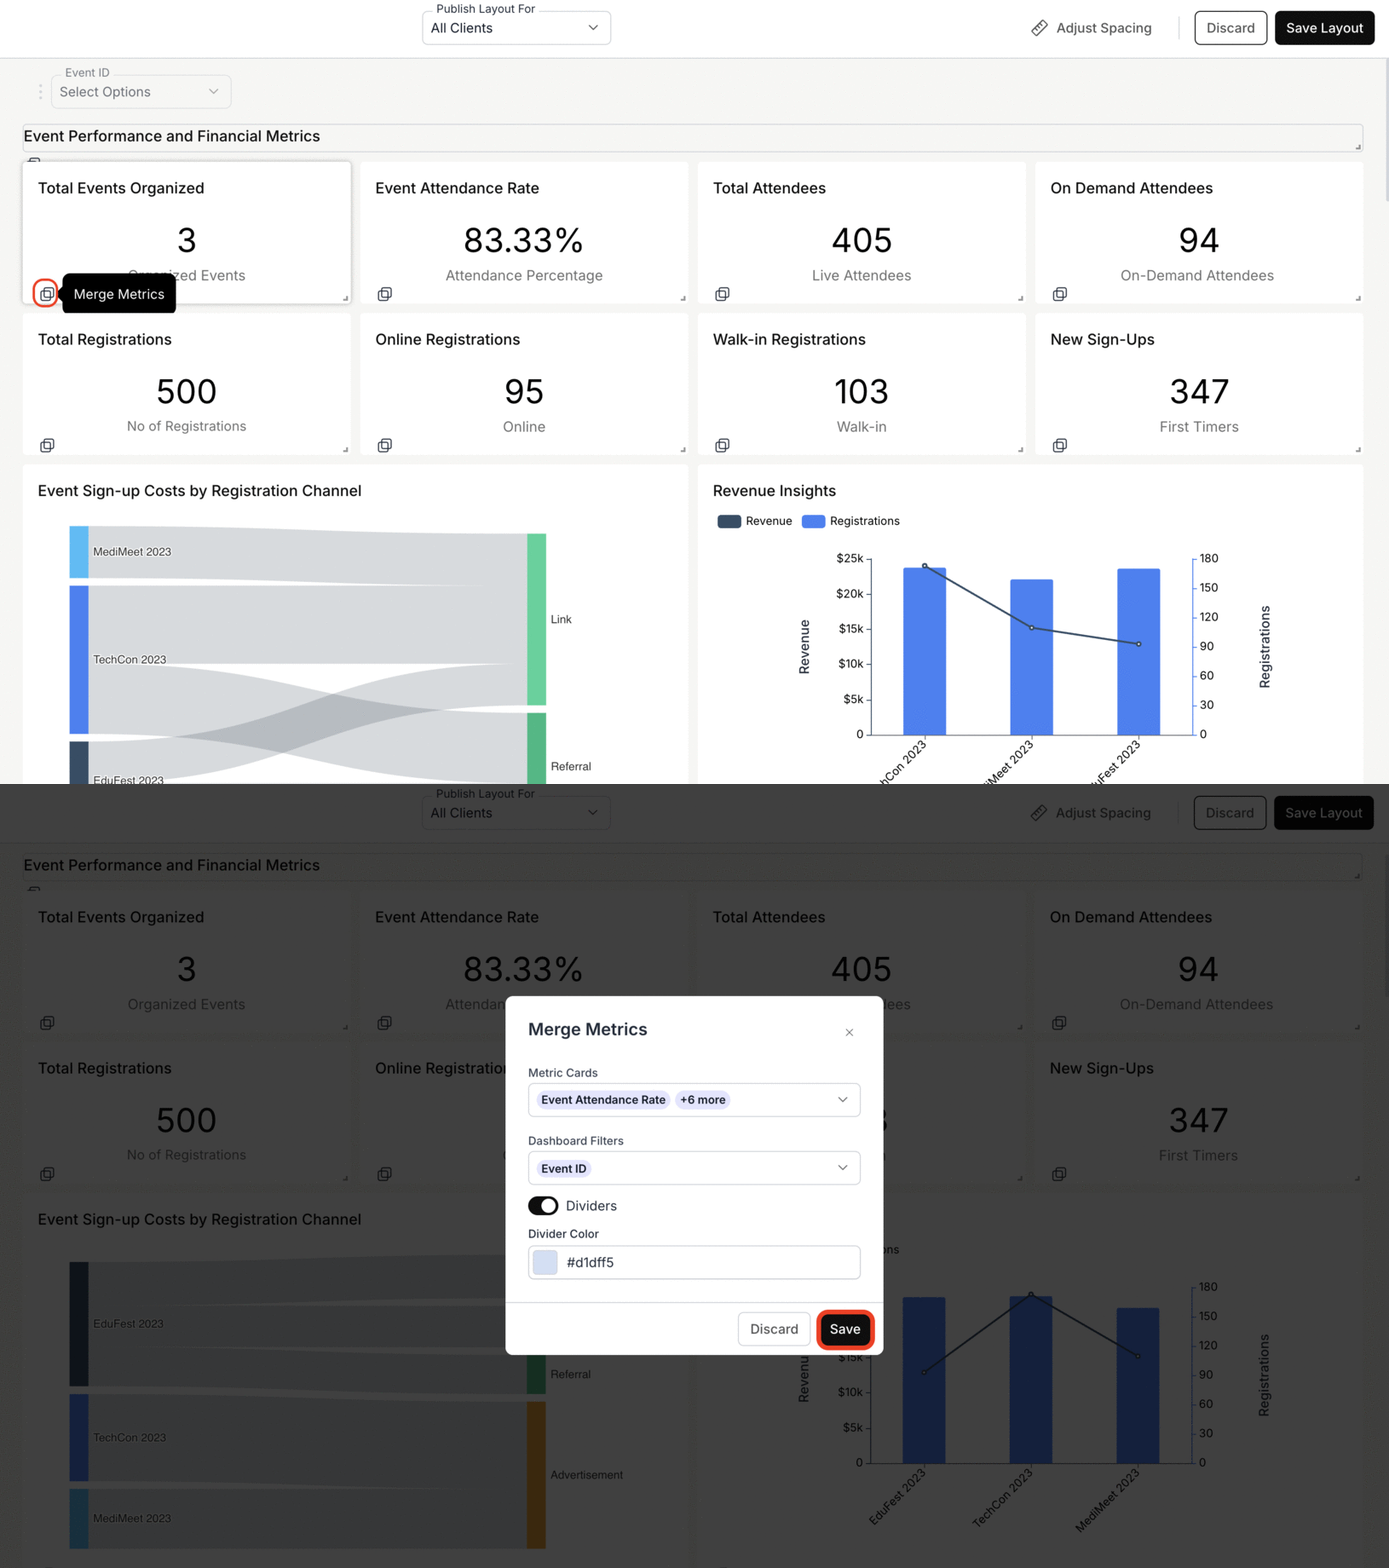
* Then, click on the **"Merge Metrics"** button located at the bottom left corner of the metric card.
* In the **"Merge Metrics"** dialog box, select the metric you want to merge and choose the **"Dashboard Filters"** you want to add to the section.
* Finally, click **"Save"** to confirm the selection.
When merging metrics, the dashboard filter can serve as a section filter, refining the displayed data by applying specific criteria to that section of the dashboard.
For more details on section filter, kindly refer the below link:
3. **Publish the Layout:**
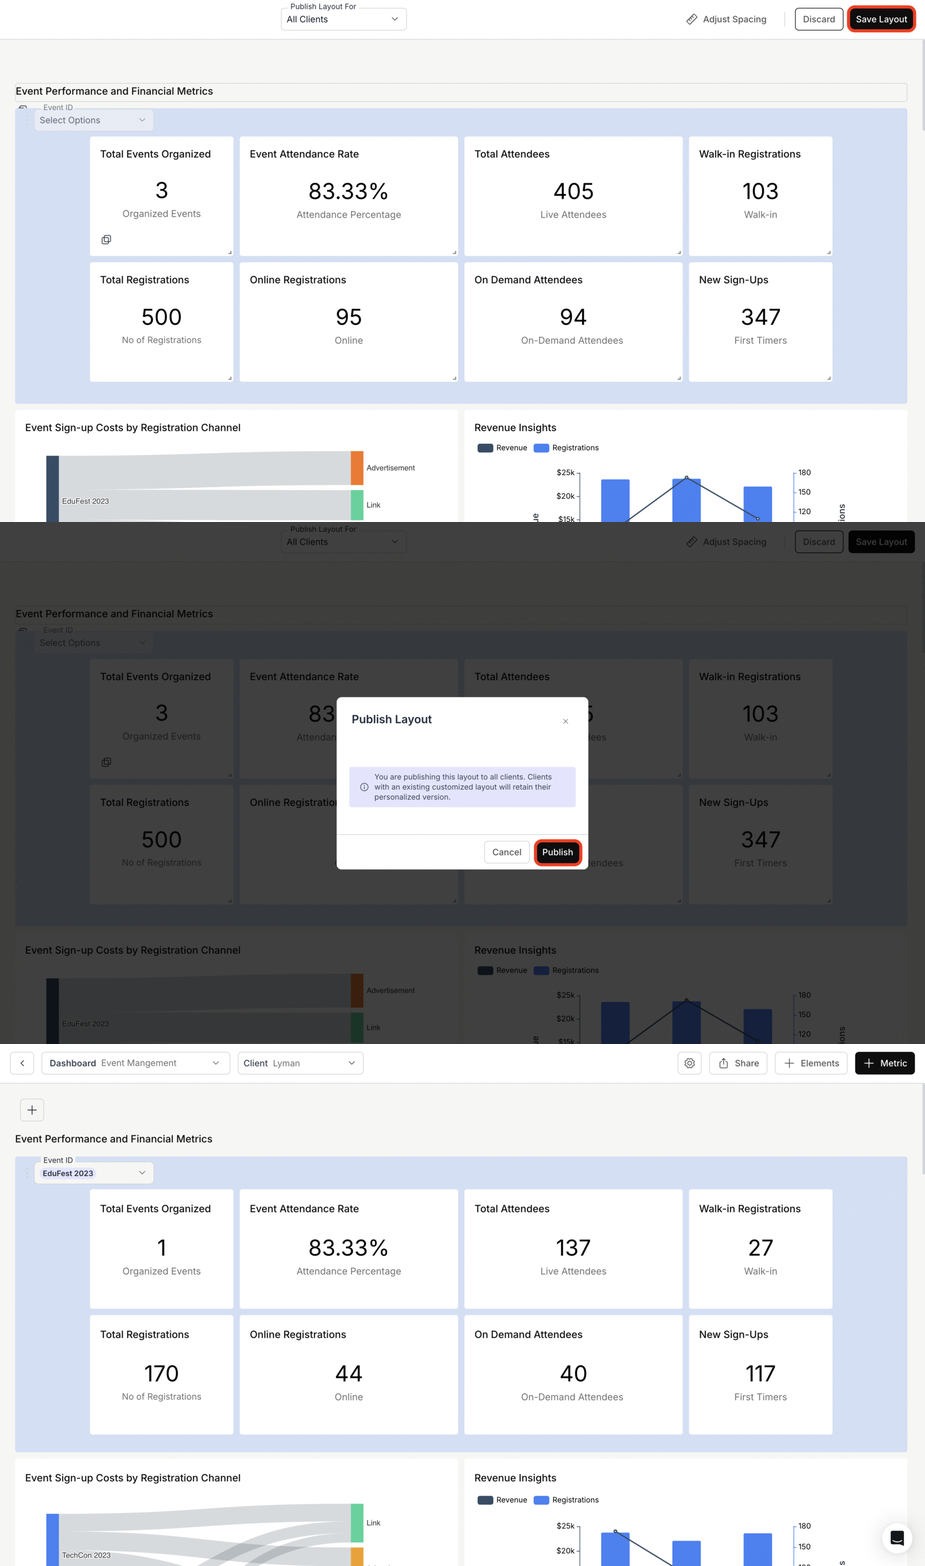
* Rearrange the metrics according to your choice.
* Click **"Save Layout"** to save your changes, then click **"Publish"** to finalize them.
* After publishing, you can view the merged metrics in the dashboard.
You’ve successfully merged your metrics and published the updated layout!\
Your dashboard is now more organized, readable, and optimized for cleaner insight discovery.
 2. **Merge Metrics:**
* Then, click on the **"Merge Metrics"** button located at the bottom left corner of the metric card.
* In the **"Merge Metrics"** dialog box, select the metric you want to merge and choose the **"Dashboard Filters"** you want to add to the section.
* Finally, click **"Save"** to confirm the selection.
2. **Merge Metrics:**
* Then, click on the **"Merge Metrics"** button located at the bottom left corner of the metric card.
* In the **"Merge Metrics"** dialog box, select the metric you want to merge and choose the **"Dashboard Filters"** you want to add to the section.
* Finally, click **"Save"** to confirm the selection.