> ## Documentation Index
> Fetch the complete documentation index at: https://docs.usedatabrain.com/llms.txt
> Use this file to discover all available pages before exploring further.
# Metric Summary
> This guide provides a straightforward process for creating metric summaries. These summaries can be added directly as text boxes within your dashboard, providing quick insights at a glance.
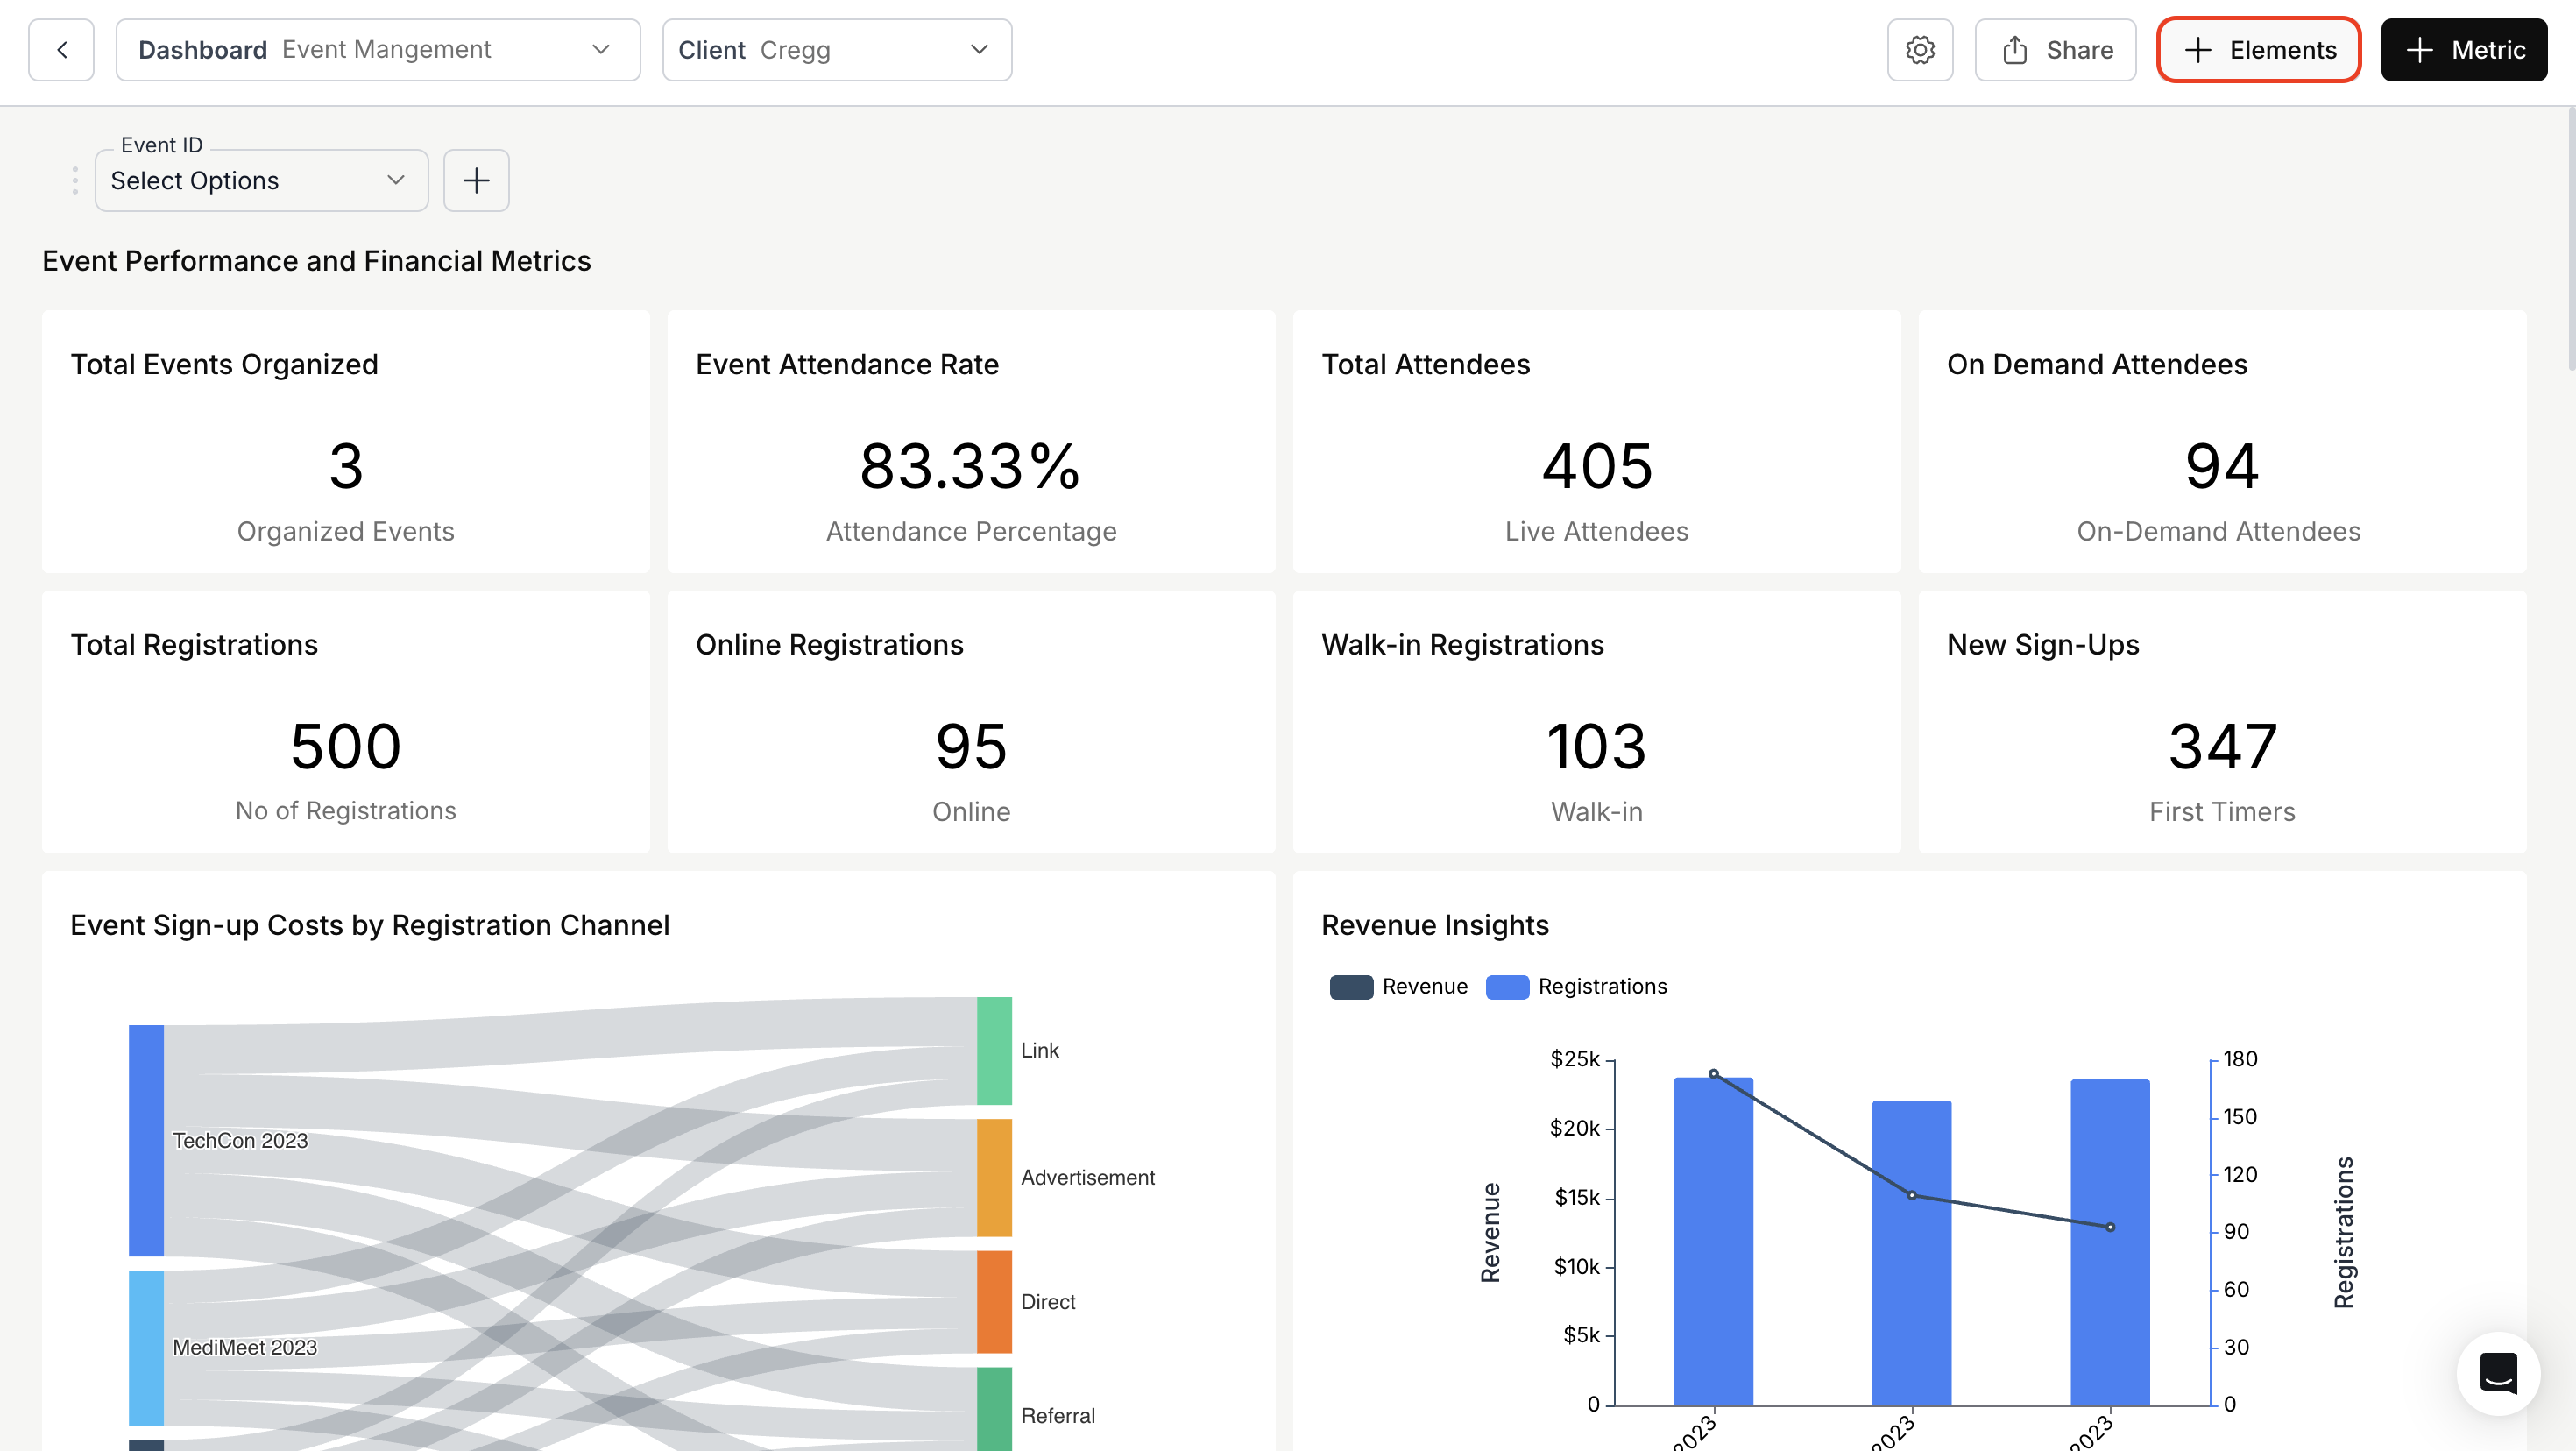
### 1. Navigate to Elements Section
Open your dashboard and click the **Elements** icon located next to the Add Metric button.
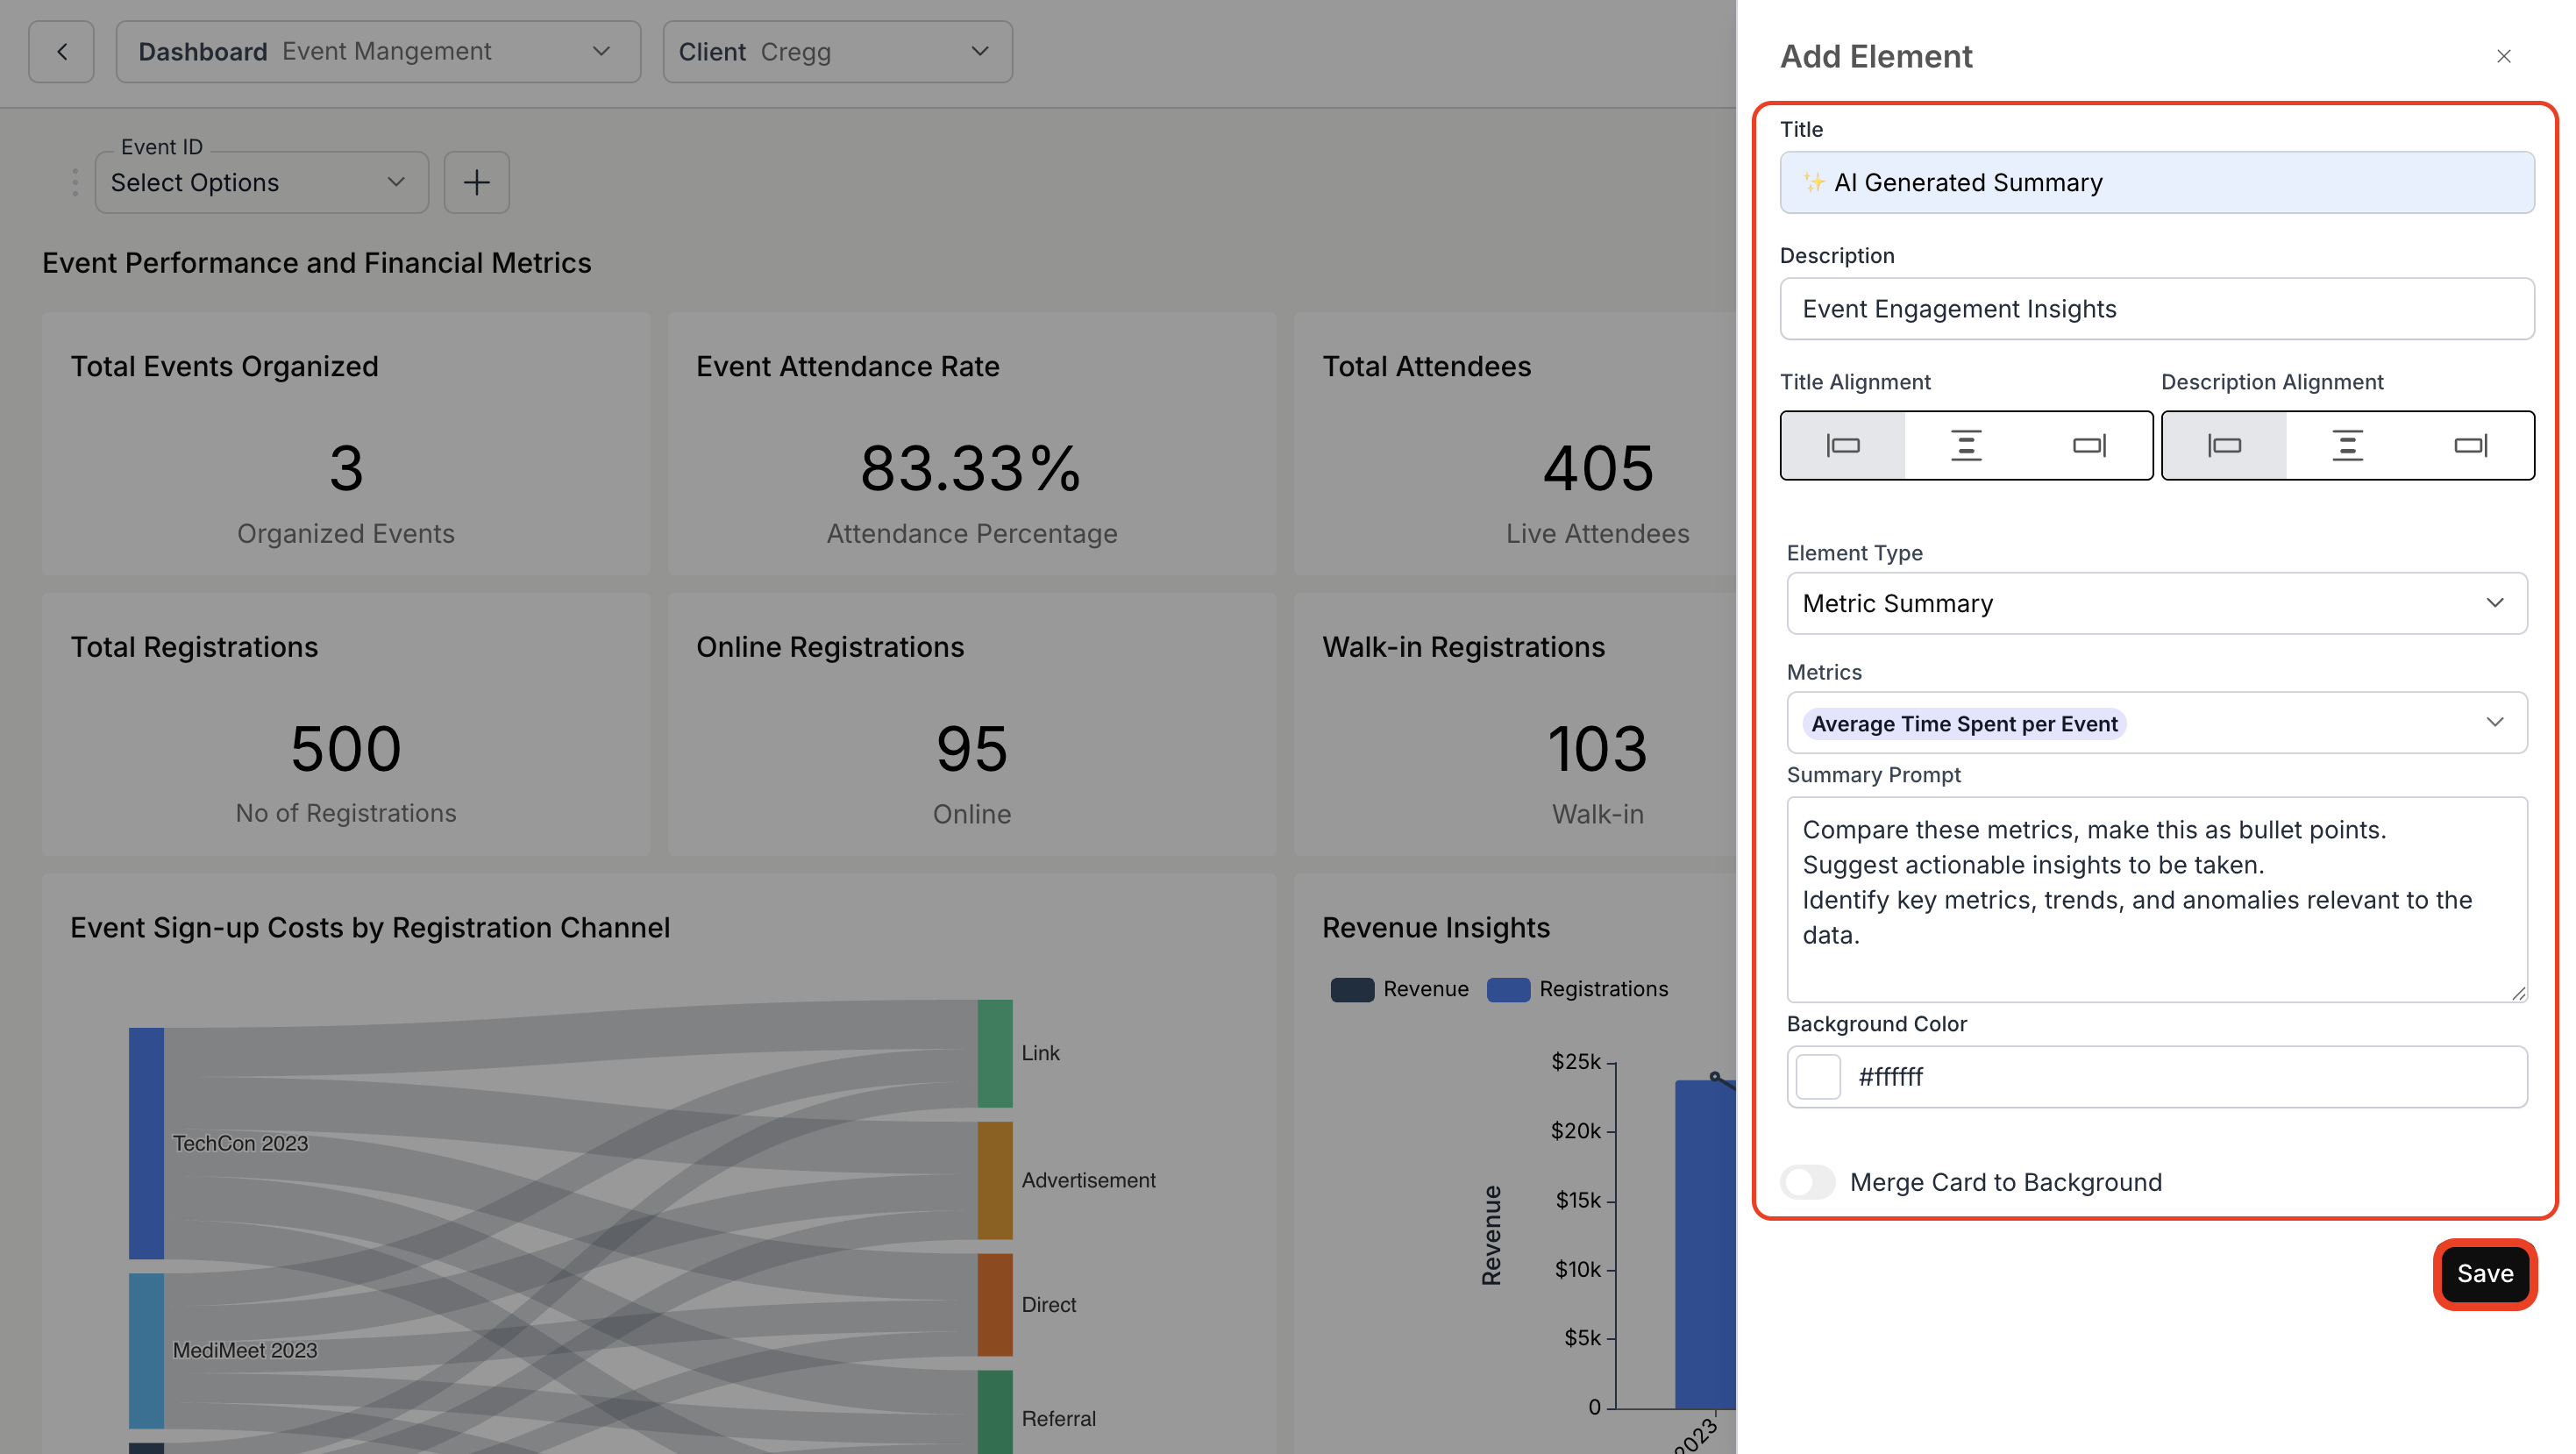
 ### 2. Add an Element
* Enter a title and description for your summary.
* Adjust the alignment of the title and description as needed.
* Select the relevant metrics from the dropdown to generate a combined summary, and input your question in the Summary Prompt.
* Configure the font styles for the summary: font family, font size, and font weight.
* Click **Save** to add the metric summary to your dashboard.
### 2. Add an Element
* Enter a title and description for your summary.
* Adjust the alignment of the title and description as needed.
* Select the relevant metrics from the dropdown to generate a combined summary, and input your question in the Summary Prompt.
* Configure the font styles for the summary: font family, font size, and font weight.
* Click **Save** to add the metric summary to your dashboard.
 ### 3. View Metric Summary
Your new metric summary will now be visible on the dashboard.
### 3. View Metric Summary
Your new metric summary will now be visible on the dashboard.
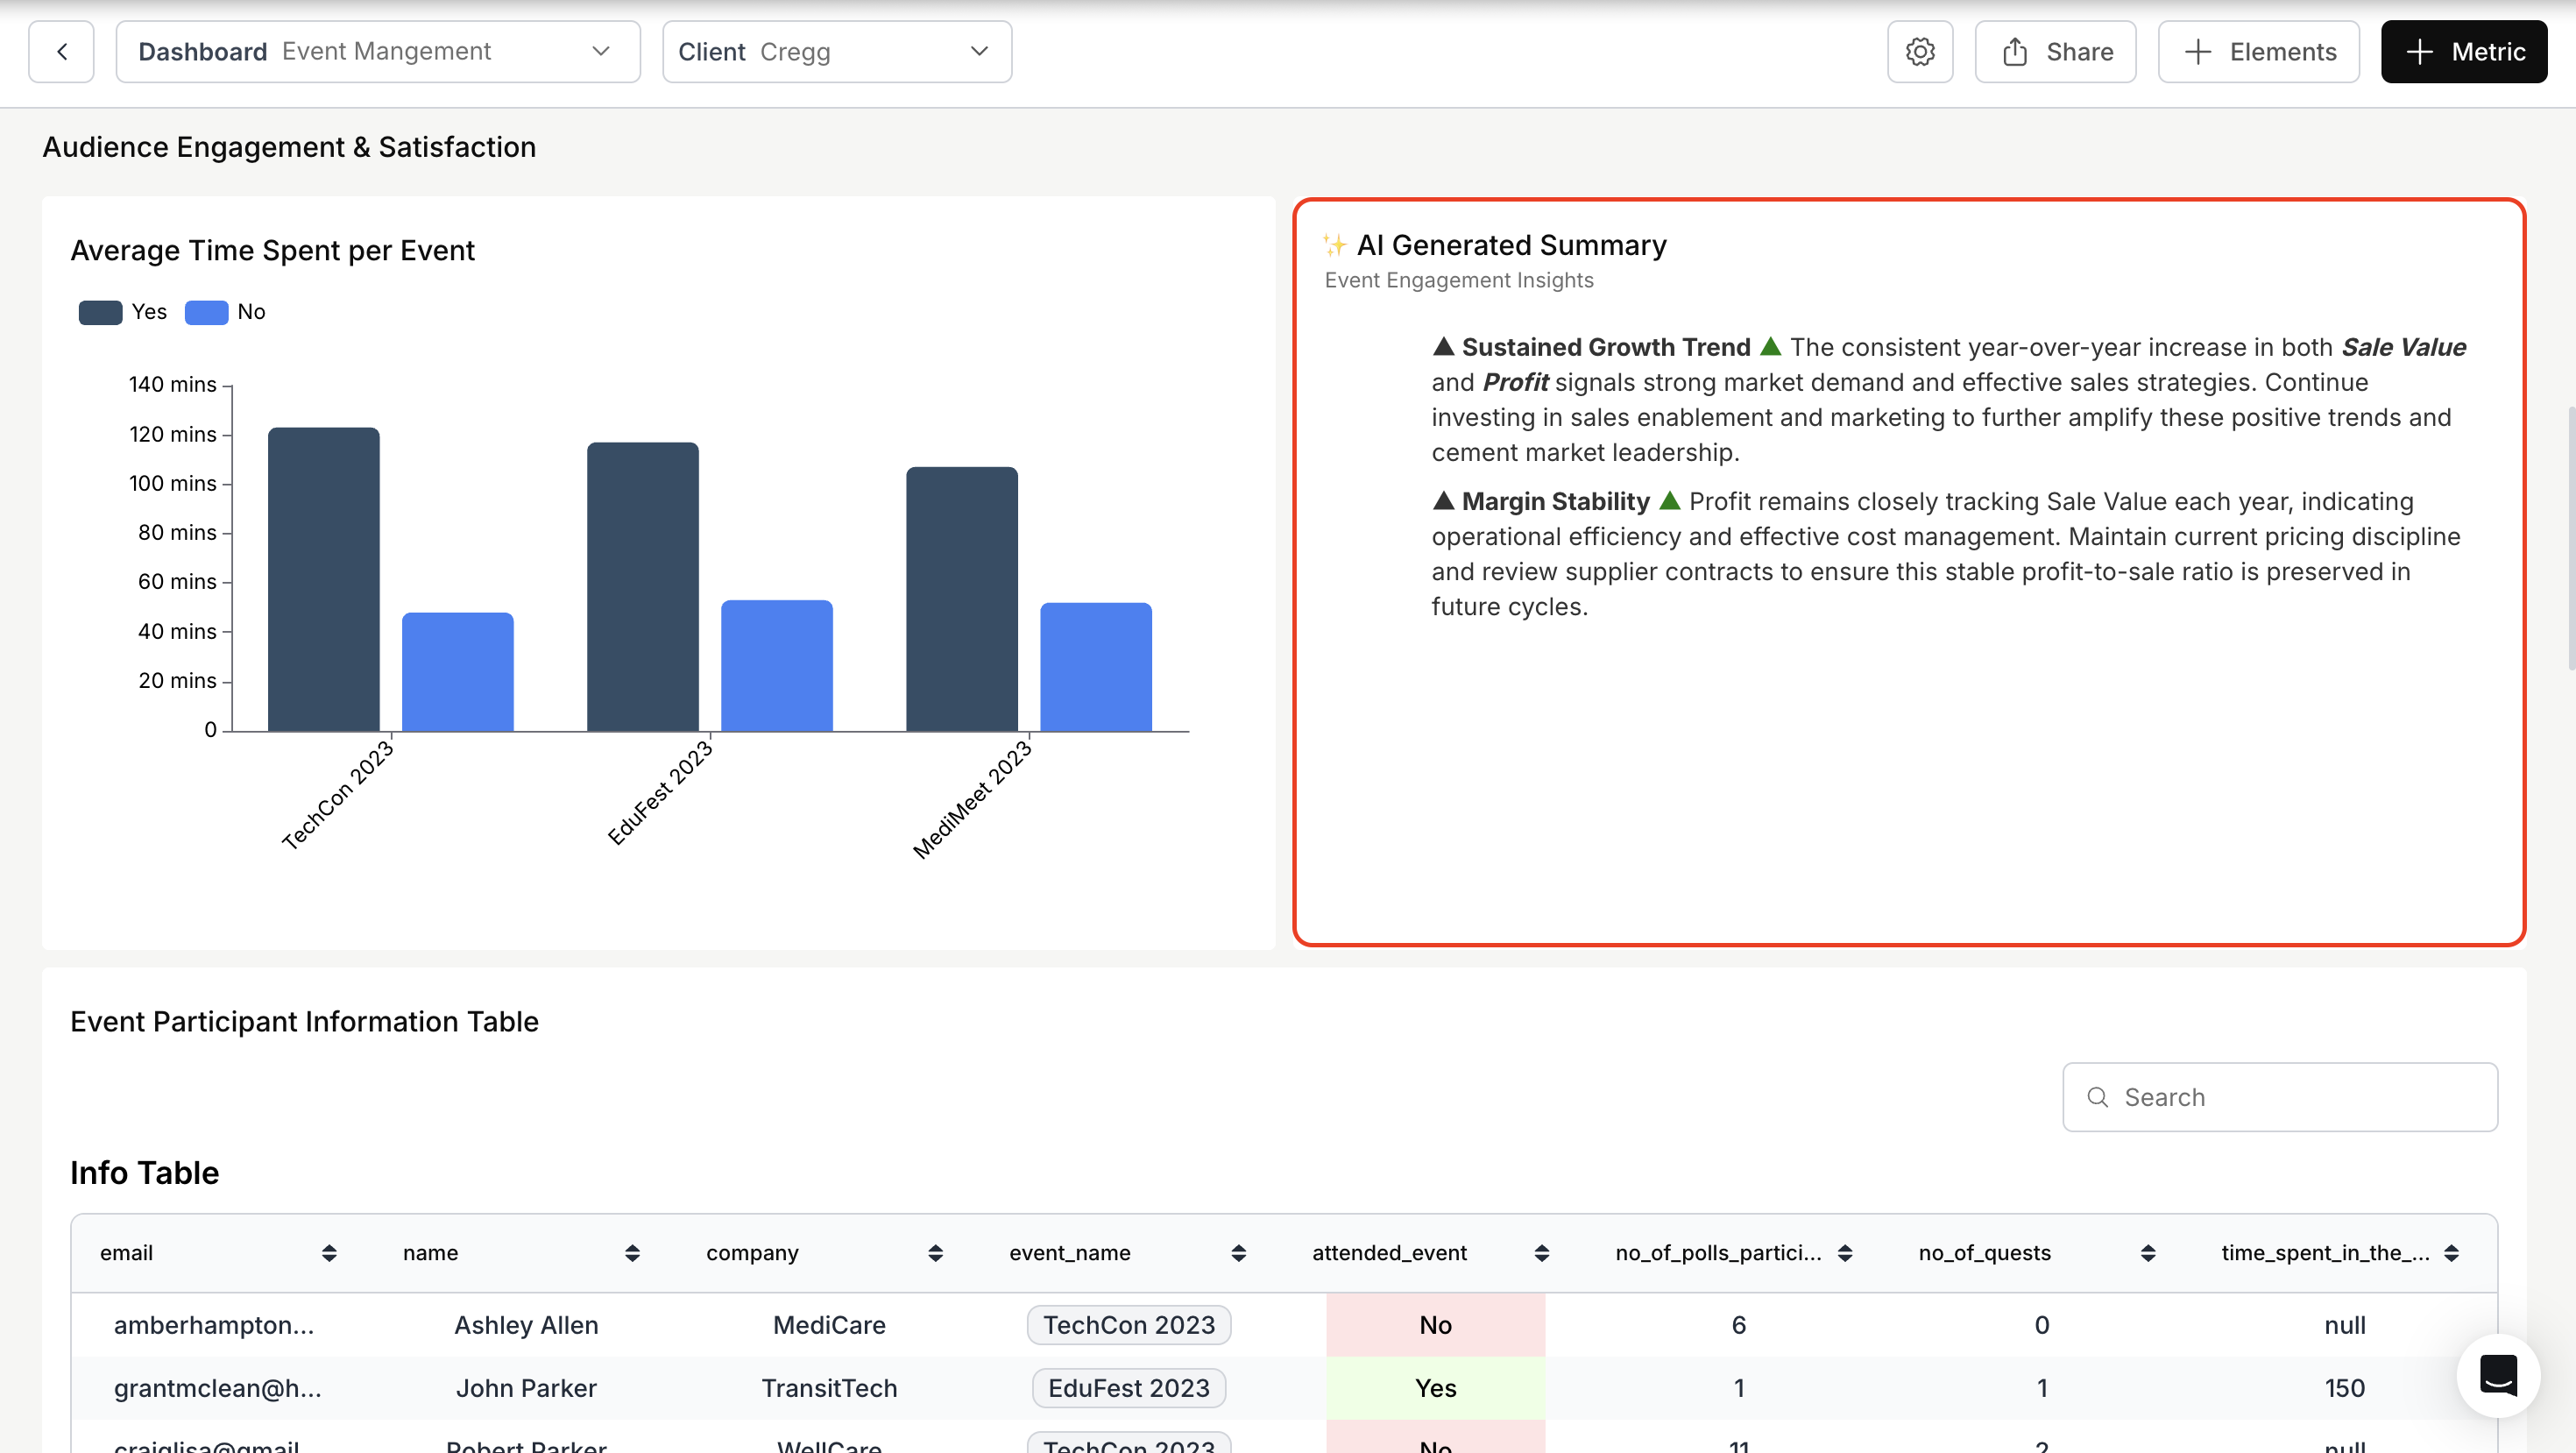 You’ve successfully created and added a Metric Summary to your dashboard!\
Your insights are now visible at a glance, enhancing clarity and decision-making across your workspace.
You’ve successfully created and added a Metric Summary to your dashboard!\
Your insights are now visible at a glance, enhancing clarity and decision-making across your workspace.