> ## Documentation Index
> Fetch the complete documentation index at: https://docs.usedatabrain.com/llms.txt
> Use this file to discover all available pages before exploring further.
# Switch X axis and Switch Y axis
> This guide provides a straightforward method to easily switch the X and Y axes in your data visualization, enhancing your ability to analyse and interpret data from different perspectives.
### 1. **Switch X Axis:**
Click on the "+" icon on top of the metric and click on **"Switch X Axis"** button.
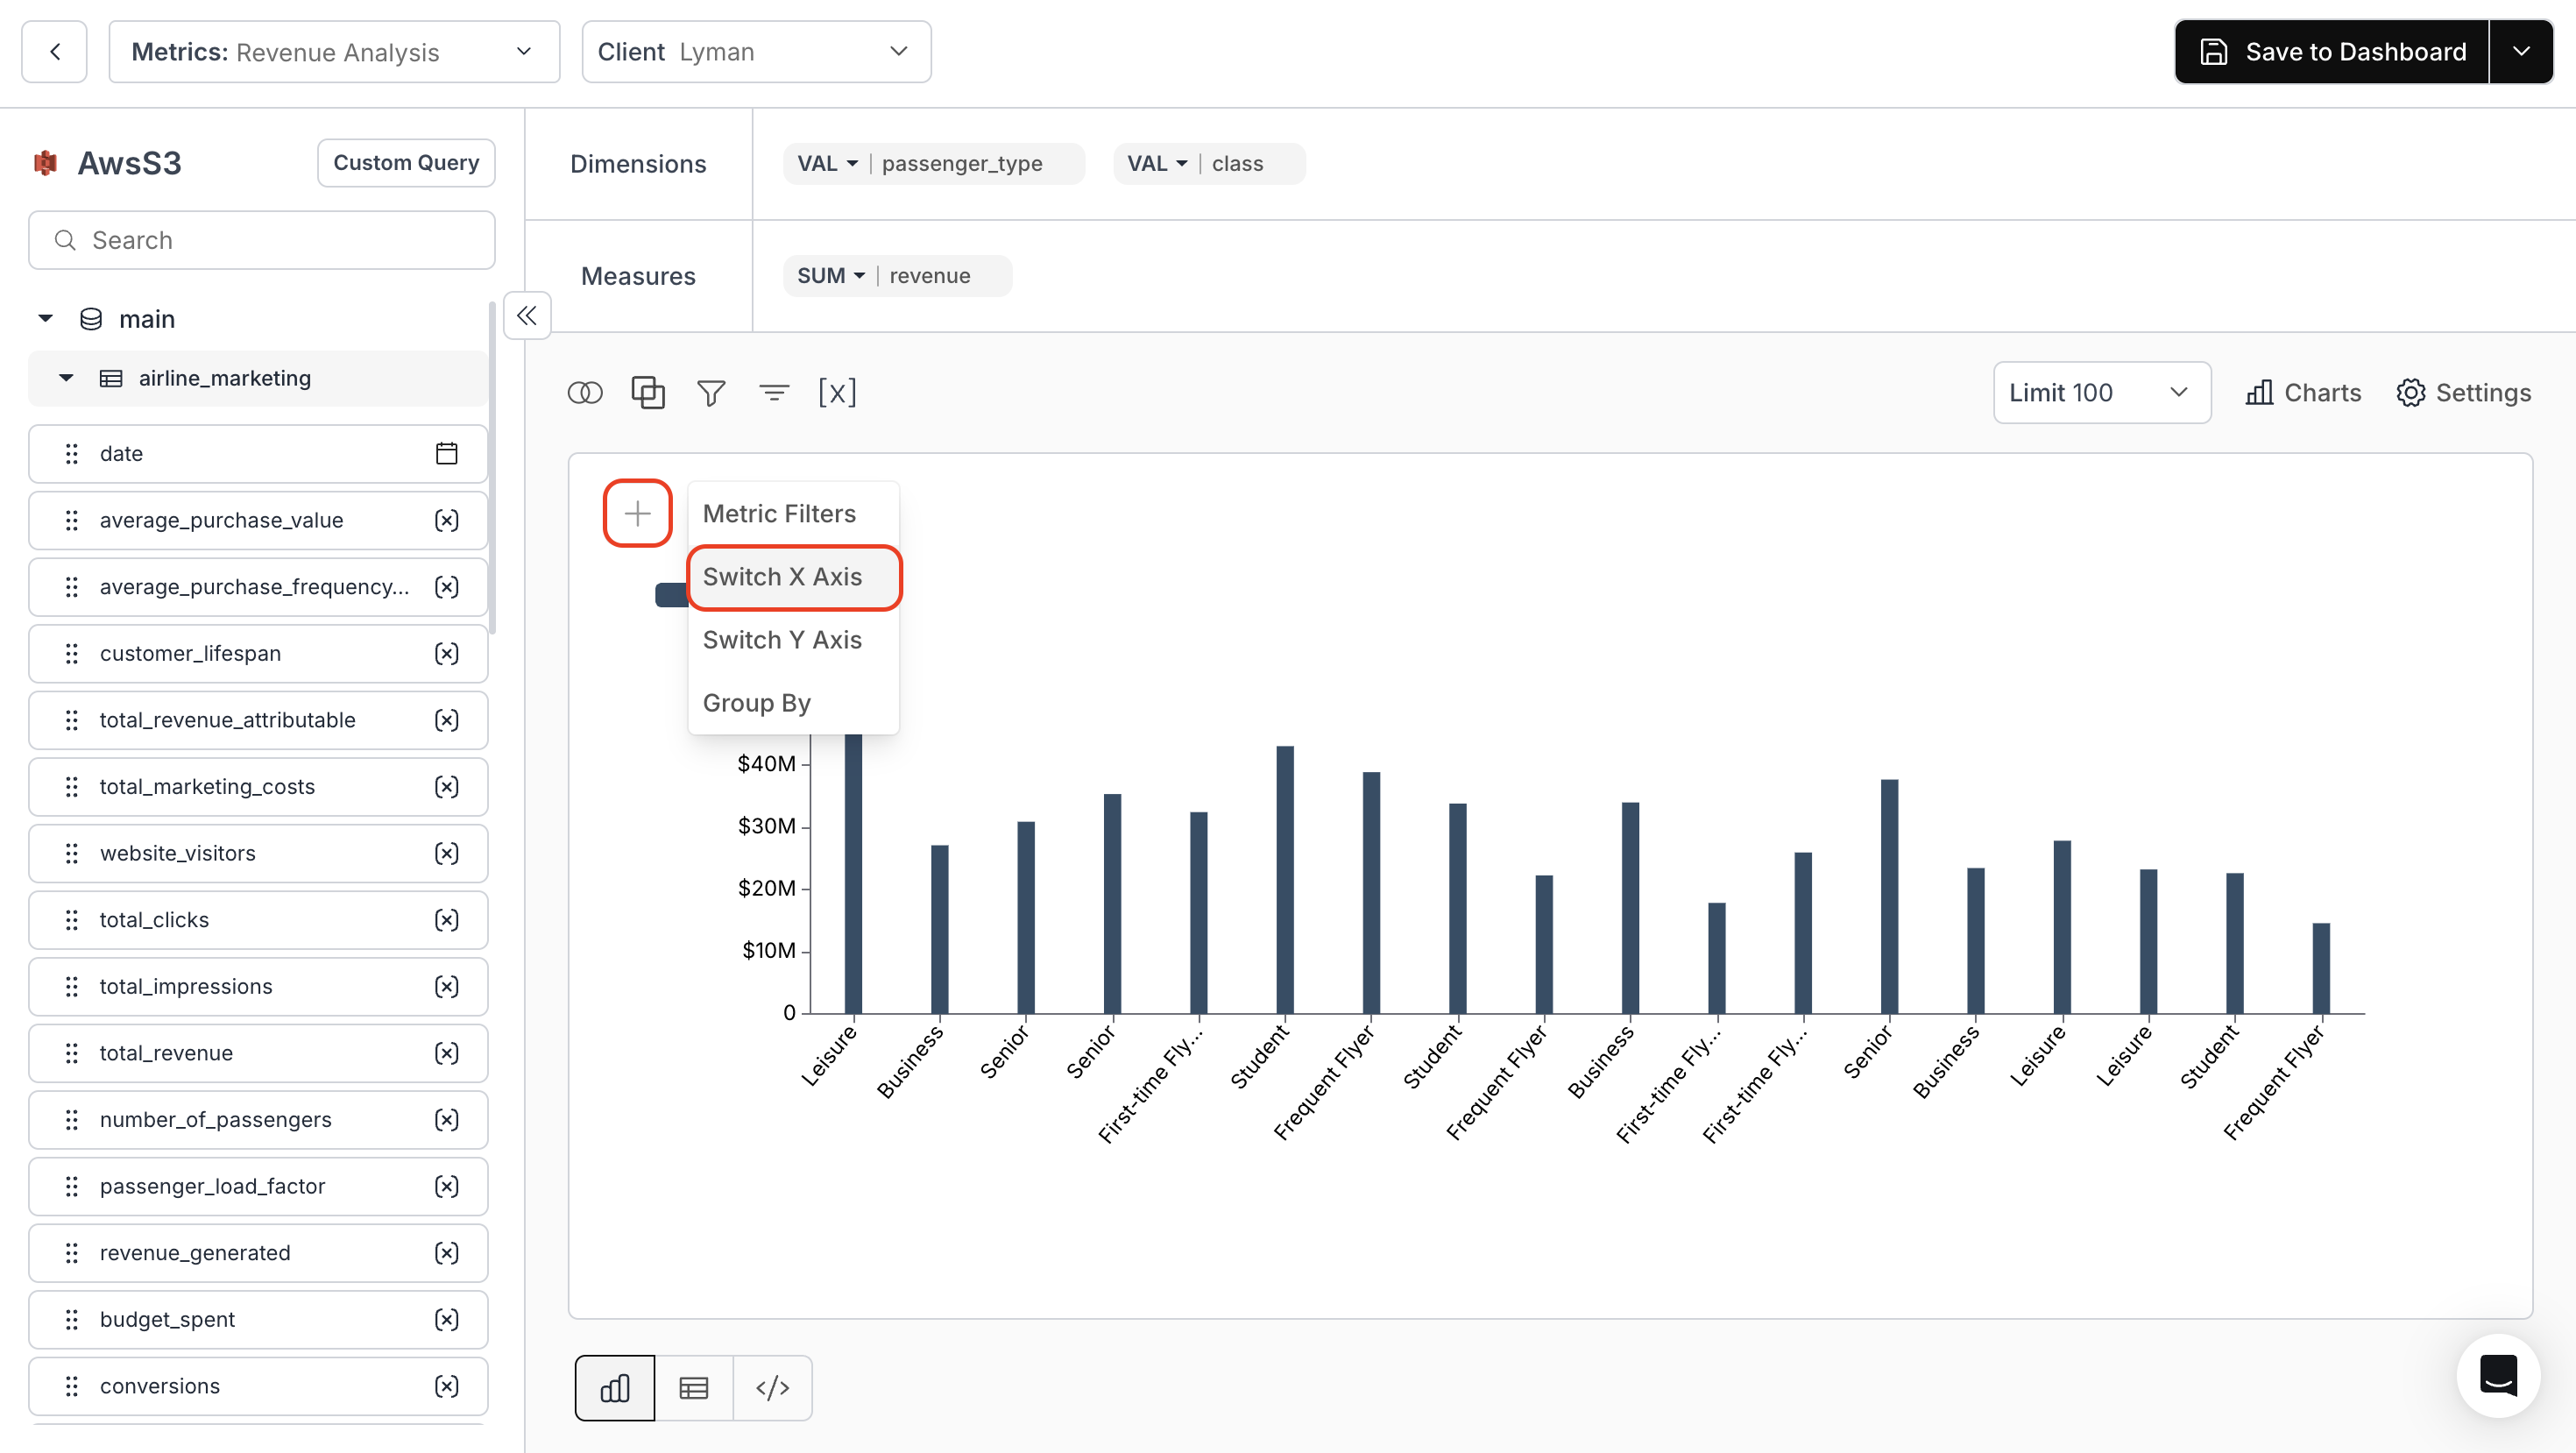 Select any column from the drop-down to notice a change in X Axis.
 ### 2. **Switch Y Axis:**
Click on the "+" icon on top of the metric and click on "Switch Y Axis" button.
### 2. **Switch Y Axis:**
Click on the "+" icon on top of the metric and click on "Switch Y Axis" button.
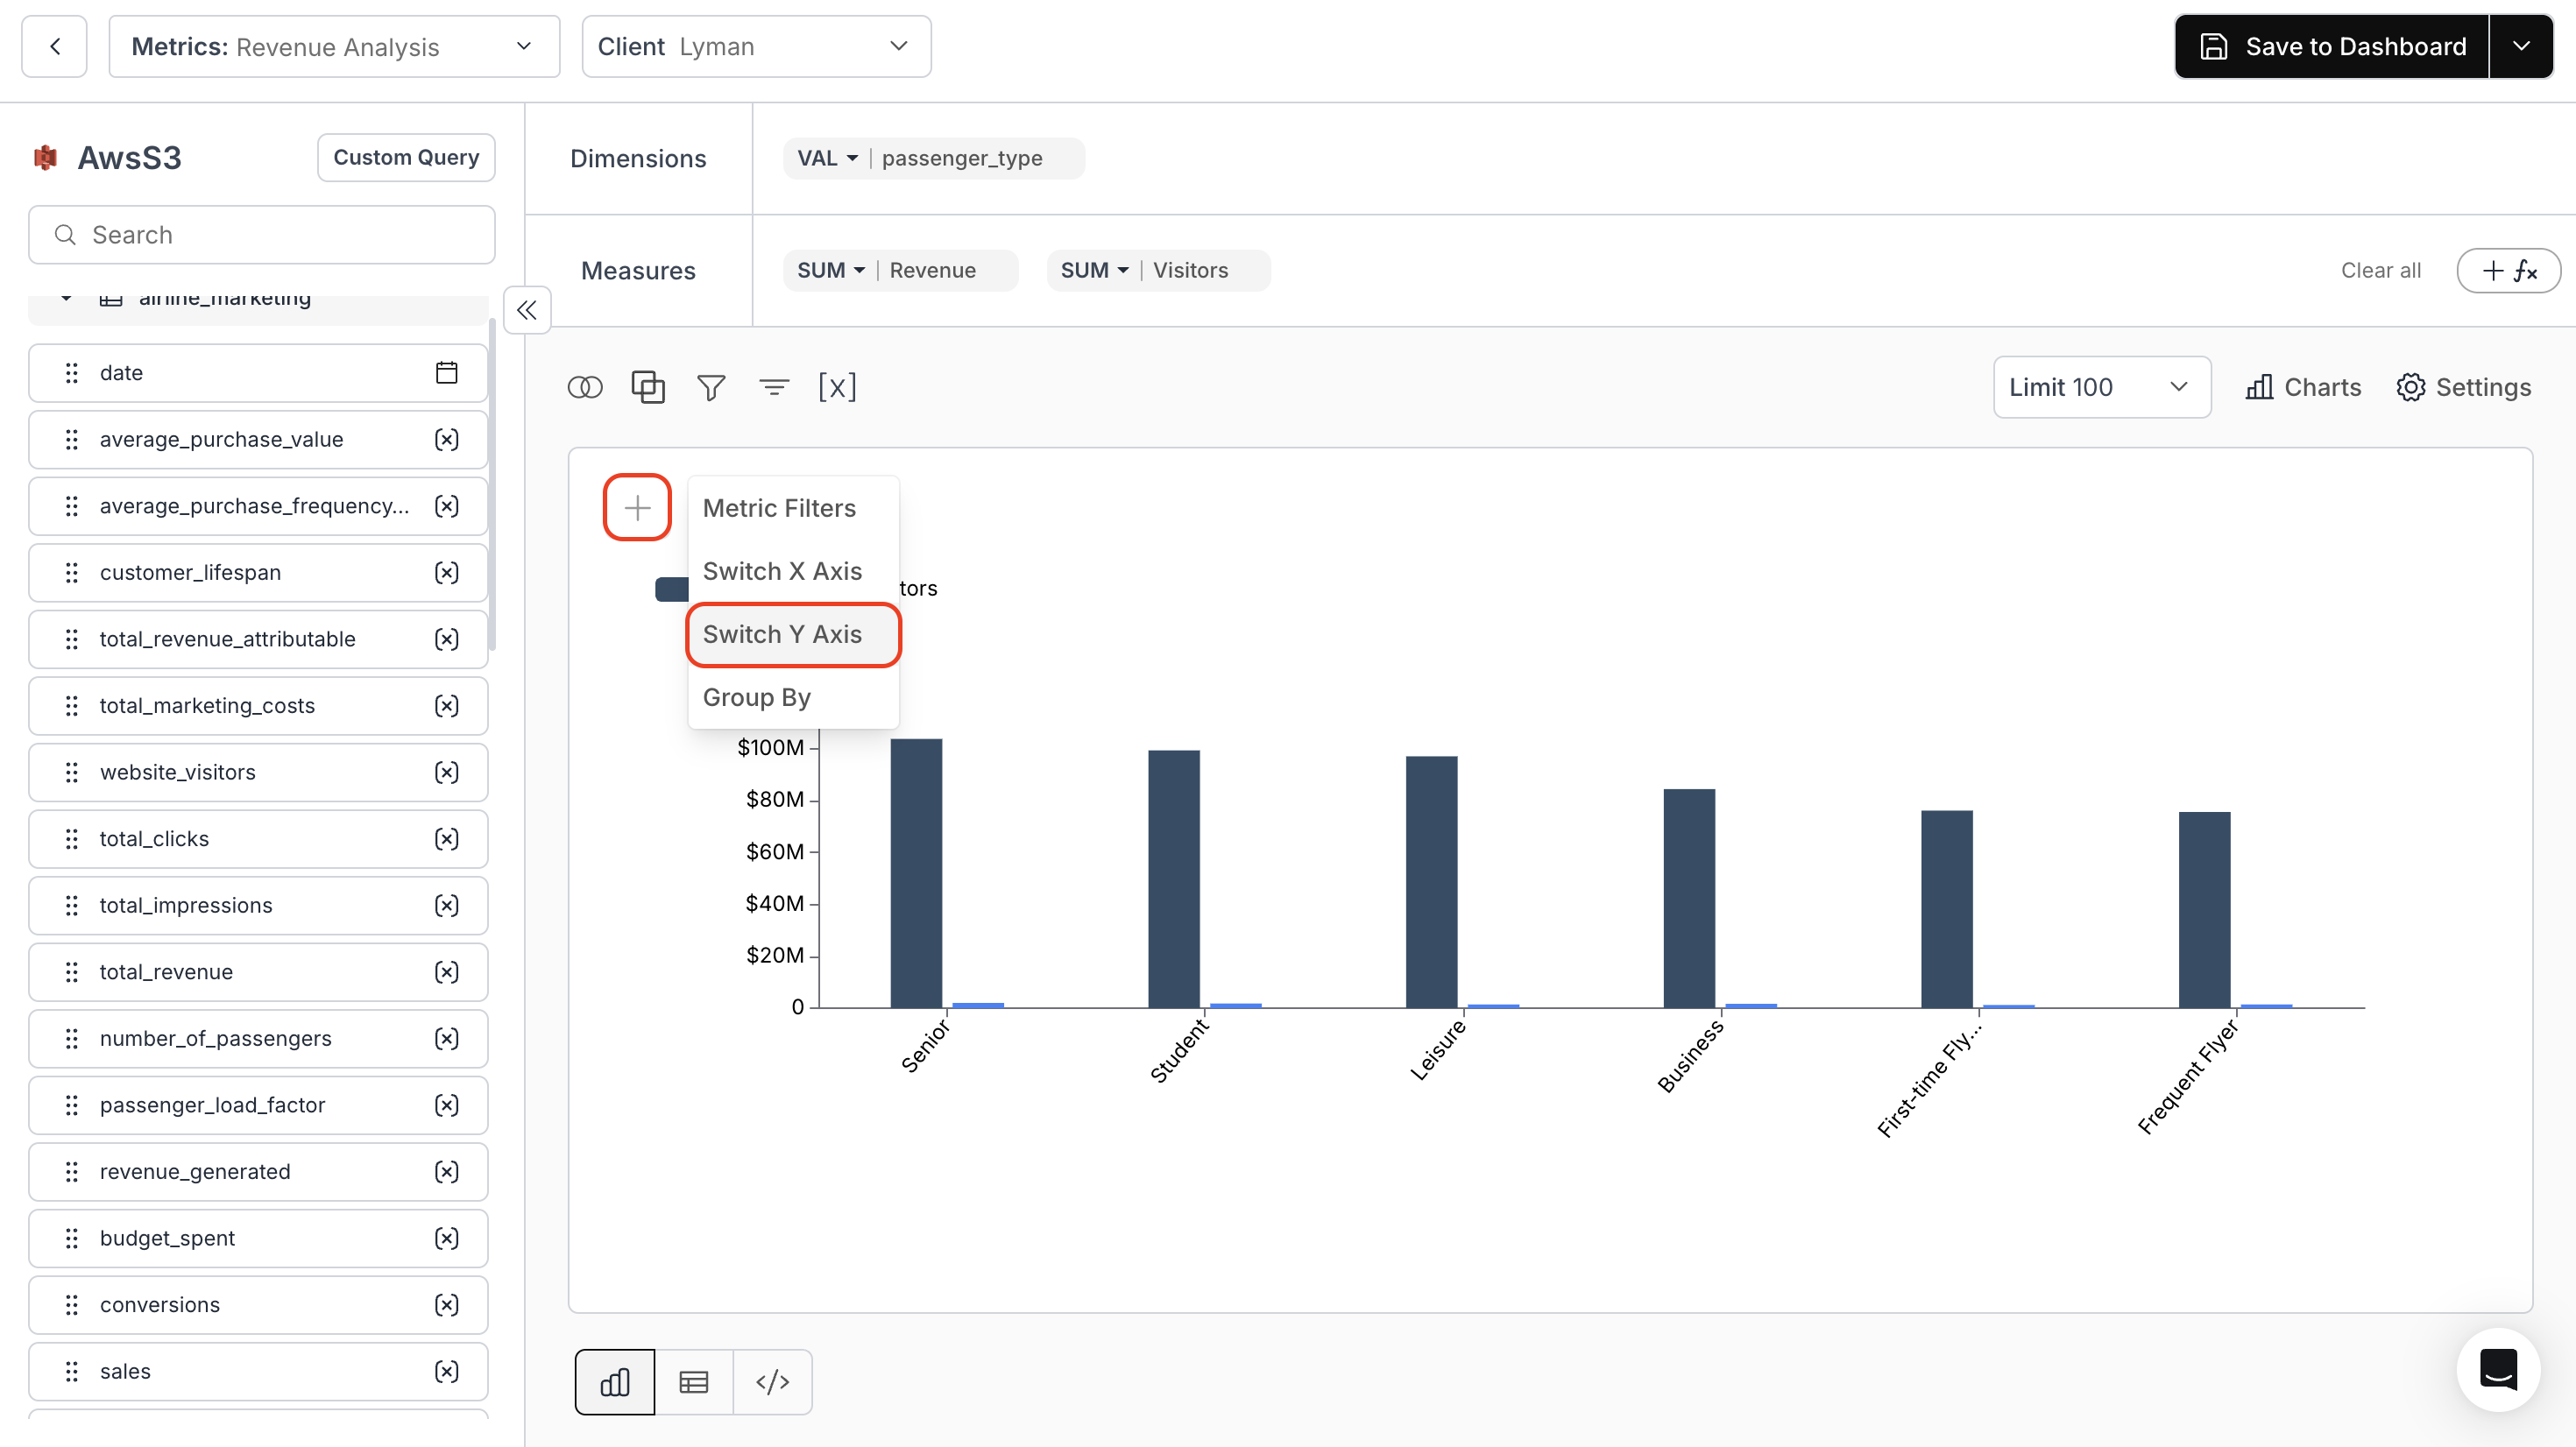 Select any column from the drop-down to notice a change in Y Axis.
 You’ve successfully switched the X and Y axes in your metric!\
Your visualizations will now adapt dynamically, allowing deeper analysis from multiple perspectives.
You’ve successfully switched the X and Y axes in your metric!\
Your visualizations will now adapt dynamically, allowing deeper analysis from multiple perspectives.