> ## Documentation Index
> Fetch the complete documentation index at: https://docs.usedatabrain.com/llms.txt
> Use this file to discover all available pages before exploring further.
# Create a Metric
> Metrics offer detailed insights and visualization of your data within a dashboard. This guide provides a step-by-step process to create a Metric in Databrain.
> **What is a Metric in Databrain?**\
> A metric is a configurable analytical component that enables you to visualize and analyze your data through various chart types. It serves as a building block for dashboards, allowing you to create comprehensive data visualizations by combining multiple metrics.
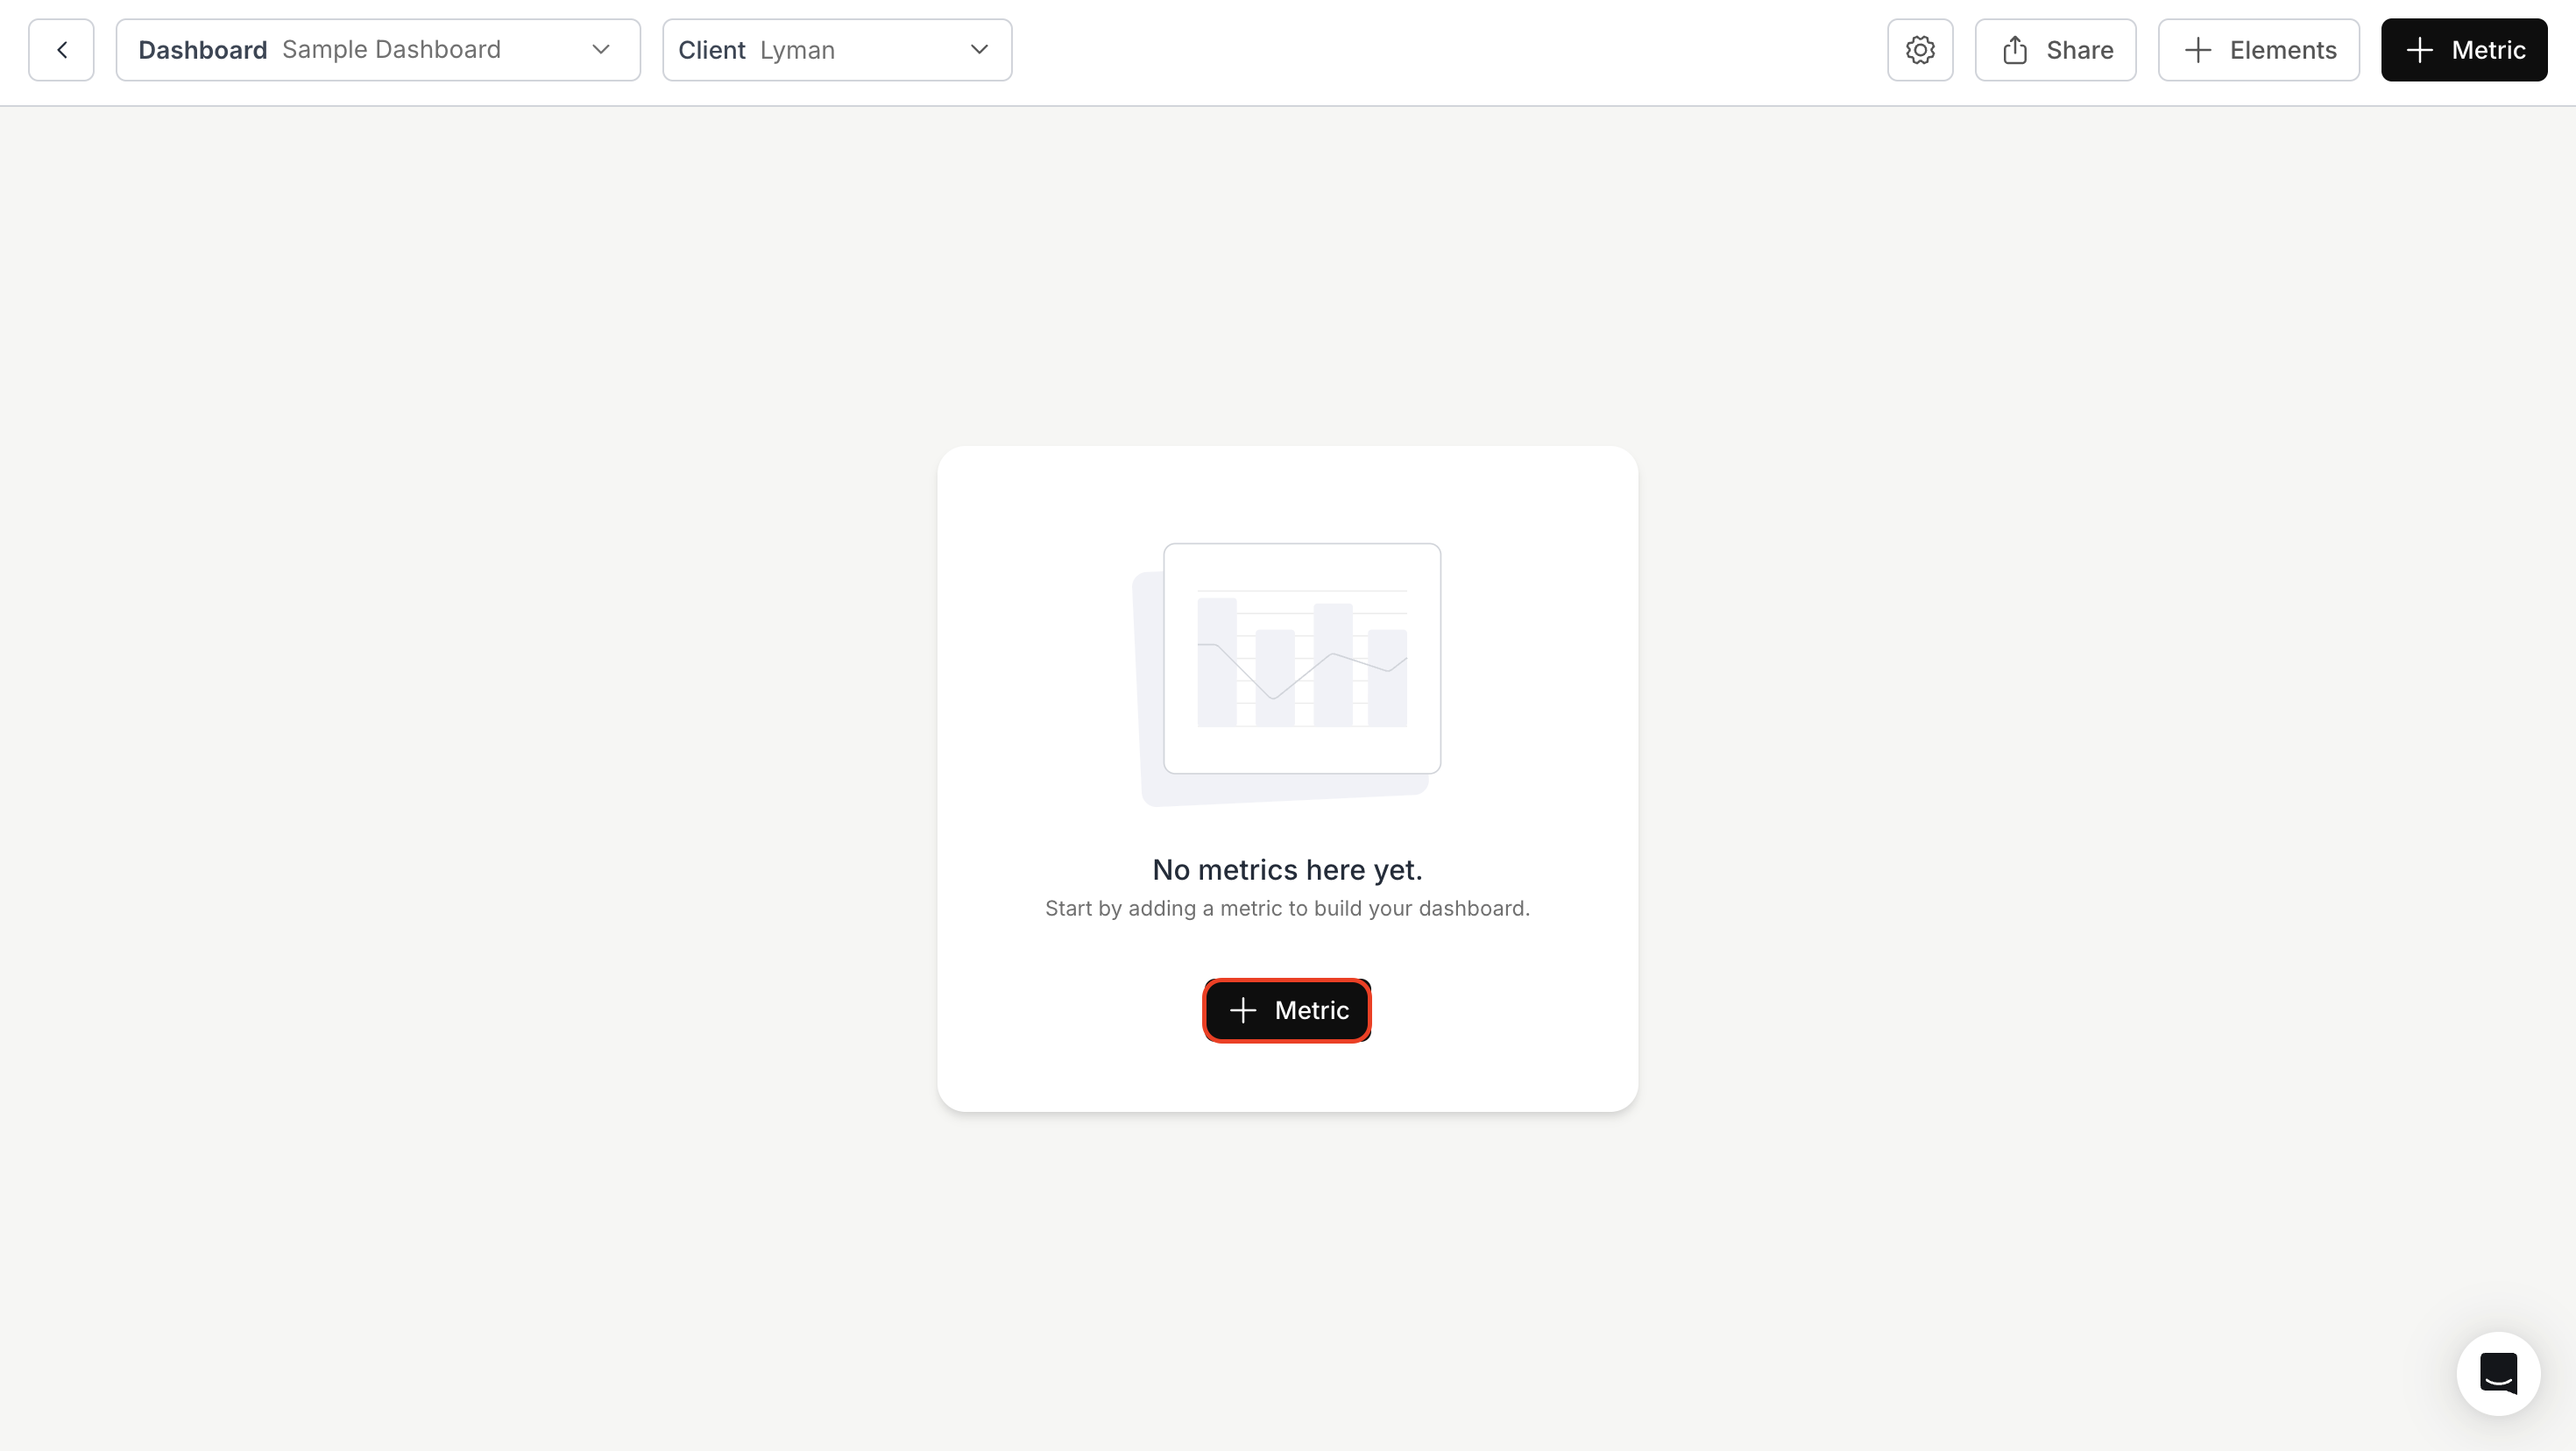
* Select the dashboard where you intend to add the metric.
* For the first metric, click the "+ Metric" button.
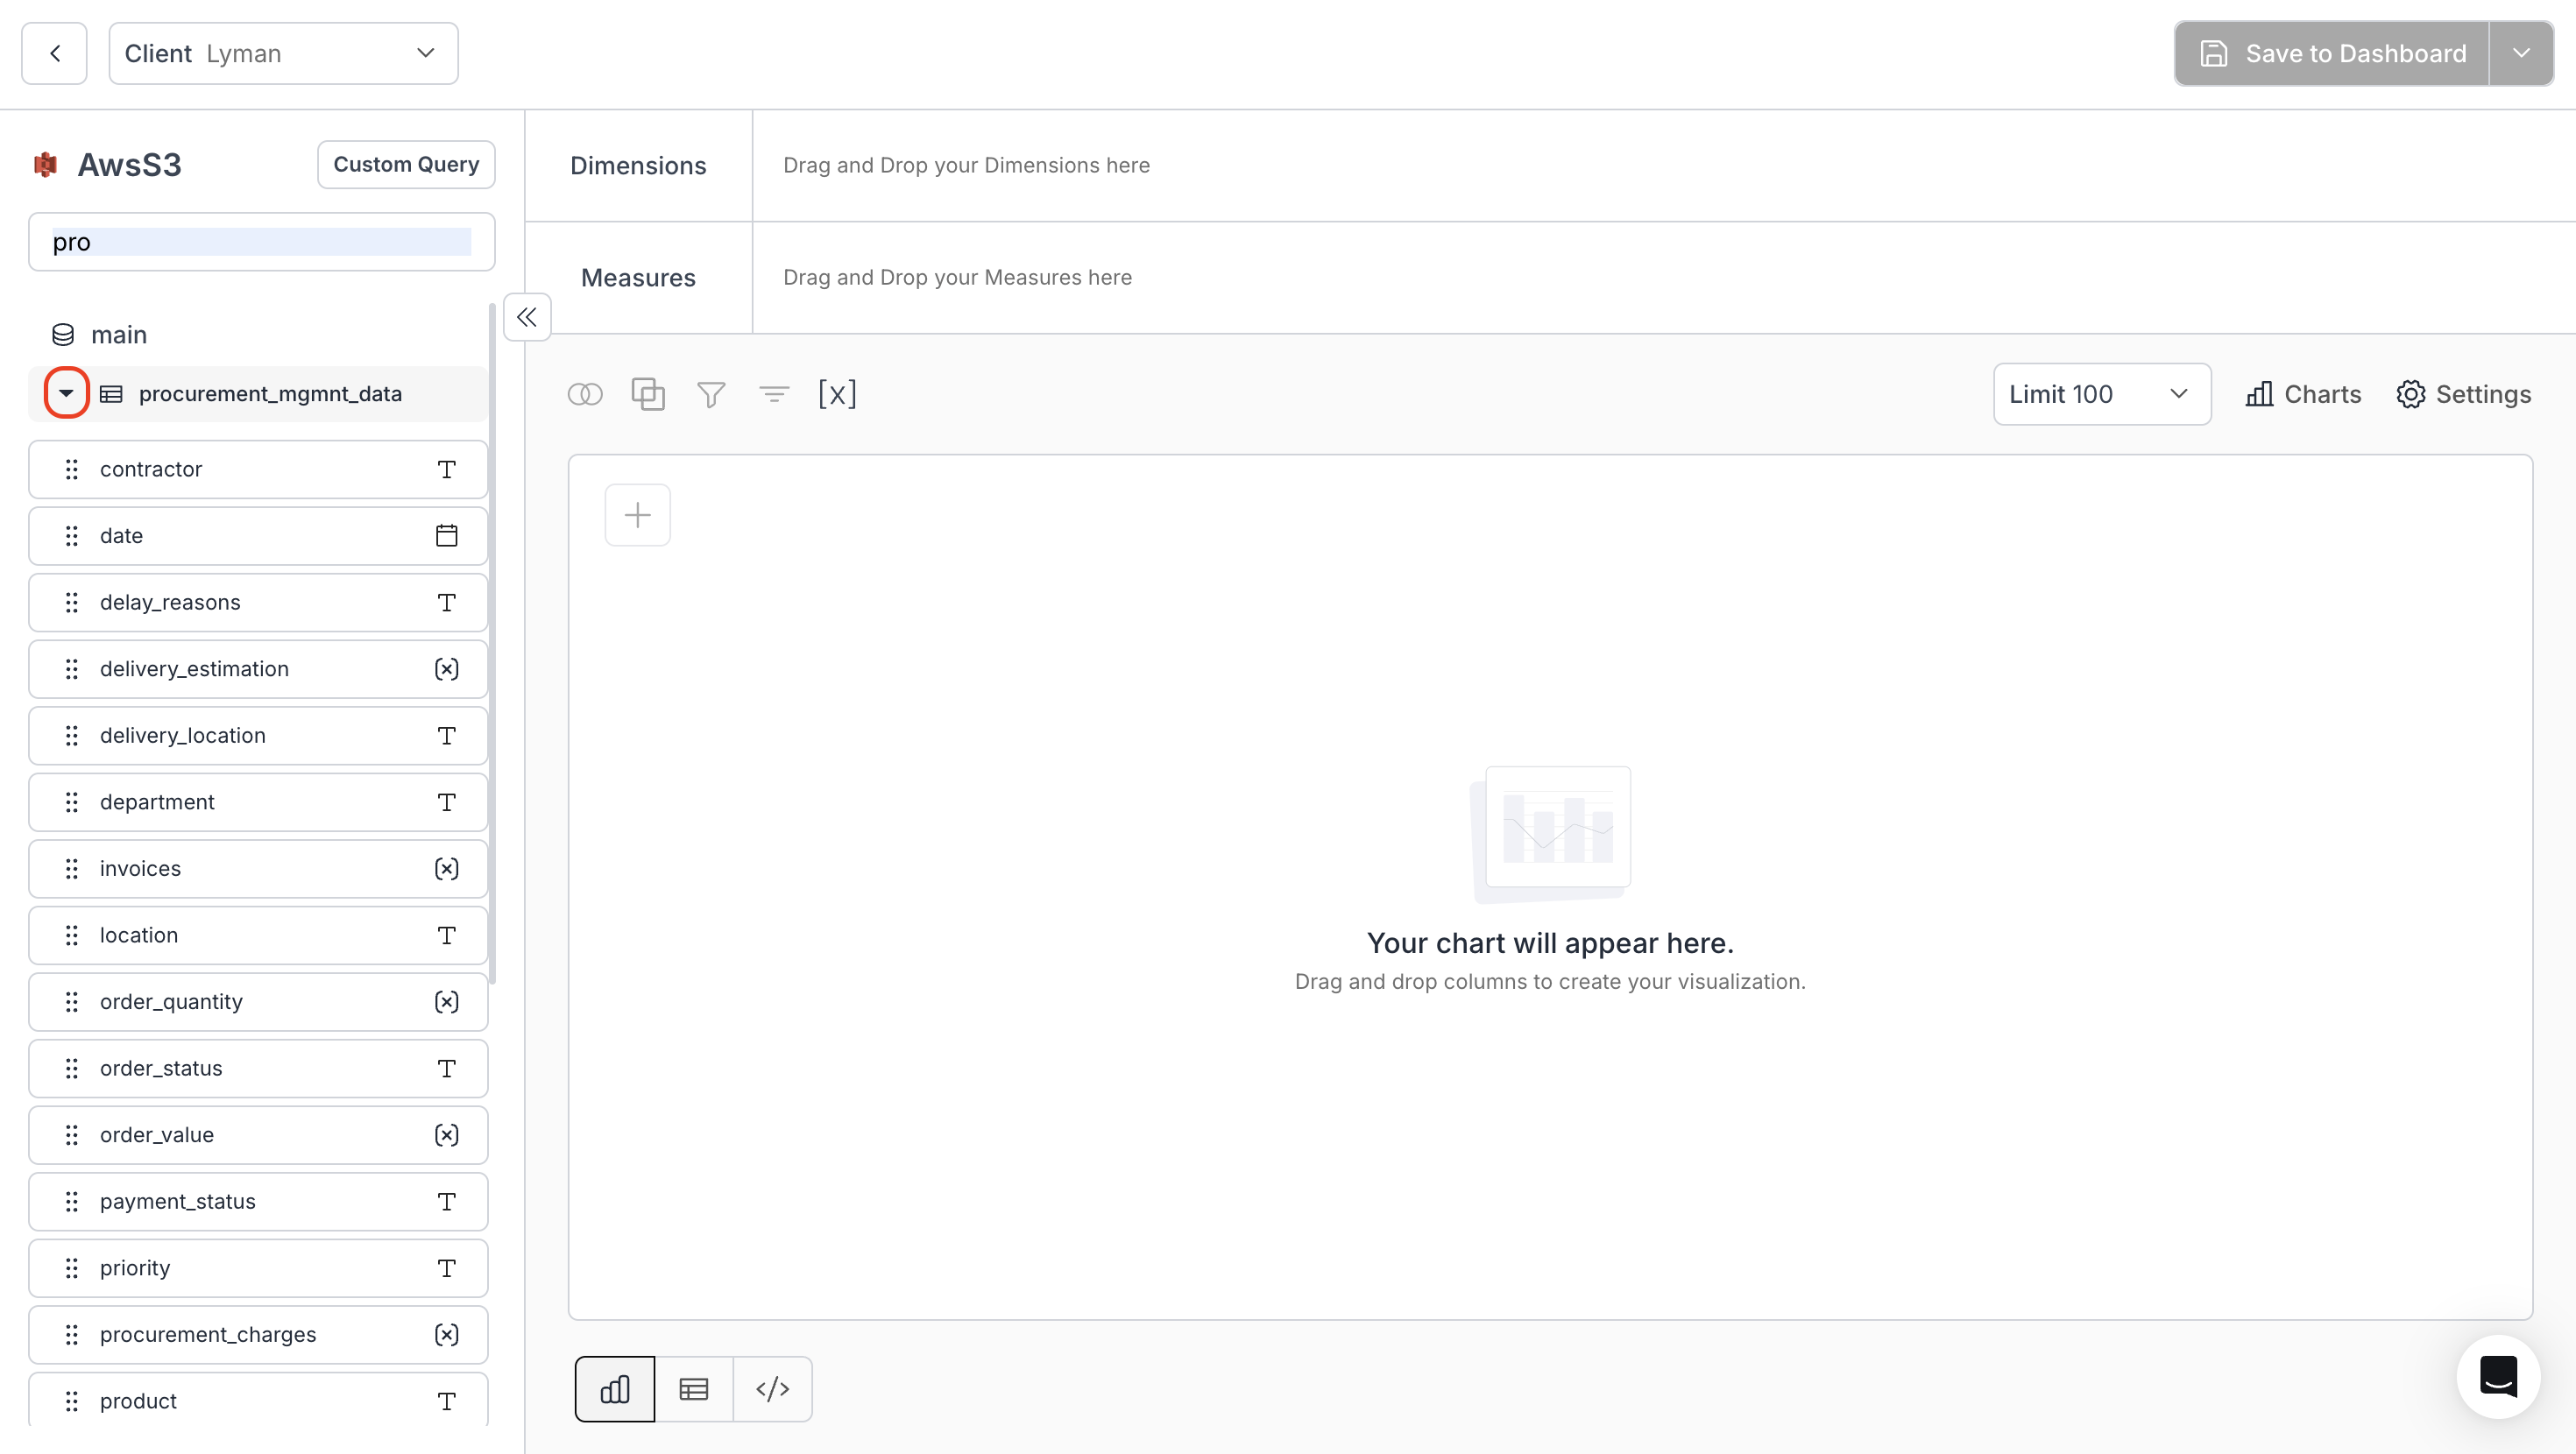
* Inside the metric creation page, select the desired table from your database schema.
* Drag and Drop columns into Dimensions and Measures as required.
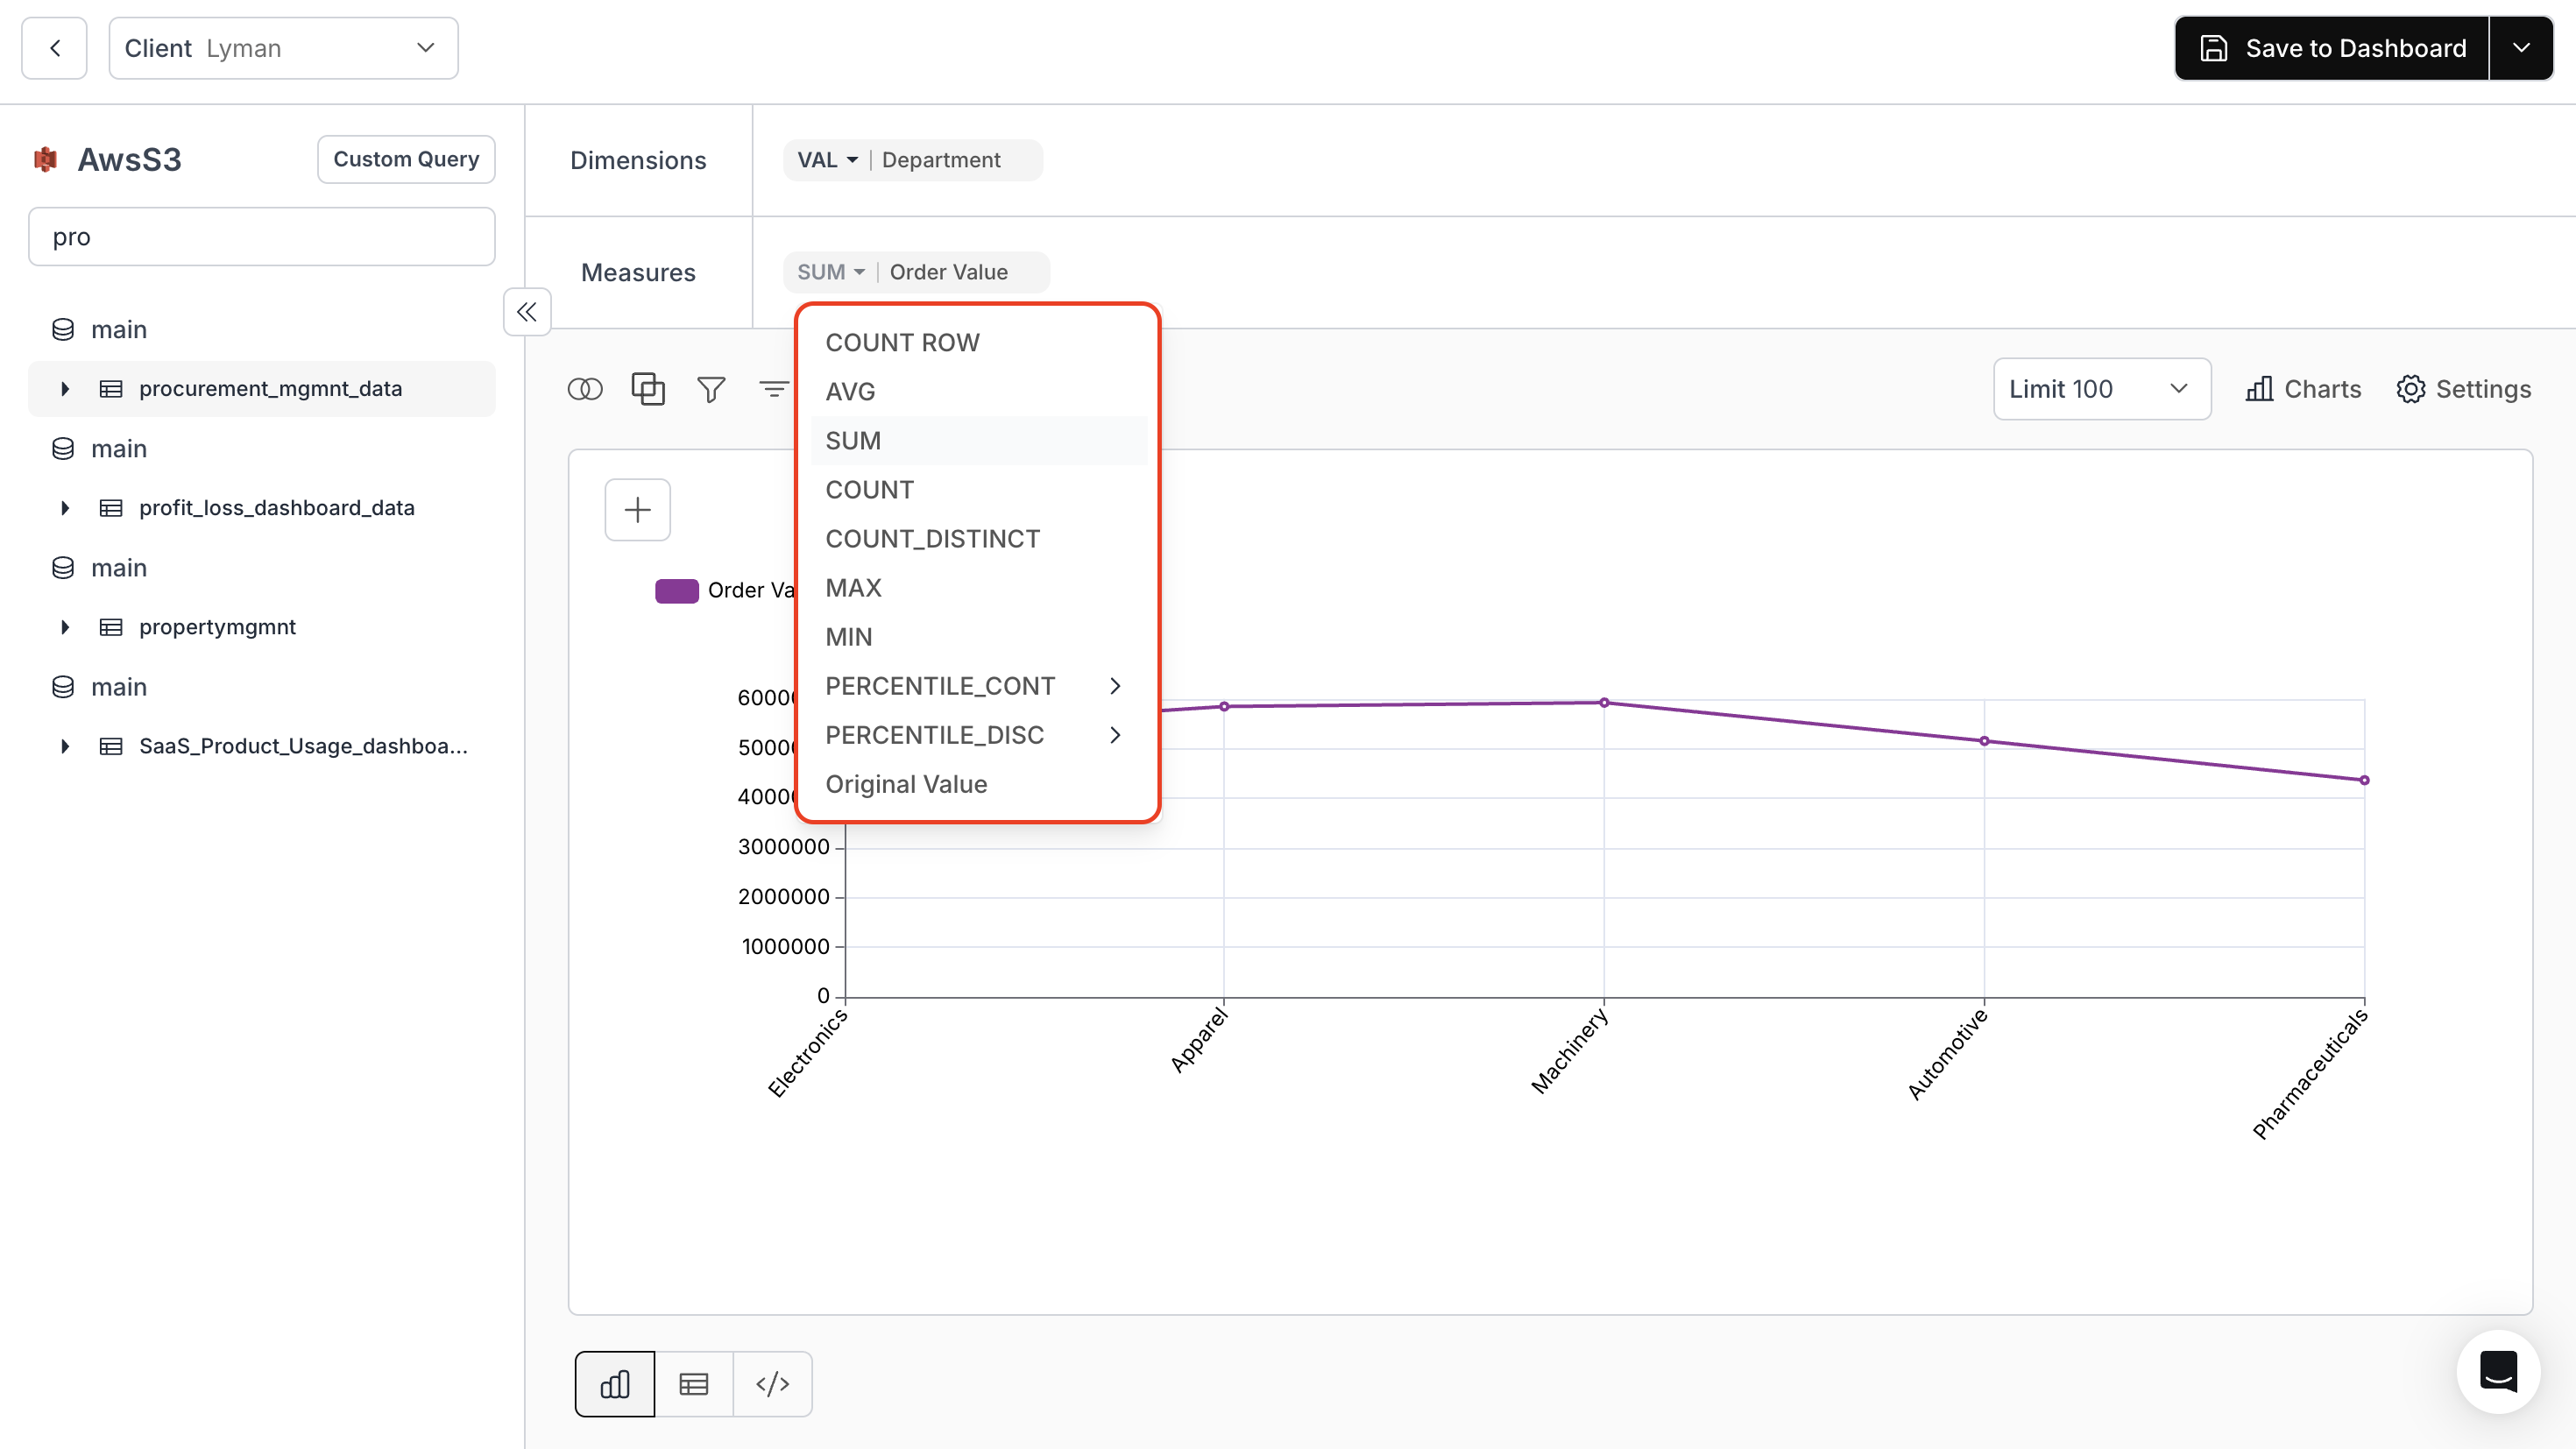
* Choose an aggregation method for the Measure: `COUNT ROW`, `AVG`, `SUM`, `COUNT`, `COUNT DISTINCT`, `MAX`, `MIN`, or `Original Value`.
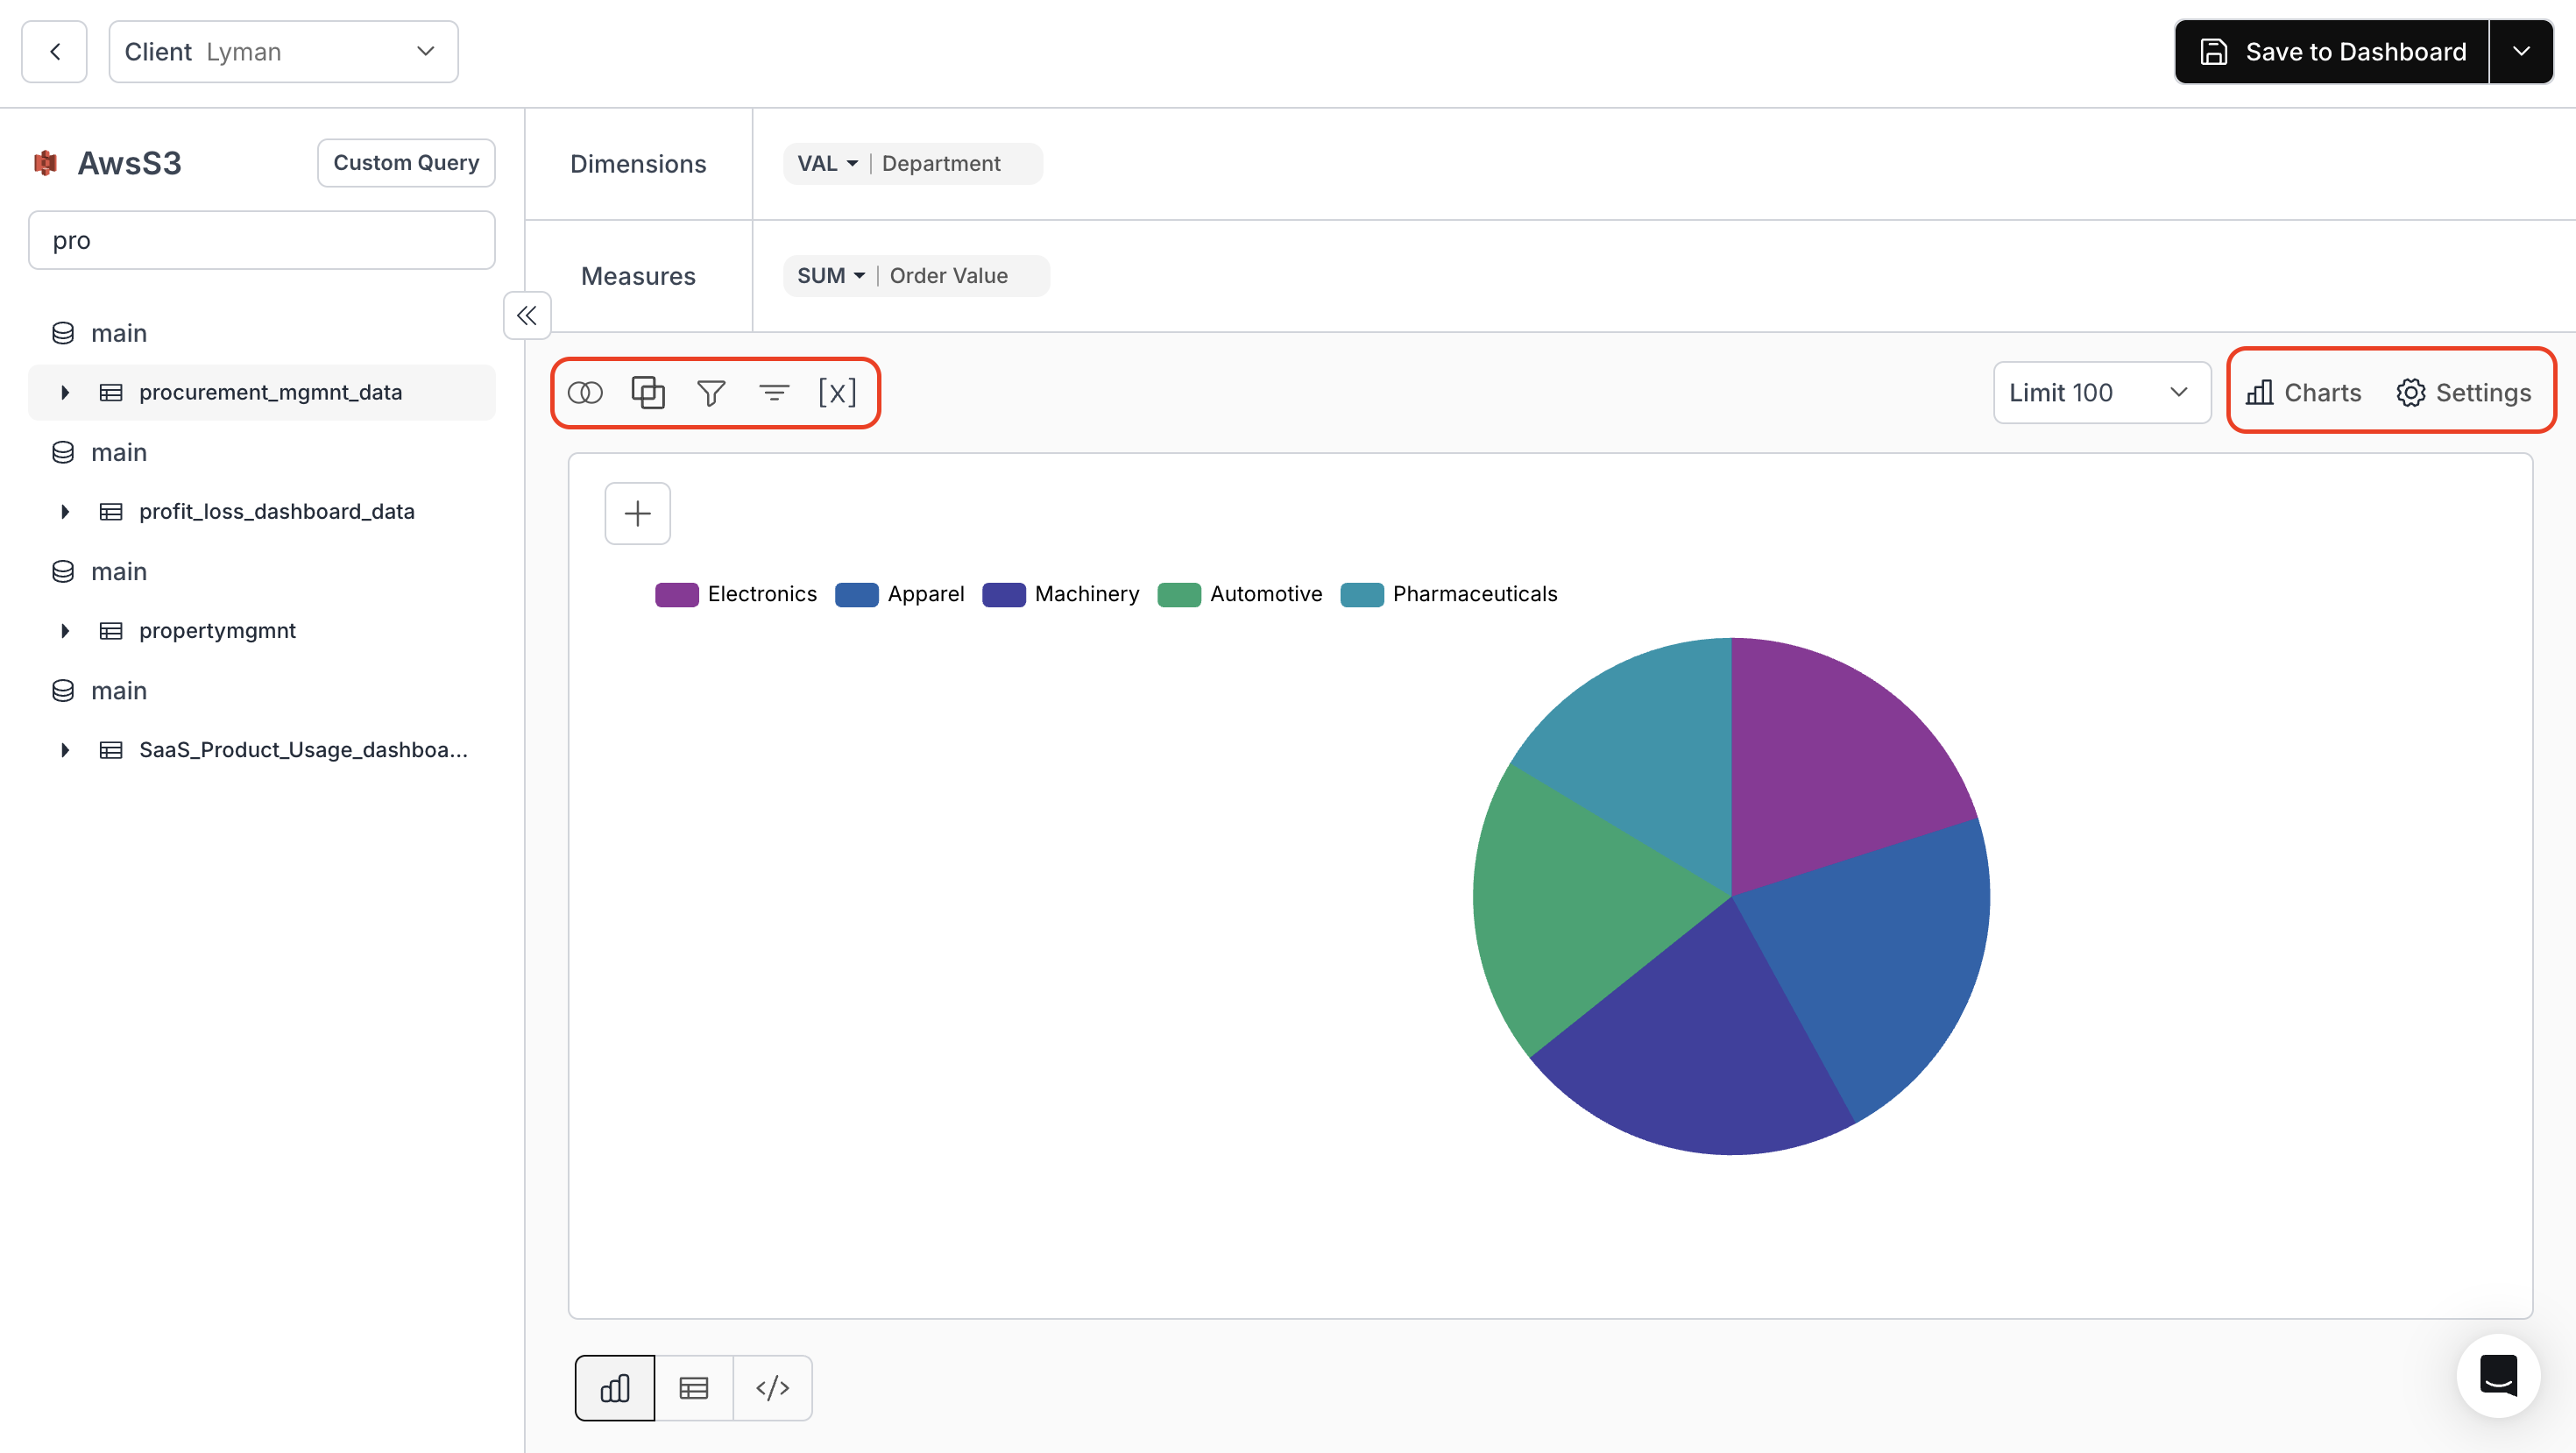
* Choose a visualization from the Charts icon.
* Use Joins, Group by, Filters, Sort, and Dynamic Property from the toolbar to enhance your metric.
* Adjust chart settings via the Settings icon.
* For chart-specific setup instructions, see [Chart Setup guides](/guides/visualizations-actions-and-appearance/chart-setup/overview).
For a detailed guide on Dynamic Property, refer to the section below:\
Dynamic Property
* After creating your metric, you can save it to a dashboard or as a draft.
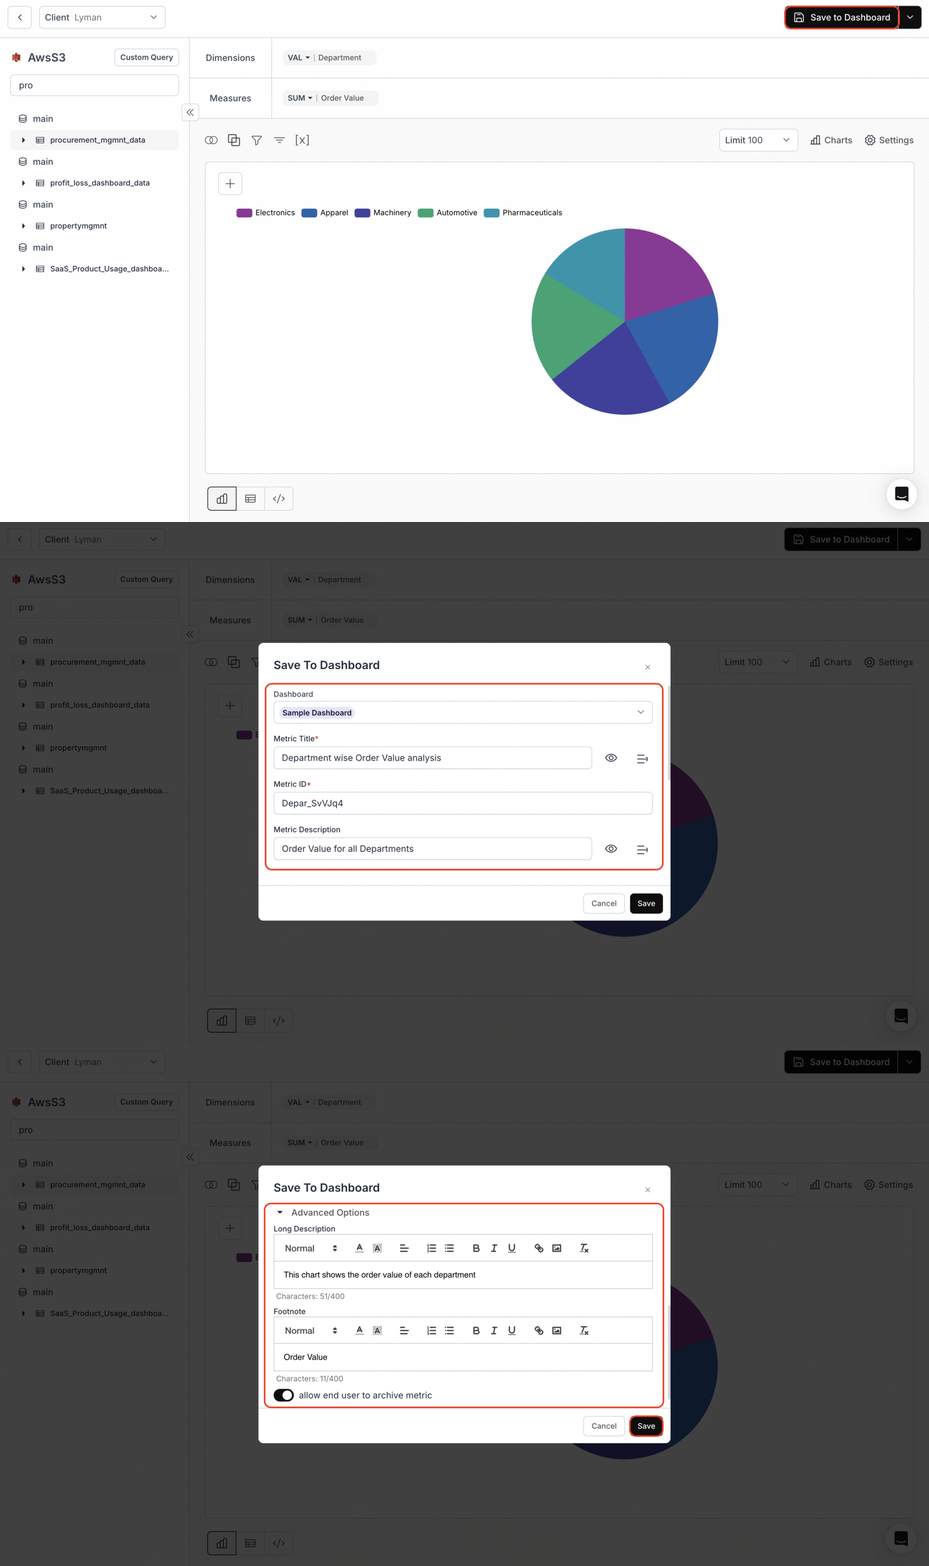
* Once satisfied with the chart, click "Save to Dashboard" on the top right.
* Choose the dashboard where the metric should be stored.
* Provide a Metric Name, Metric ID, and a brief Description.
* If needed, add a long description or footnote and toggle the option for end users to archive metrics.
* Finally, click "Save" to publish the metric to your dashboard.
For more details on long descriptions and footnotes:\
Footnote and Long Description
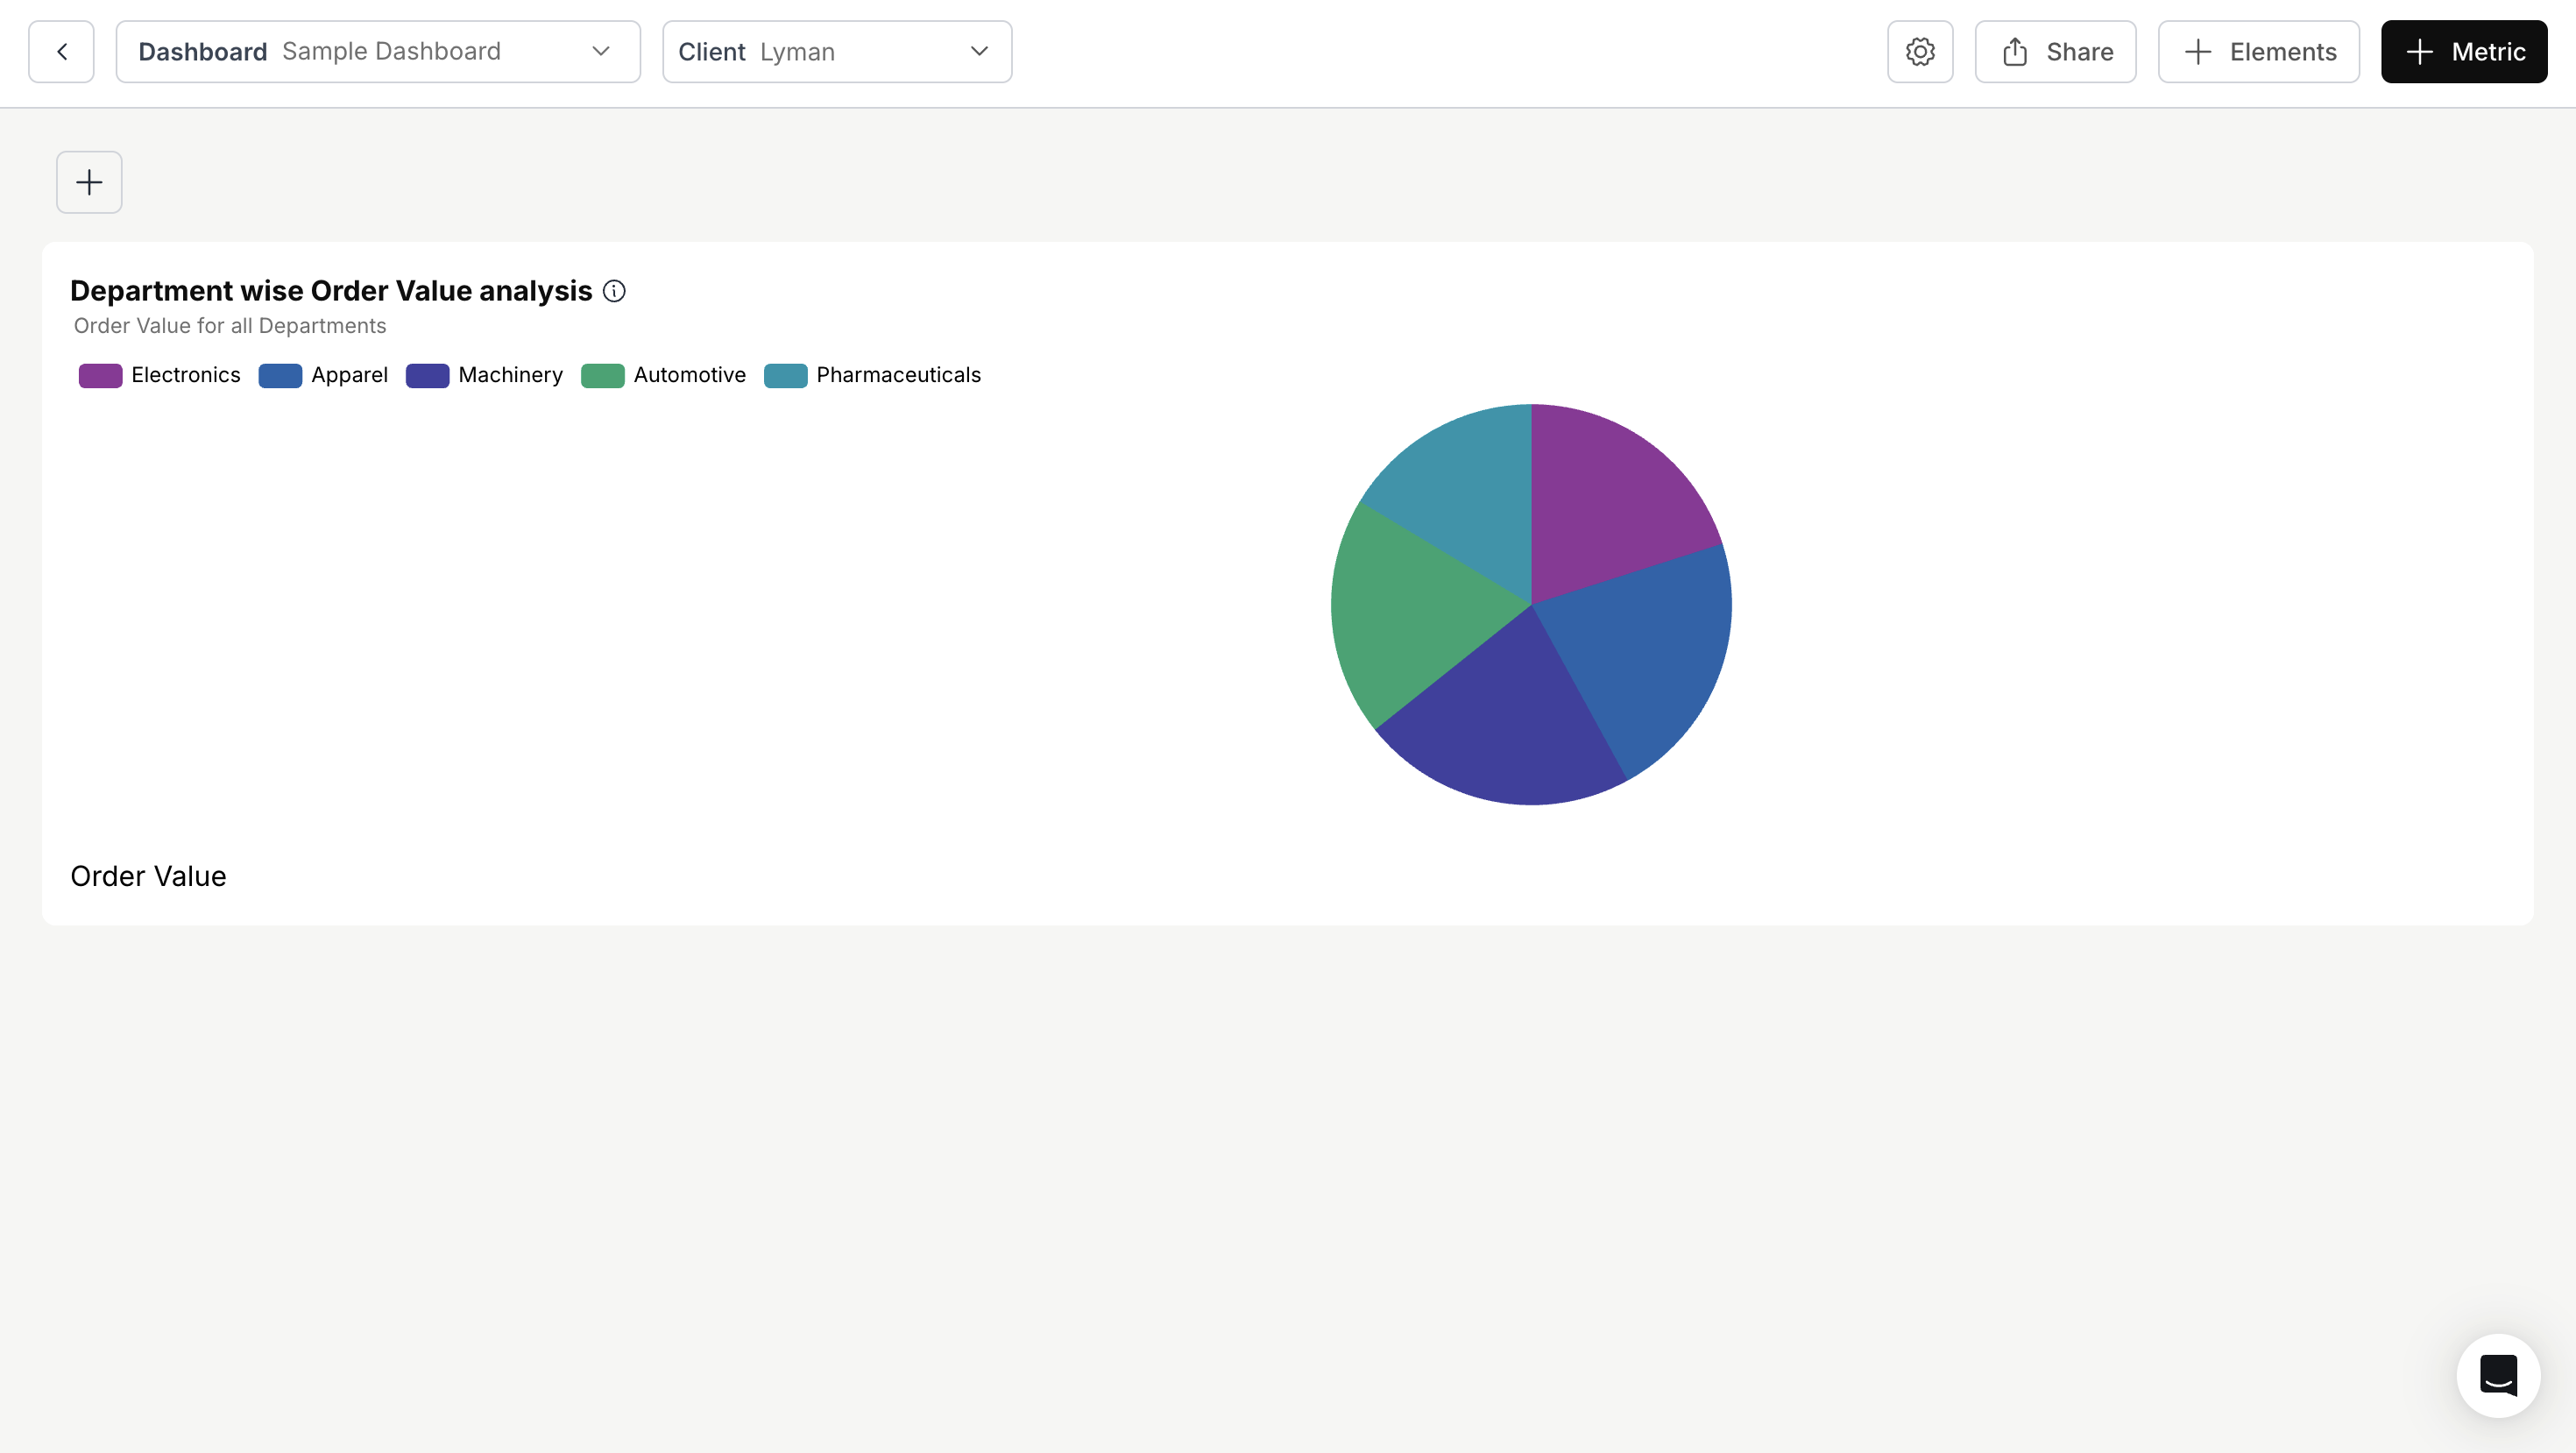
* Add Metric to Dashboard: Select a dashboard name from the dropdown menu and click "Save" to integrate your metric into the chosen dashboard. Your metric will appear in the selected dashboard!
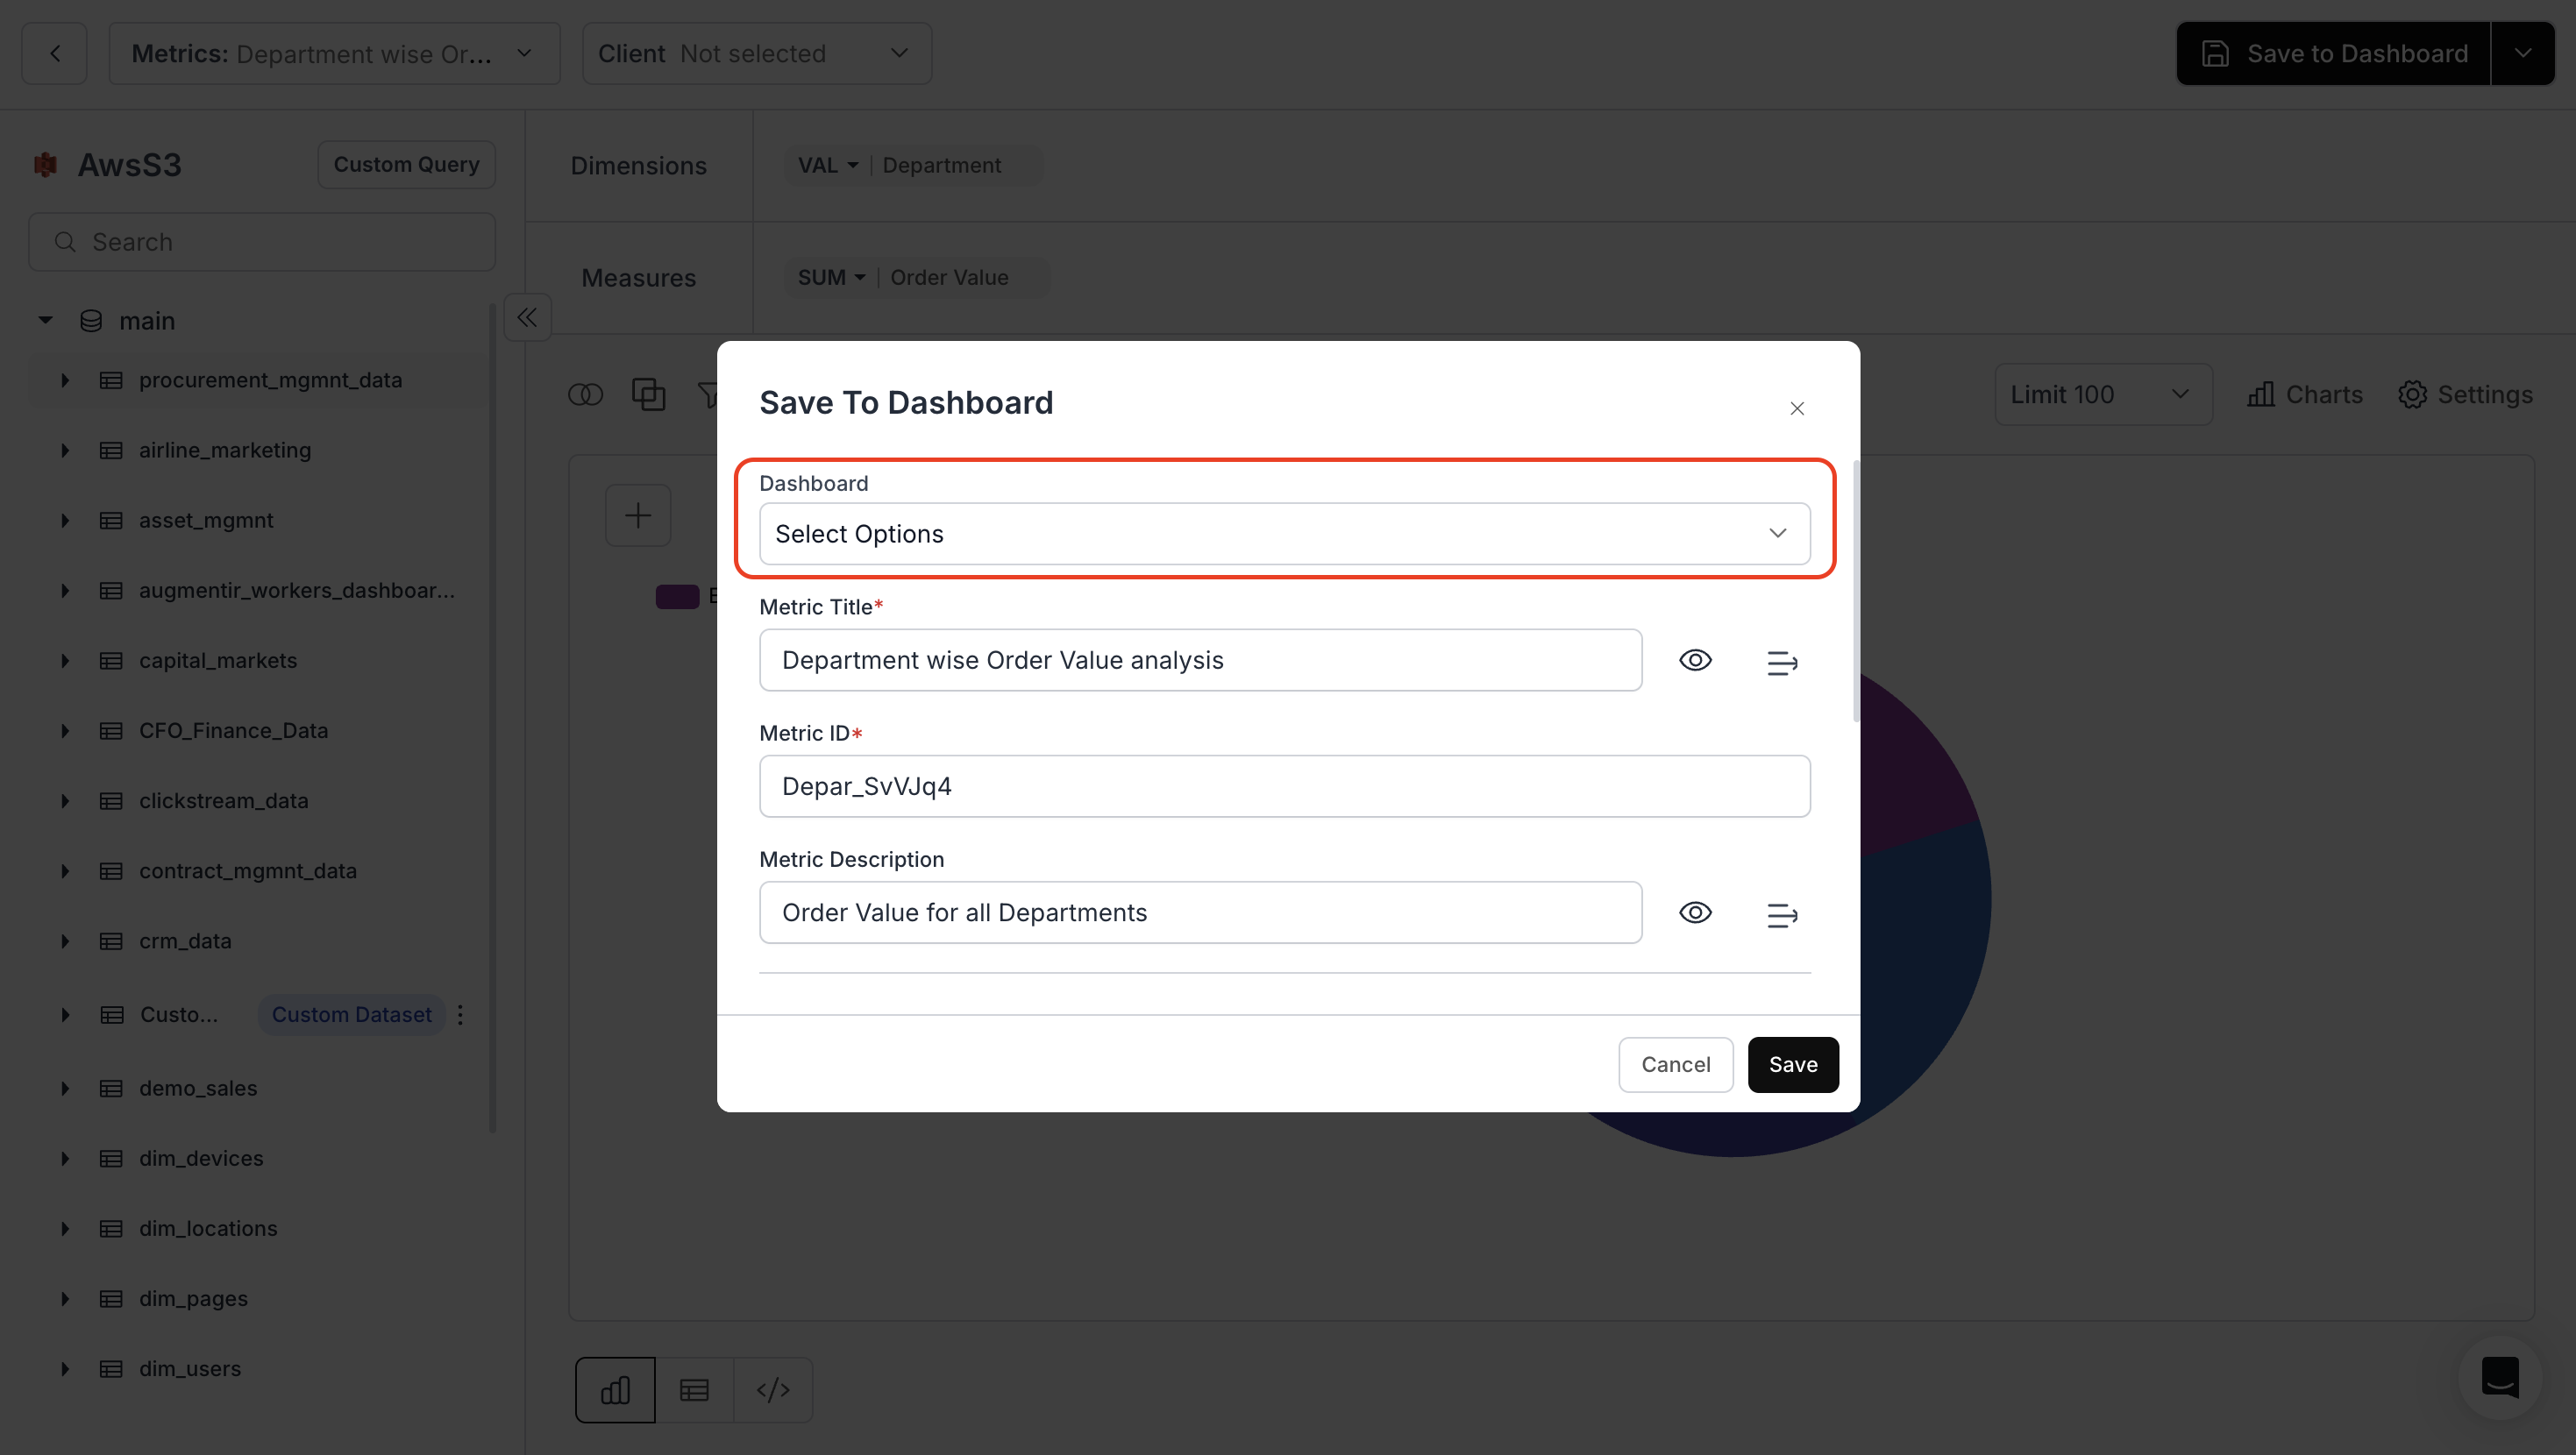
* Save Metric as Draft: Leave the dashboard selection empty and click "Save" to create an unpublished metric. Draft metrics can be added to dashboards at a later time.
For more details on saving a metric as a Draft:
You’ve successfully created a metric in Databrain!\
Your new metric is now ready for visualization, analysis, and integration into dashboards.
 * Choose an aggregation method for the Measure: `COUNT ROW`, `AVG`, `SUM`, `COUNT`, `COUNT DISTINCT`, `MAX`, `MIN`, or `Original Value`.
 * Choose a visualization from the Charts icon.
* Use Joins, Group by, Filters, Sort, and Dynamic Property from the toolbar to enhance your metric.
* Adjust chart settings via the Settings icon.
* For chart-specific setup instructions, see [Chart Setup guides](/guides/visualizations-actions-and-appearance/chart-setup/overview).
* Choose a visualization from the Charts icon.
* Use Joins, Group by, Filters, Sort, and Dynamic Property from the toolbar to enhance your metric.
* Adjust chart settings via the Settings icon.
* For chart-specific setup instructions, see [Chart Setup guides](/guides/visualizations-actions-and-appearance/chart-setup/overview).
 For a detailed guide on Dynamic Property, refer to the section below:\
Dynamic Property
For a detailed guide on Dynamic Property, refer to the section below:\
Dynamic Property
 For more details on long descriptions and footnotes:\
Footnote and Long Description
For more details on long descriptions and footnotes:\
Footnote and Long Description
 * Save Metric as Draft: Leave the dashboard selection empty and click "Save" to create an unpublished metric. Draft metrics can be added to dashboards at a later time.
 For more details on saving a metric as a Draft: