> ## Documentation Index
> Fetch the complete documentation index at: https://docs.usedatabrain.com/llms.txt
> Use this file to discover all available pages before exploring further.
# Create a Metric using Chat Mode
> This guide offers a streamlined process for creating a metric using Chat Mode, making it easy for users to visualize and customize their data effectively.
> Databrain's chat mode is an intuitive, conversational interface that allows users to create metrics and visualizations using natural language queries
**Key Benefits:**
* **Natural Language Interaction** — Users can simply type questions about their data in plain English, making it accessible to non-technical users.
* **Automated Insights Generation** — The chat mode responds to queries and also generates visualizations and detailed explanations automatically, streamlining the process of data analysis and reducing manual report generation time.
- Select the dashboard where you intend to add the metric.
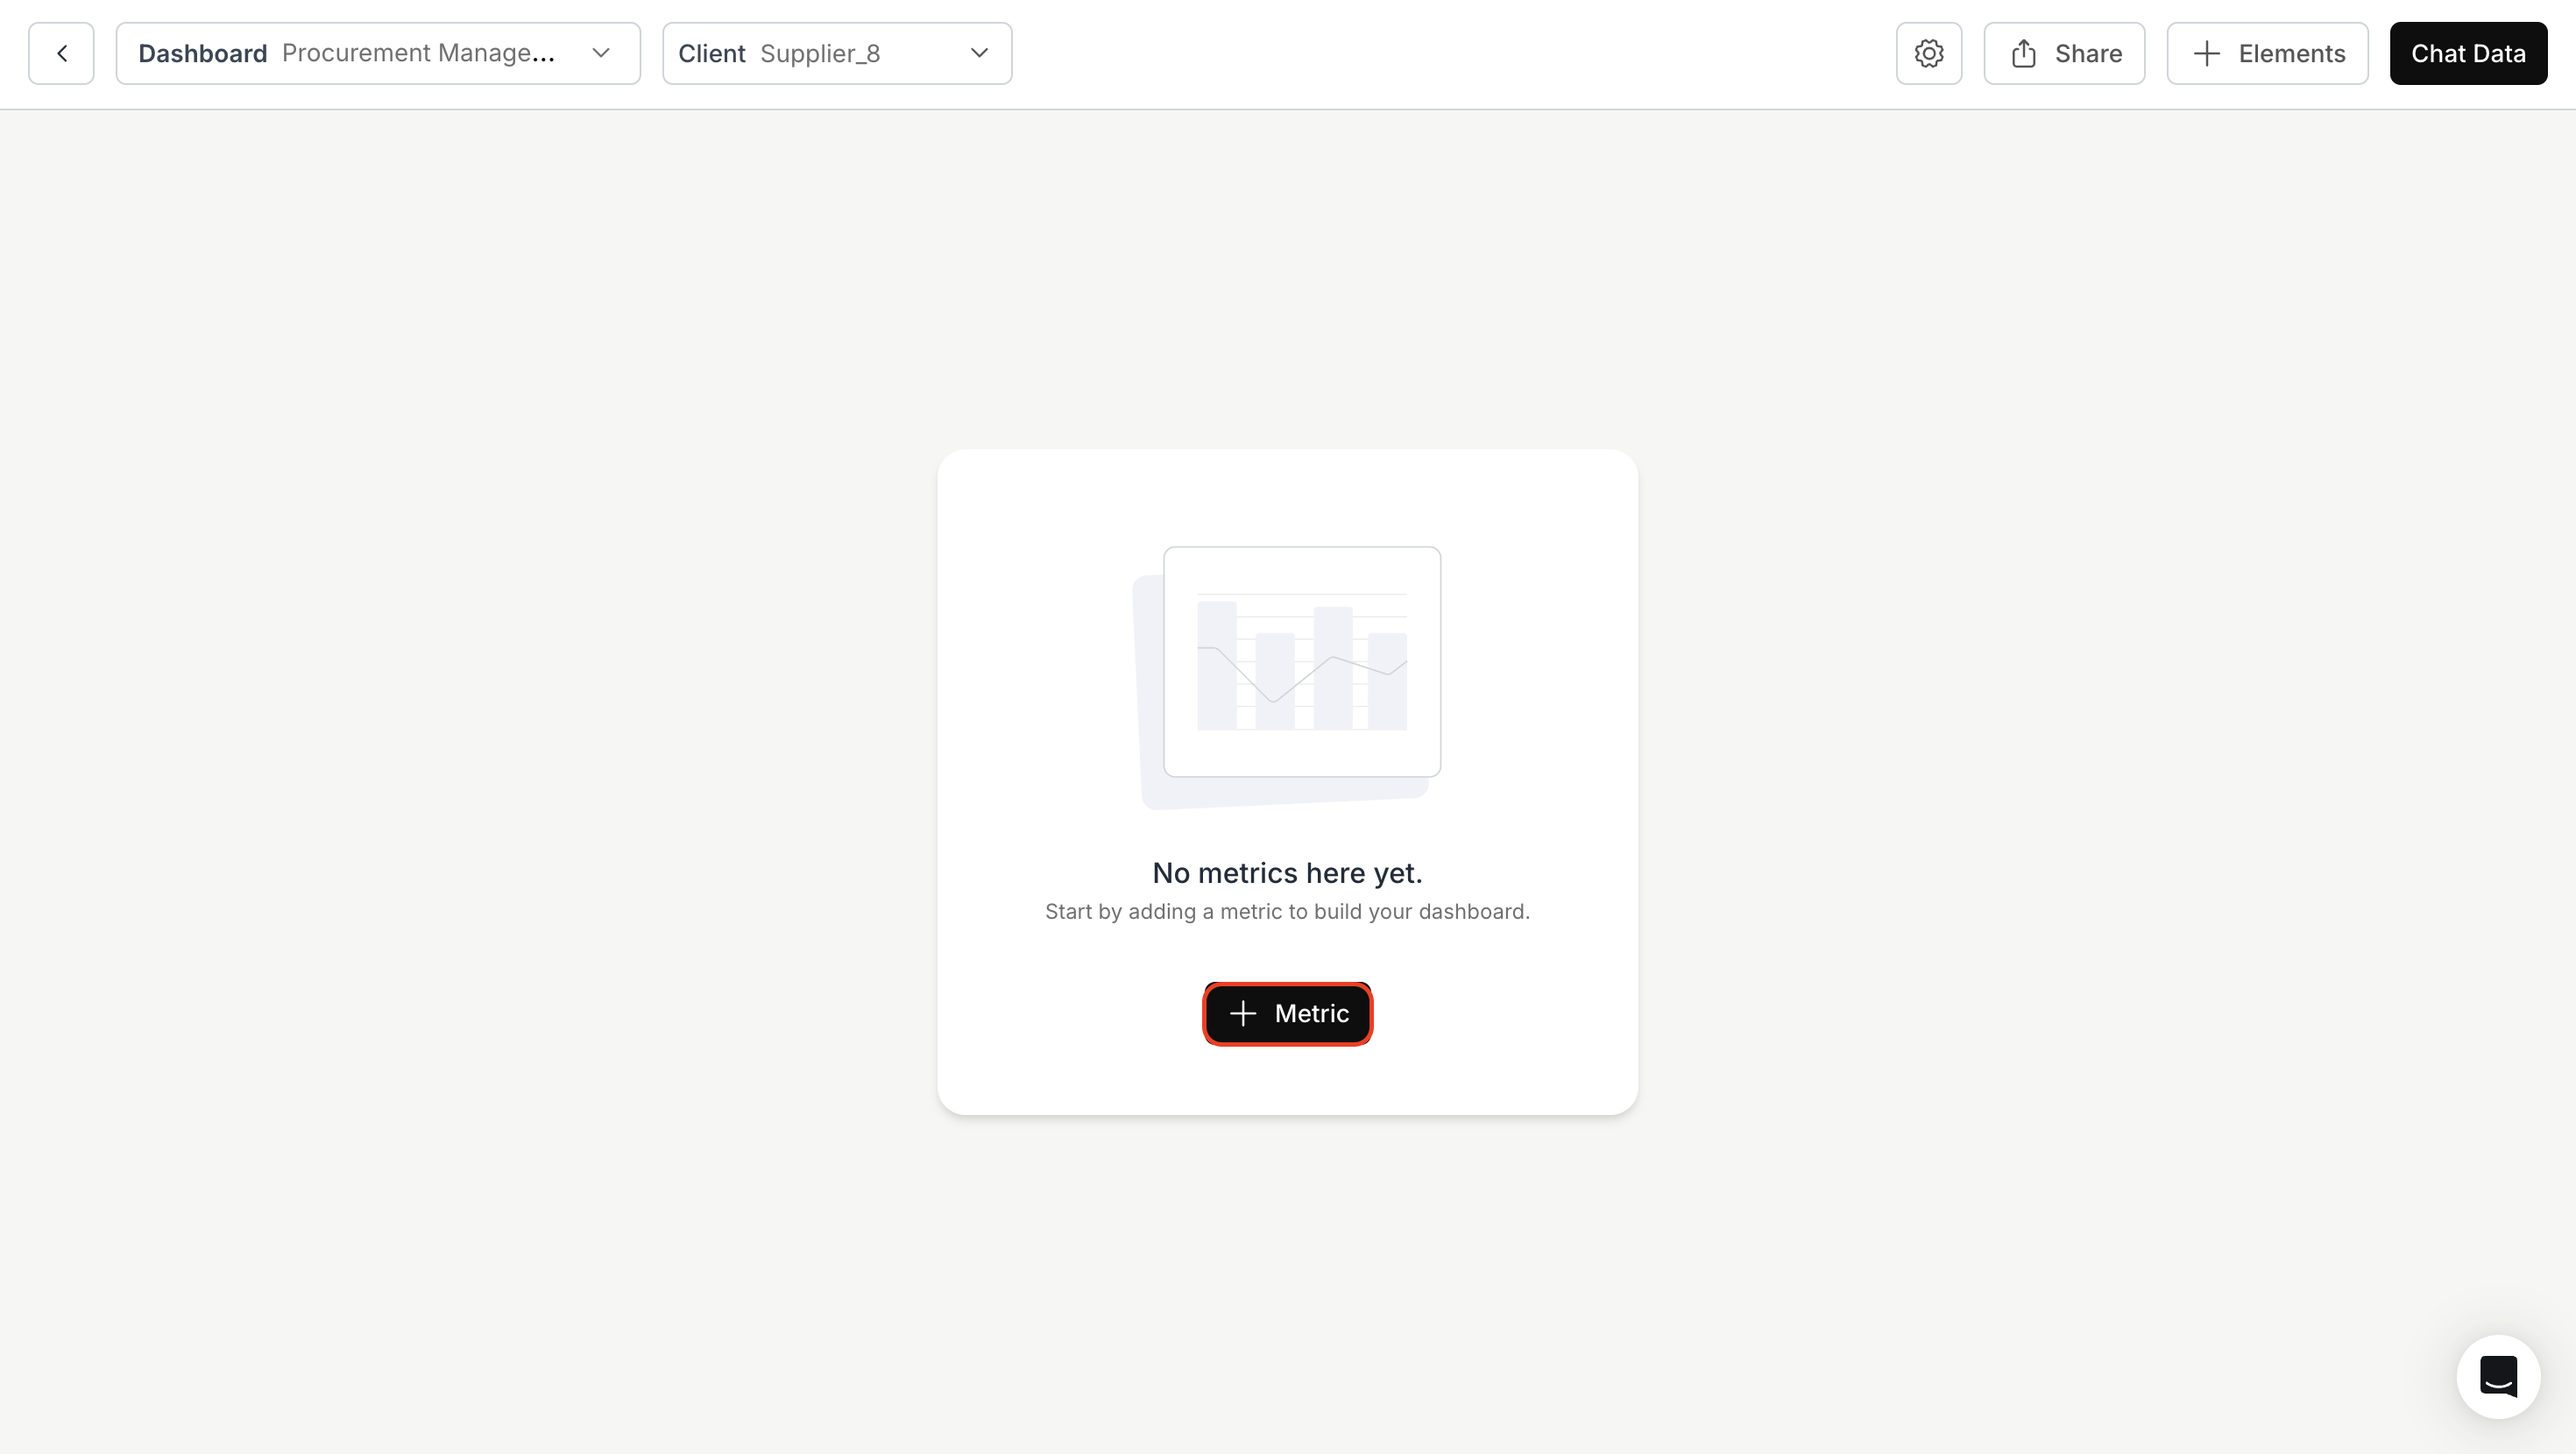
- For the first metric, click the **+ Metric** button.
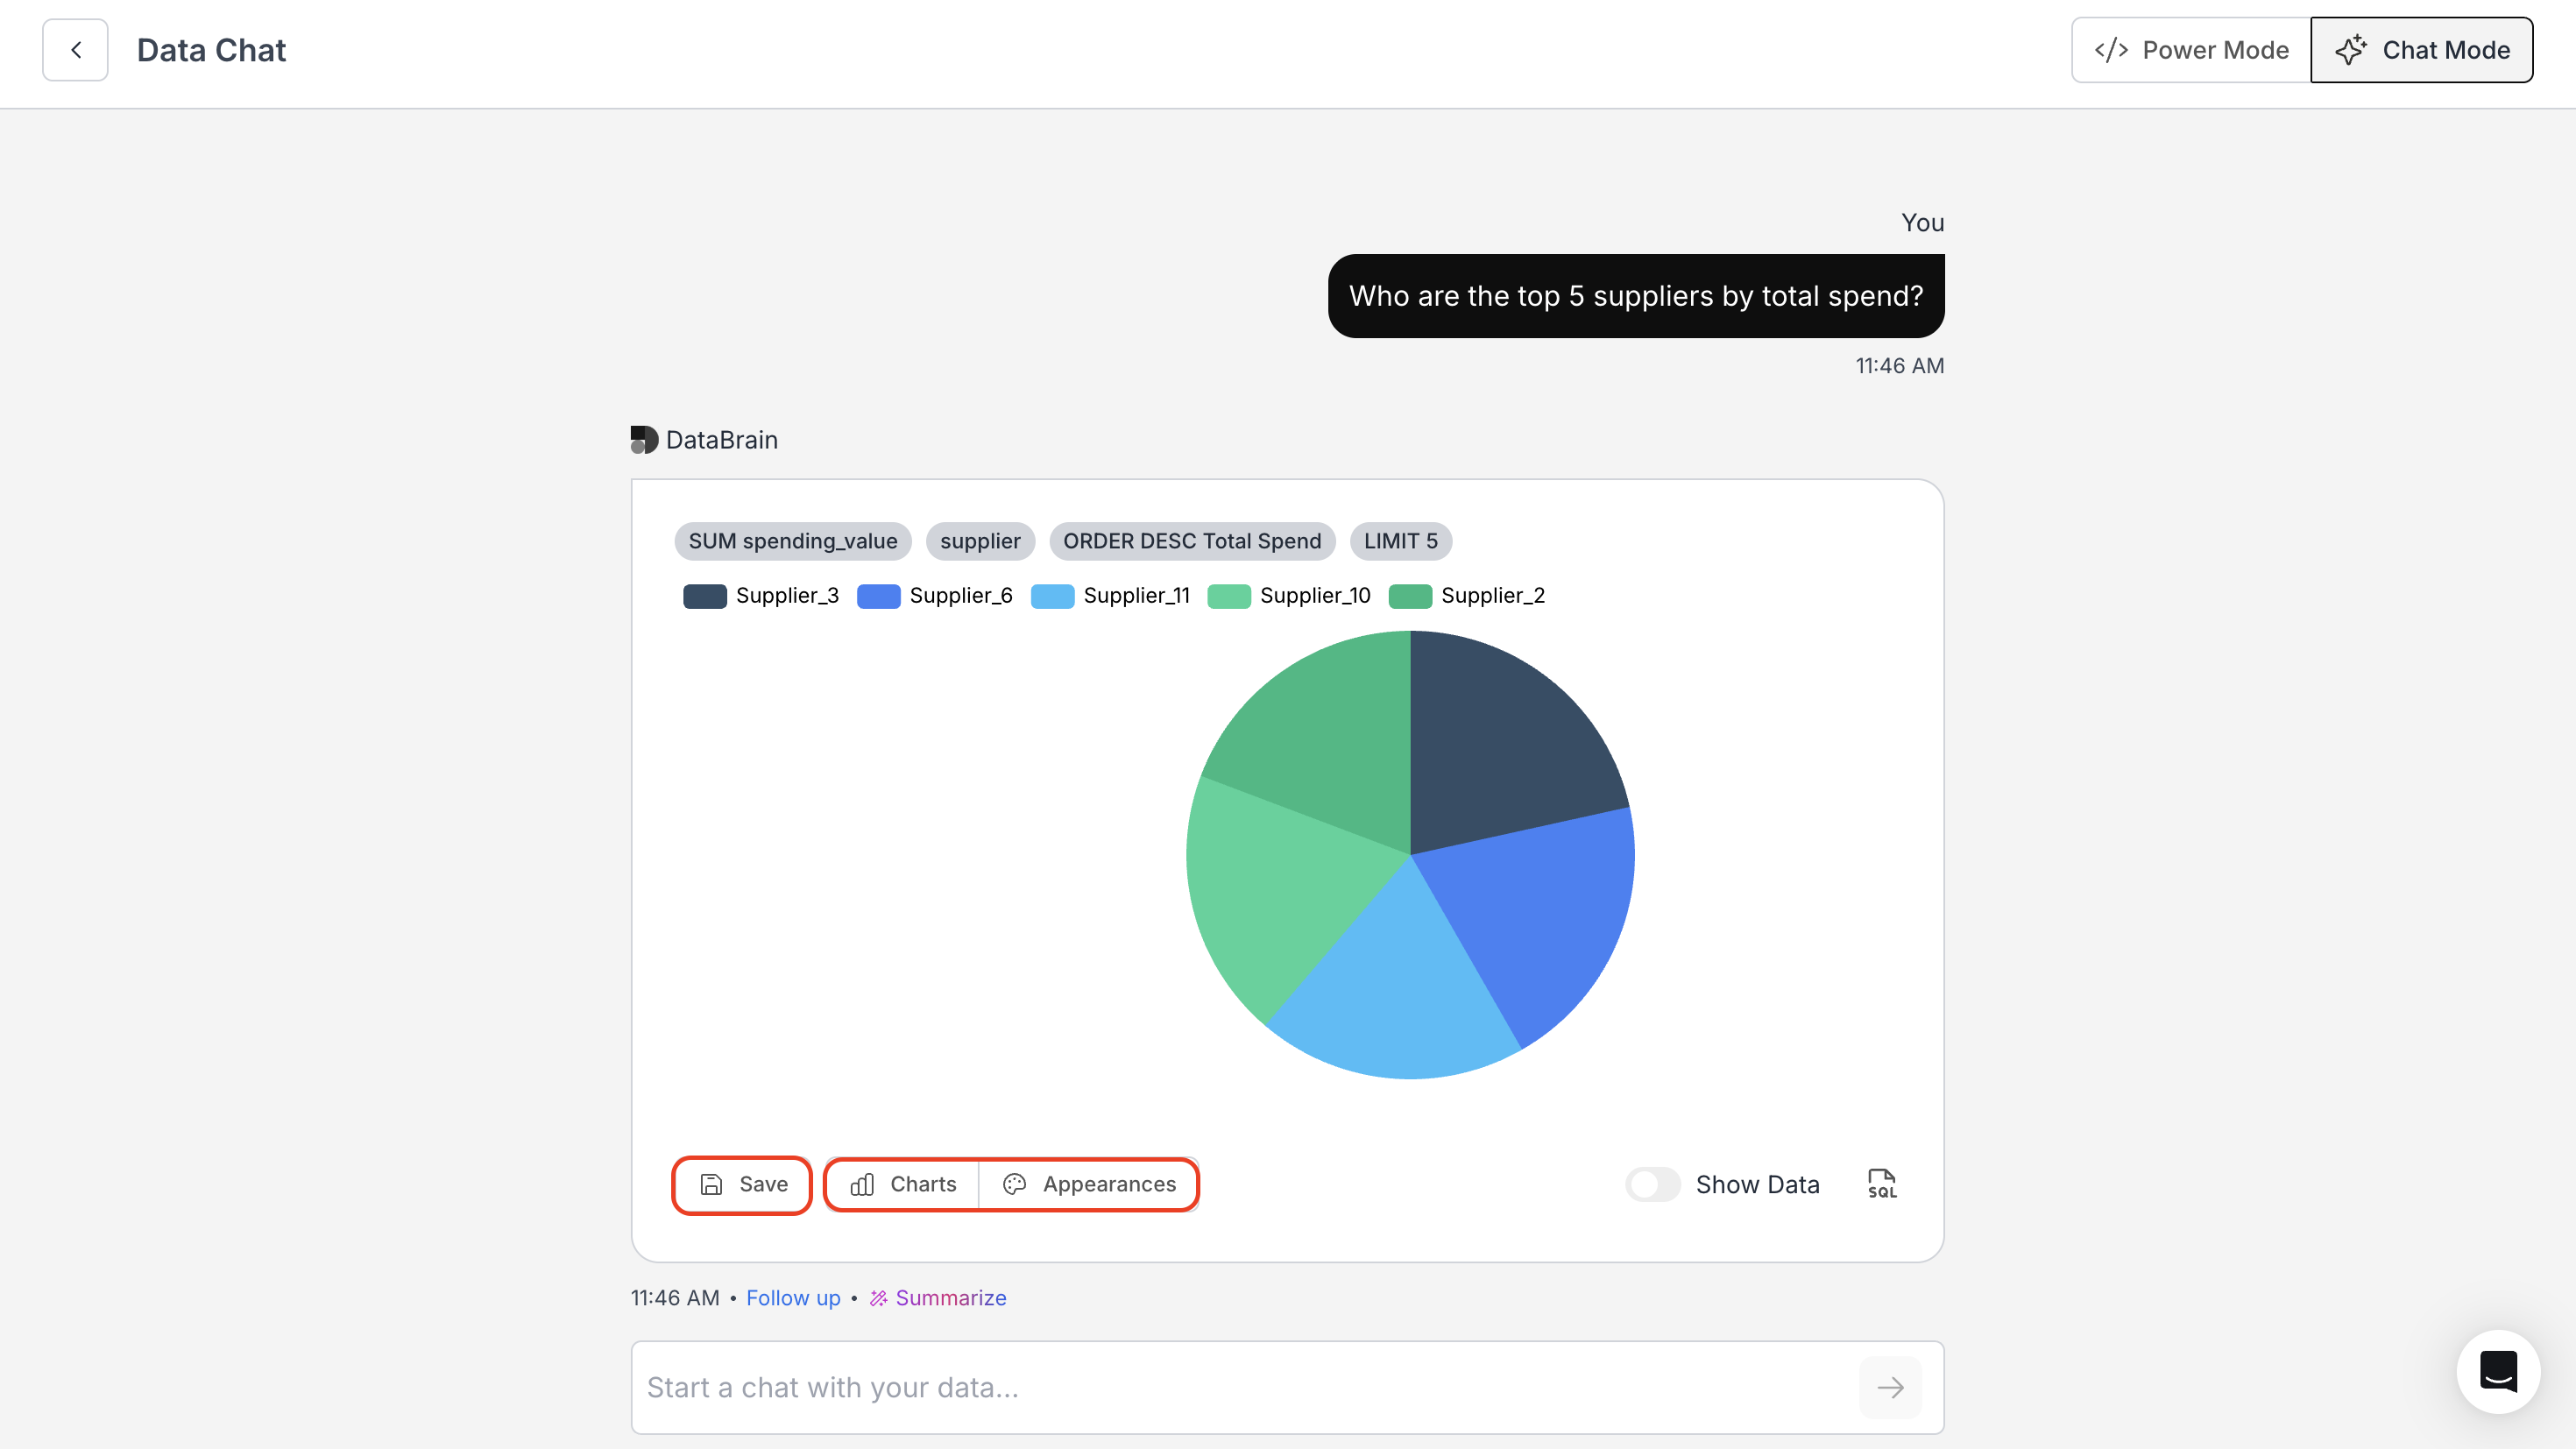
 Provide an appropriate question based on the metric you want to create, and click on the **→** icon.
 * Choose your preferred visualization from the "Charts" icon.
* Customize your graph using the options available in the "Appearances" icon.
* (Optional) Use **Summarize** to view the AI-generated interpretation, and **SQL** to view the SQL query behind the visualization.
* Click on **Save**.
* Choose your preferred visualization from the "Charts" icon.
* Customize your graph using the options available in the "Appearances" icon.
* (Optional) Use **Summarize** to view the AI-generated interpretation, and **SQL** to view the SQL query behind the visualization.
* Click on **Save**.
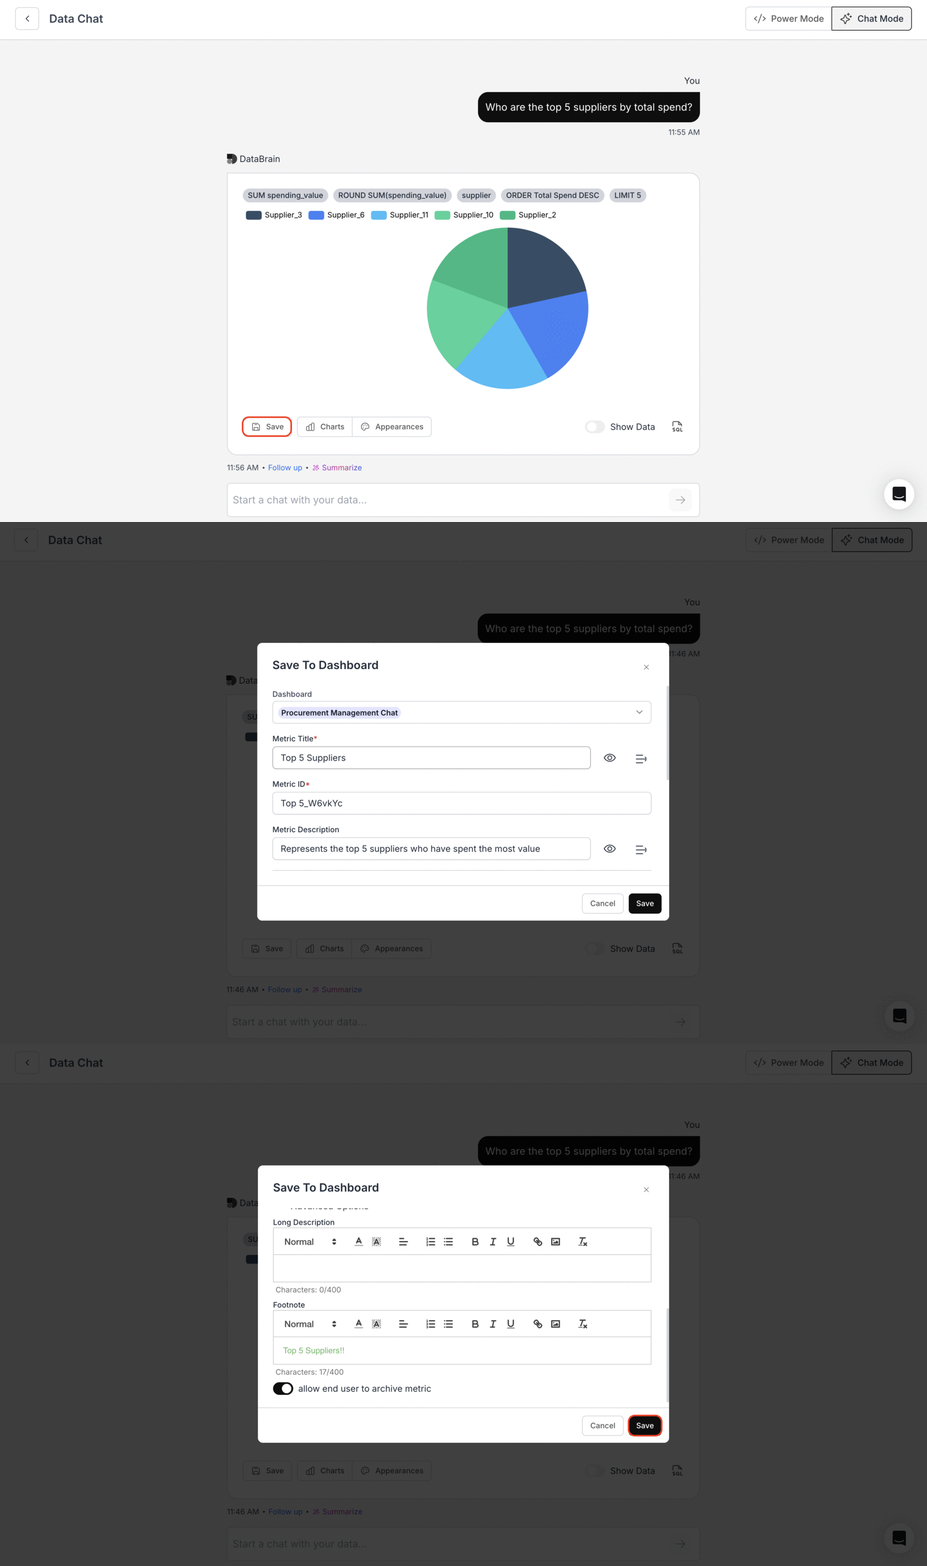
 Fill in the necessary details for your metric and click on the **Save** button.
 You’ve successfully created a metric using Chat Mode in Databrain!\
Your visualization, summary, and configuration are now saved — enabling faster, more intuitive analysis powered by natural language.
You’ve successfully created a metric using Chat Mode in Databrain!\
Your visualization, summary, and configuration are now saved — enabling faster, more intuitive analysis powered by natural language.