> ## Documentation Index
> Fetch the complete documentation index at: https://docs.usedatabrain.com/llms.txt
> Use this file to discover all available pages before exploring further.
# Create a Metric using Custom SQL
> This guide provides a step-by-step approach to utilizing custom SQL for creating metrics, which can enhance your data analysis capabilities.
On the **Create Metric** page, select the **"Custom Query"** option.
 In the **Query Editor**, enter your custom SQL query.
Use the **"Format Query with AI"** option to align with Databrain's best practices.
Click **"Run Query"** to execute.
In the **Query Editor**, enter your custom SQL query.
Use the **"Format Query with AI"** option to align with Databrain's best practices.
Click **"Run Query"** to execute.
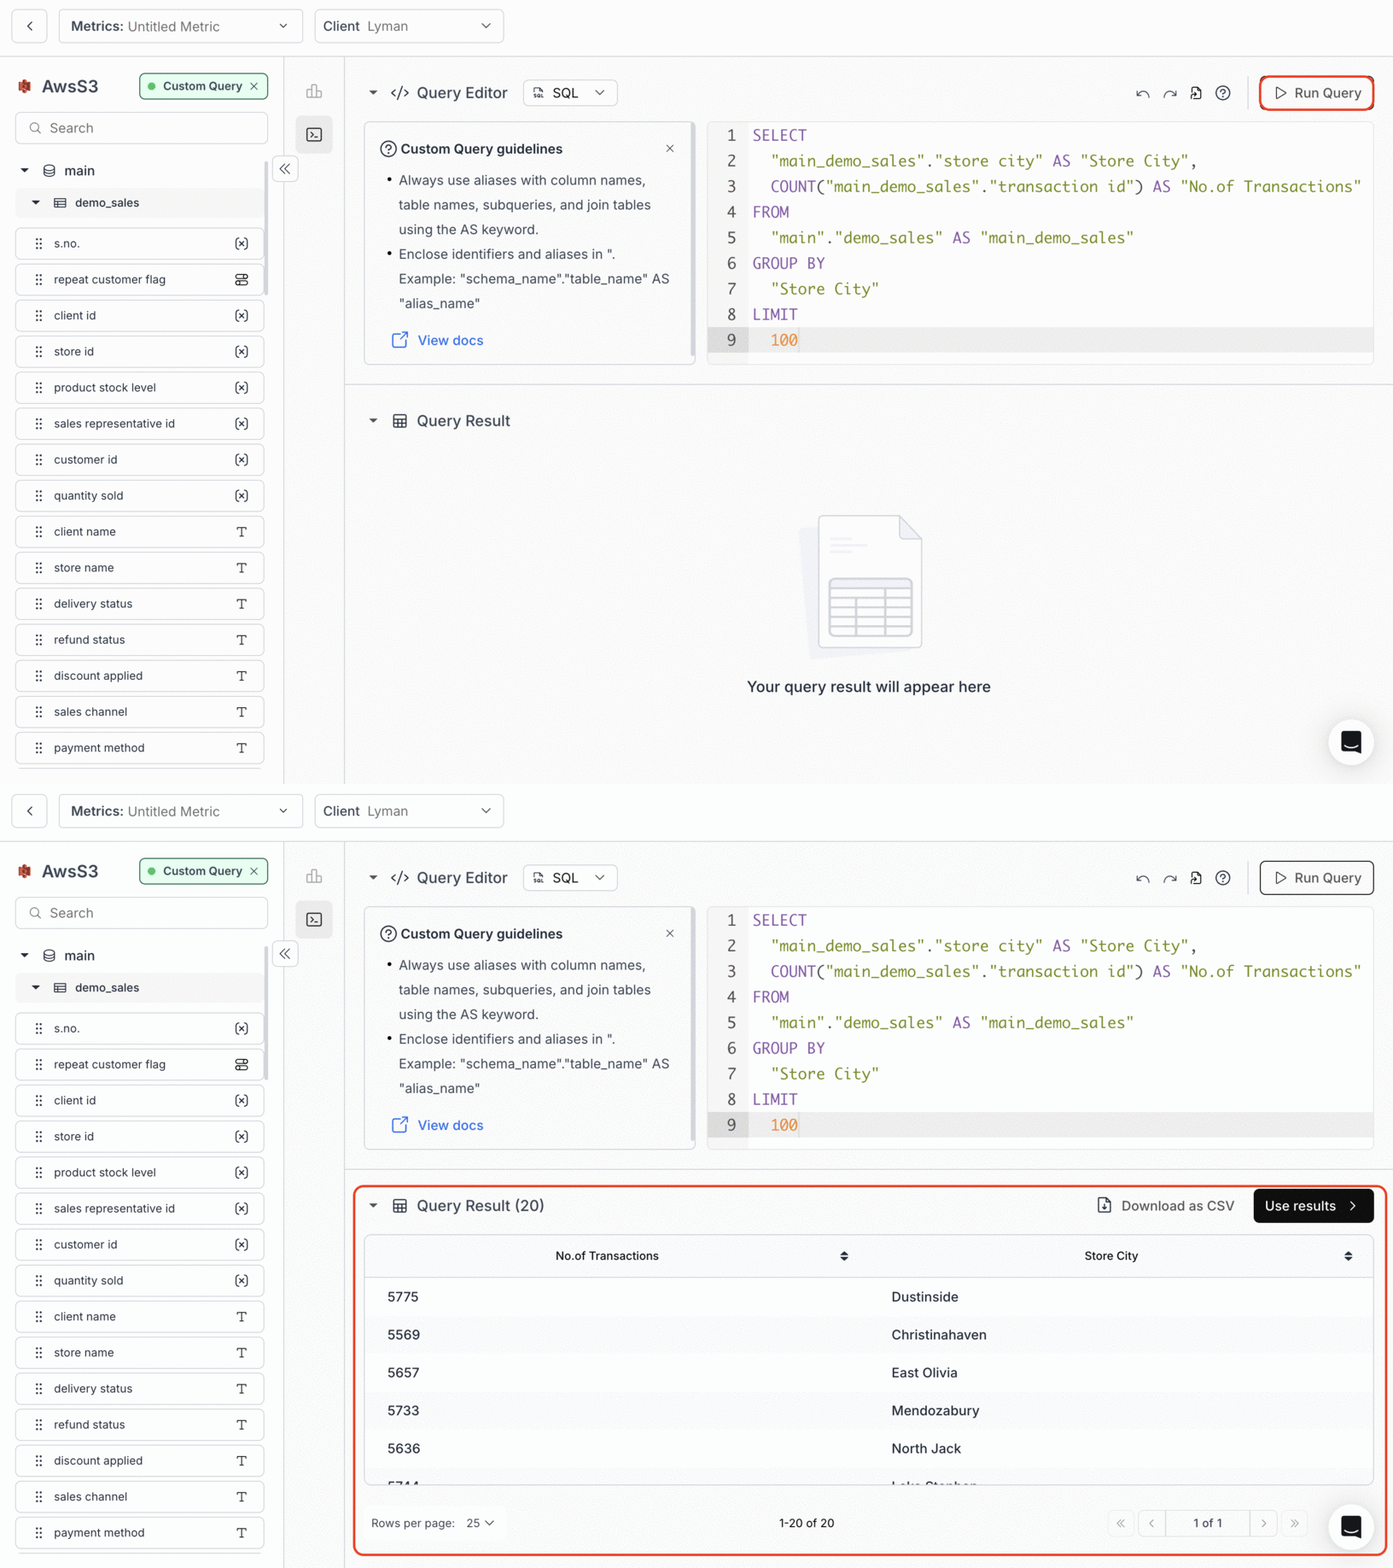 Once the query runs, review the **Query Result** section to view your raw SQL output in a table.
You can download the results as CSV if needed.
Once the query runs, review the **Query Result** section to view your raw SQL output in a table.
You can download the results as CSV if needed.
 Click **Use Results >** to proceed. You can save it in the following ways:
**1. Table Chart**
Click **"Use as Table Chart"**, configure additional settings, and save it to your dashboard.
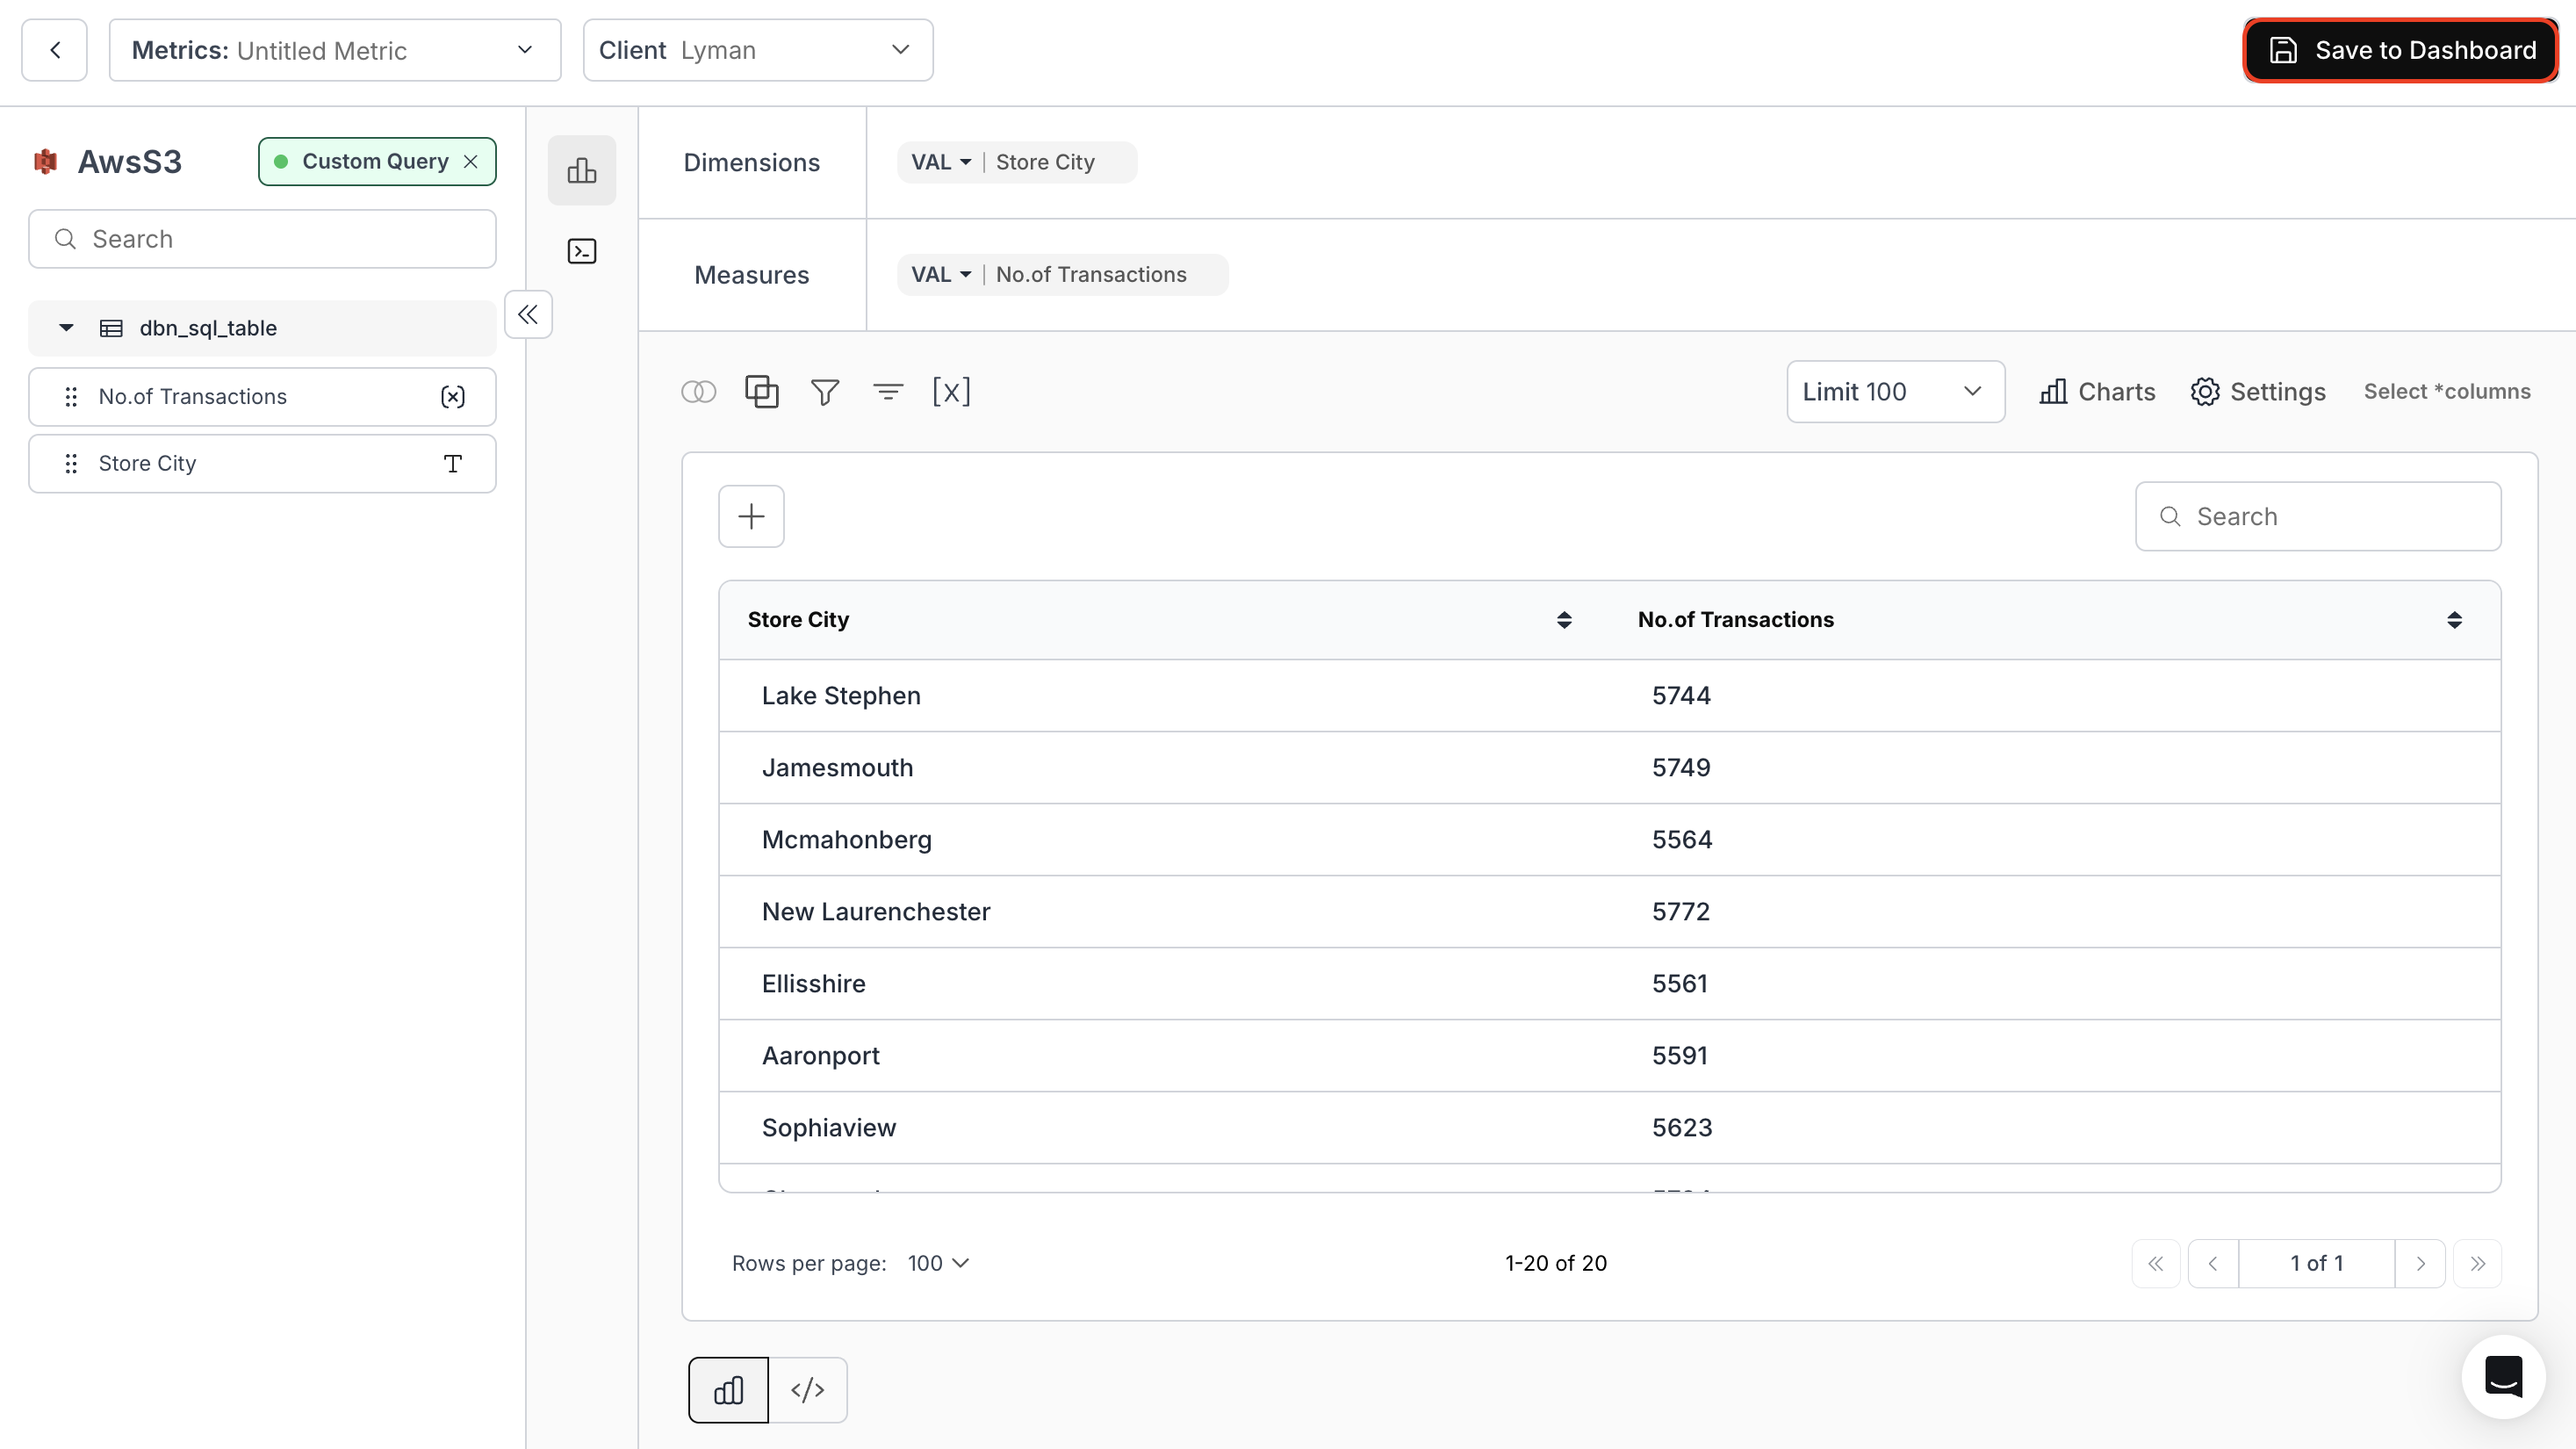
**2. Table Chart with Dynamic Table Property**
This automatically adjusts to the latest structure of your SQL query result — ideal for evolving datasets using `SELECT *`.
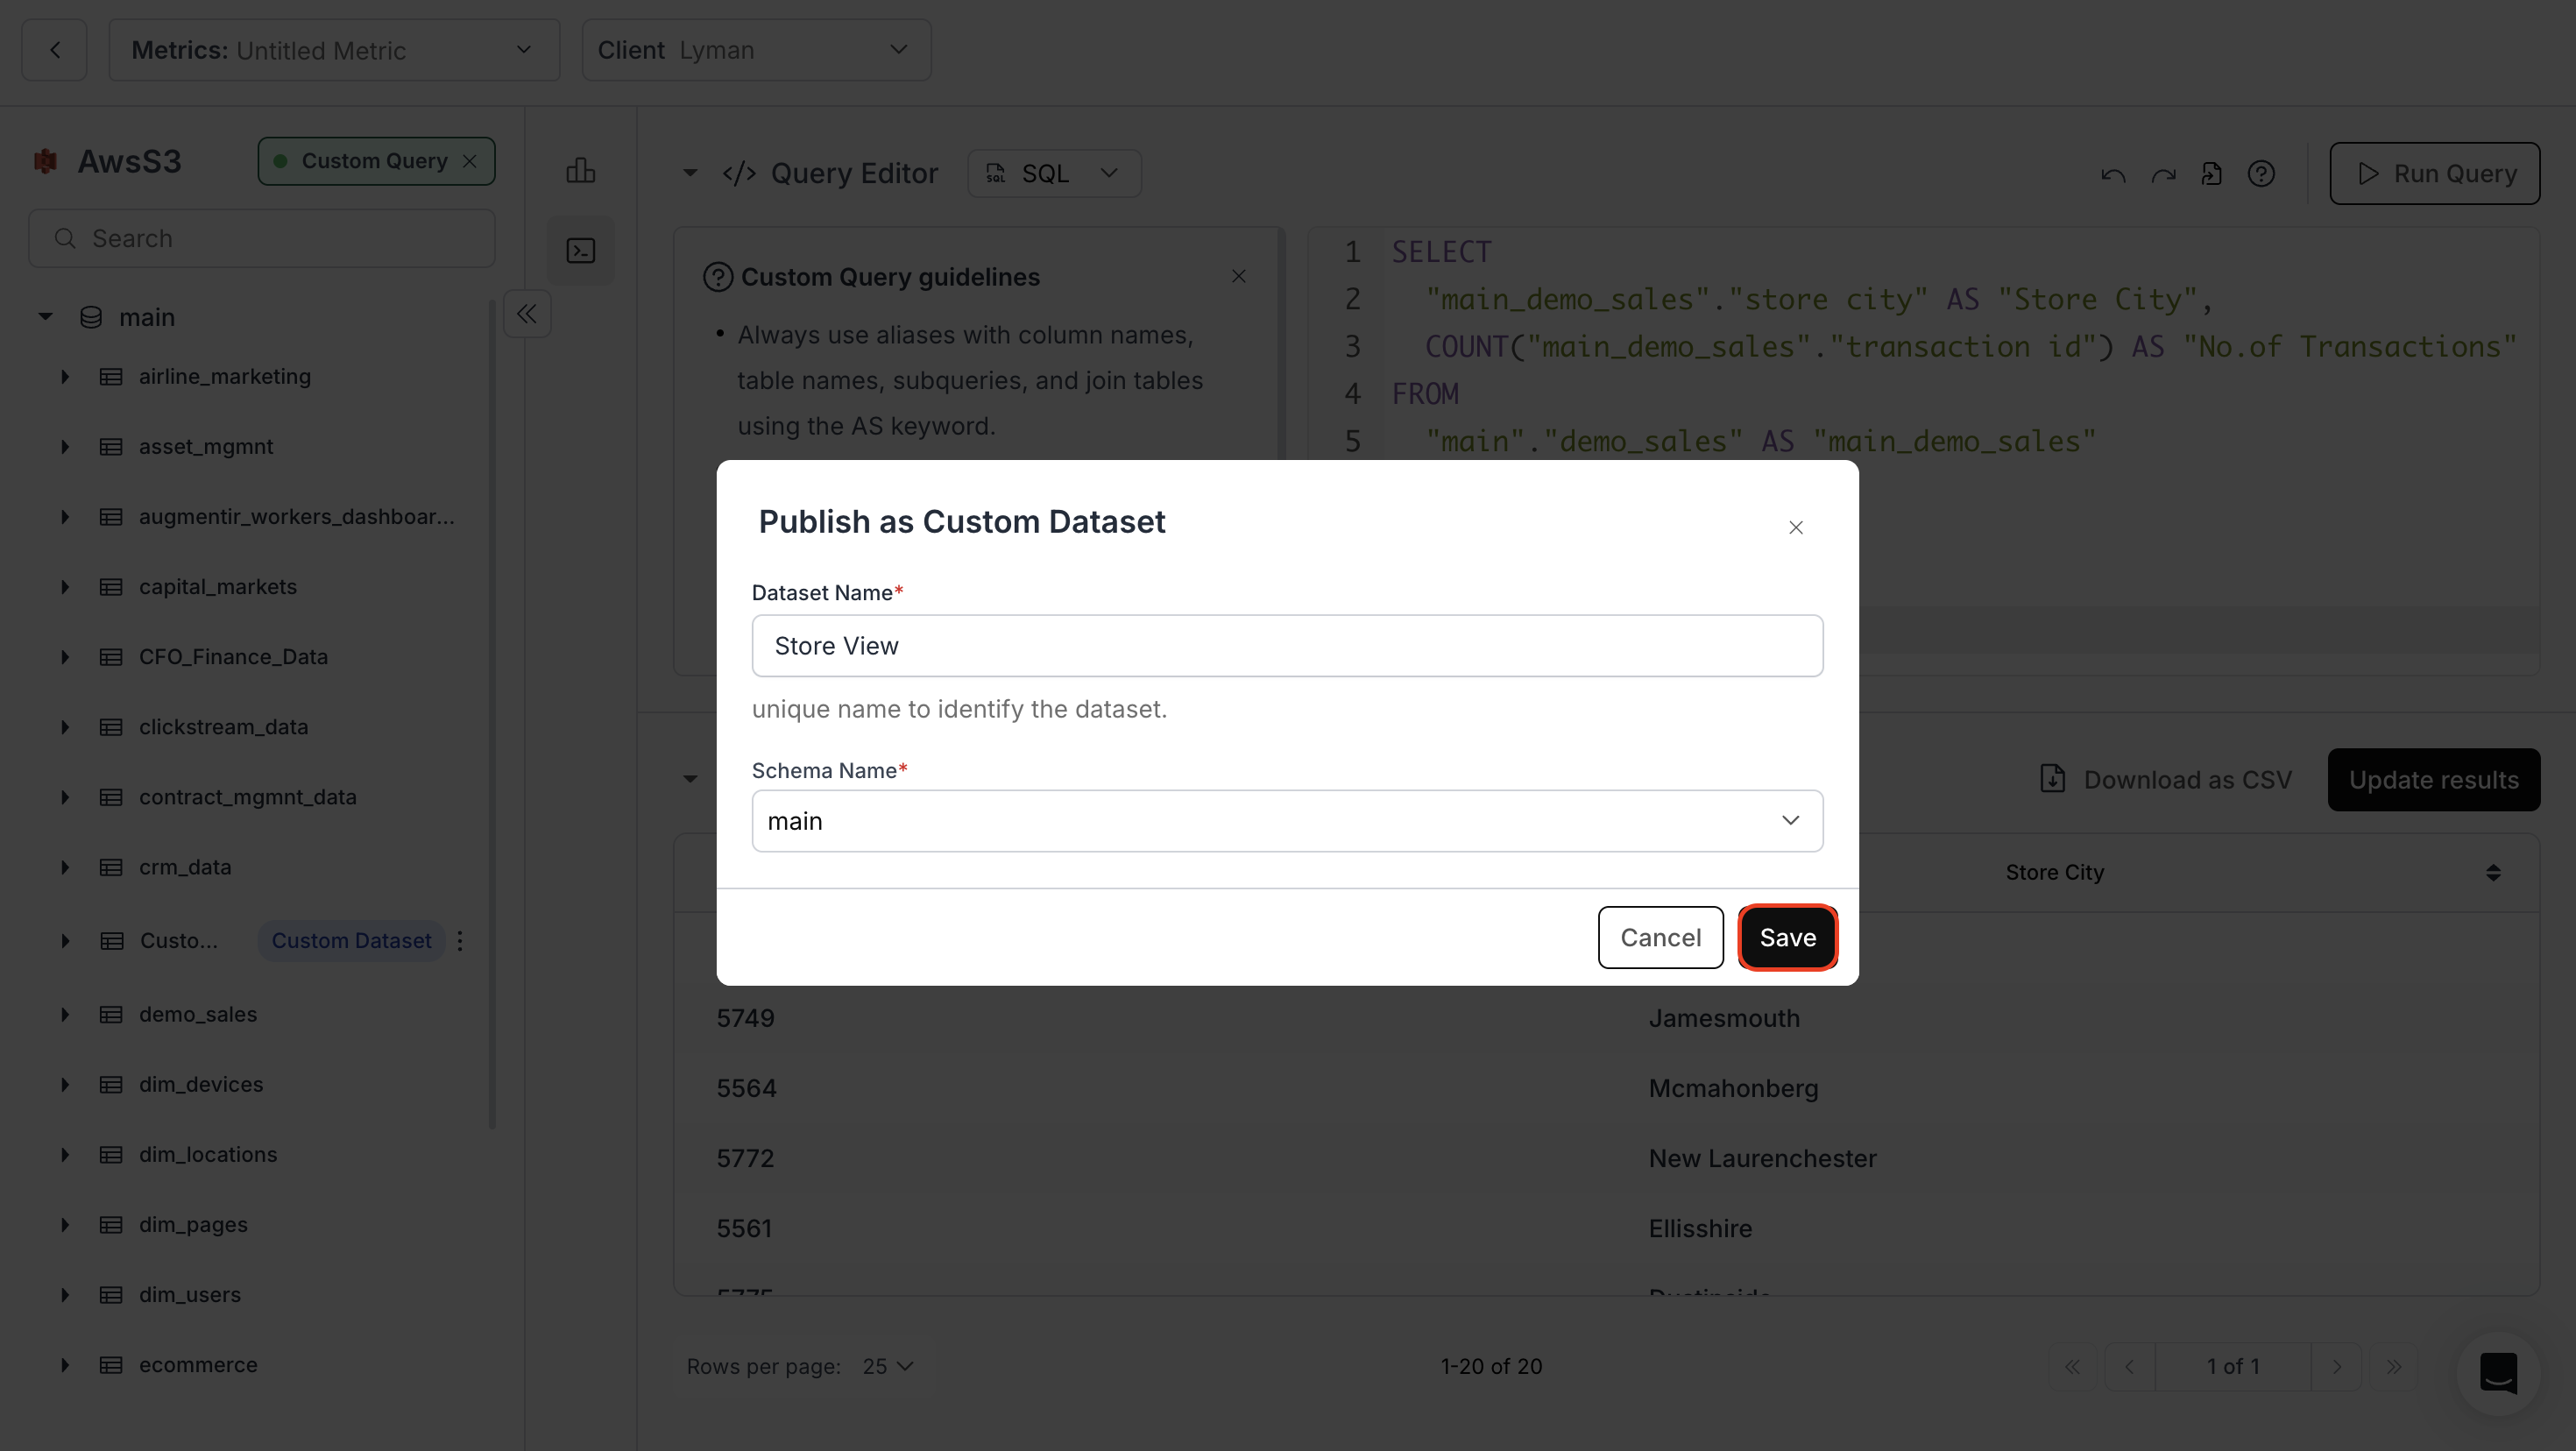
**3. Publish as Custom Dataset**
Provide a dataset name, choose a schema, and click **Save**.
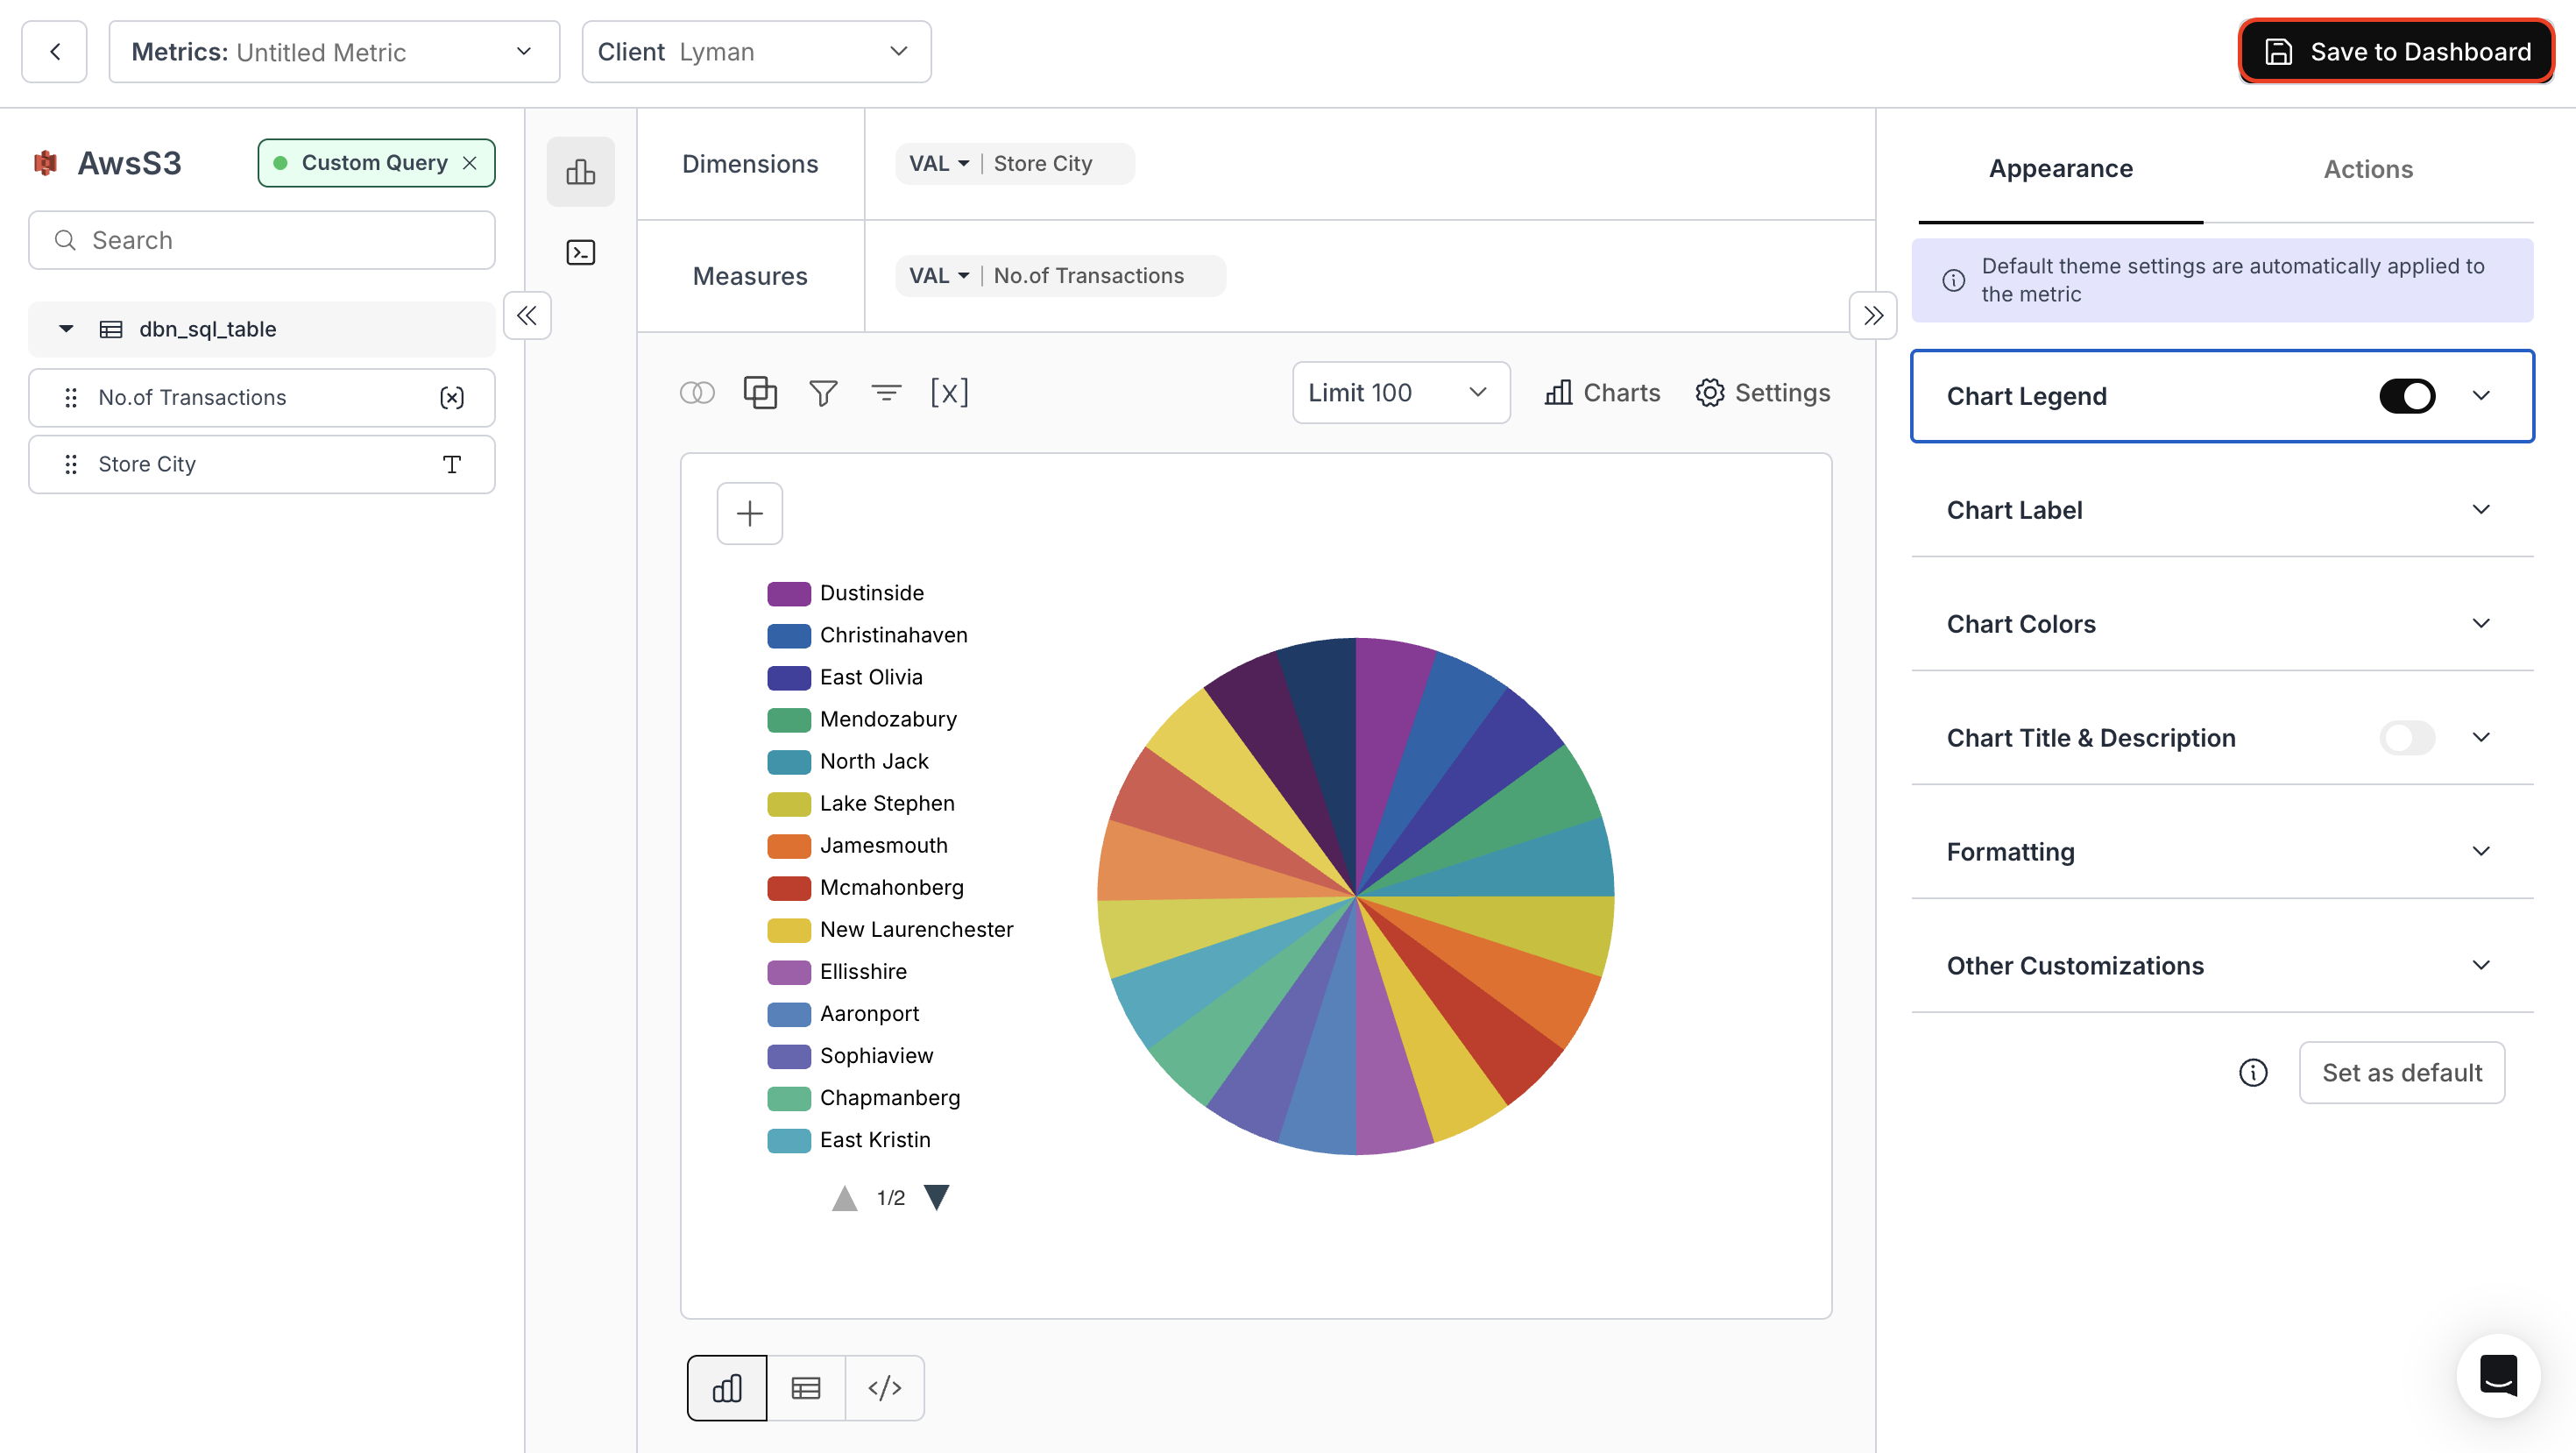
**4. New Chart**
Select your preferred chart type, configure it, and save.
 At any point, you can switch between the **Chart Builder** and the **Query Editor**.
Make changes to your SQL and immediately view updated results in both areas.
You’ve successfully created a metric using Custom SQL in Databrain!\
Your query-driven metric is now active, giving you full control over data transformation, advanced logic, and custom visualizations directly from your SQL output.
At any point, you can switch between the **Chart Builder** and the **Query Editor**.
Make changes to your SQL and immediately view updated results in both areas.
You’ve successfully created a metric using Custom SQL in Databrain!\
Your query-driven metric is now active, giving you full control over data transformation, advanced logic, and custom visualizations directly from your SQL output.