> ## Documentation Index
> Fetch the complete documentation index at: https://docs.usedatabrain.com/llms.txt
> Use this file to discover all available pages before exploring further.
# Creating a theme
> You can create a theme to choose how the Databrain Plugin in your application should look like
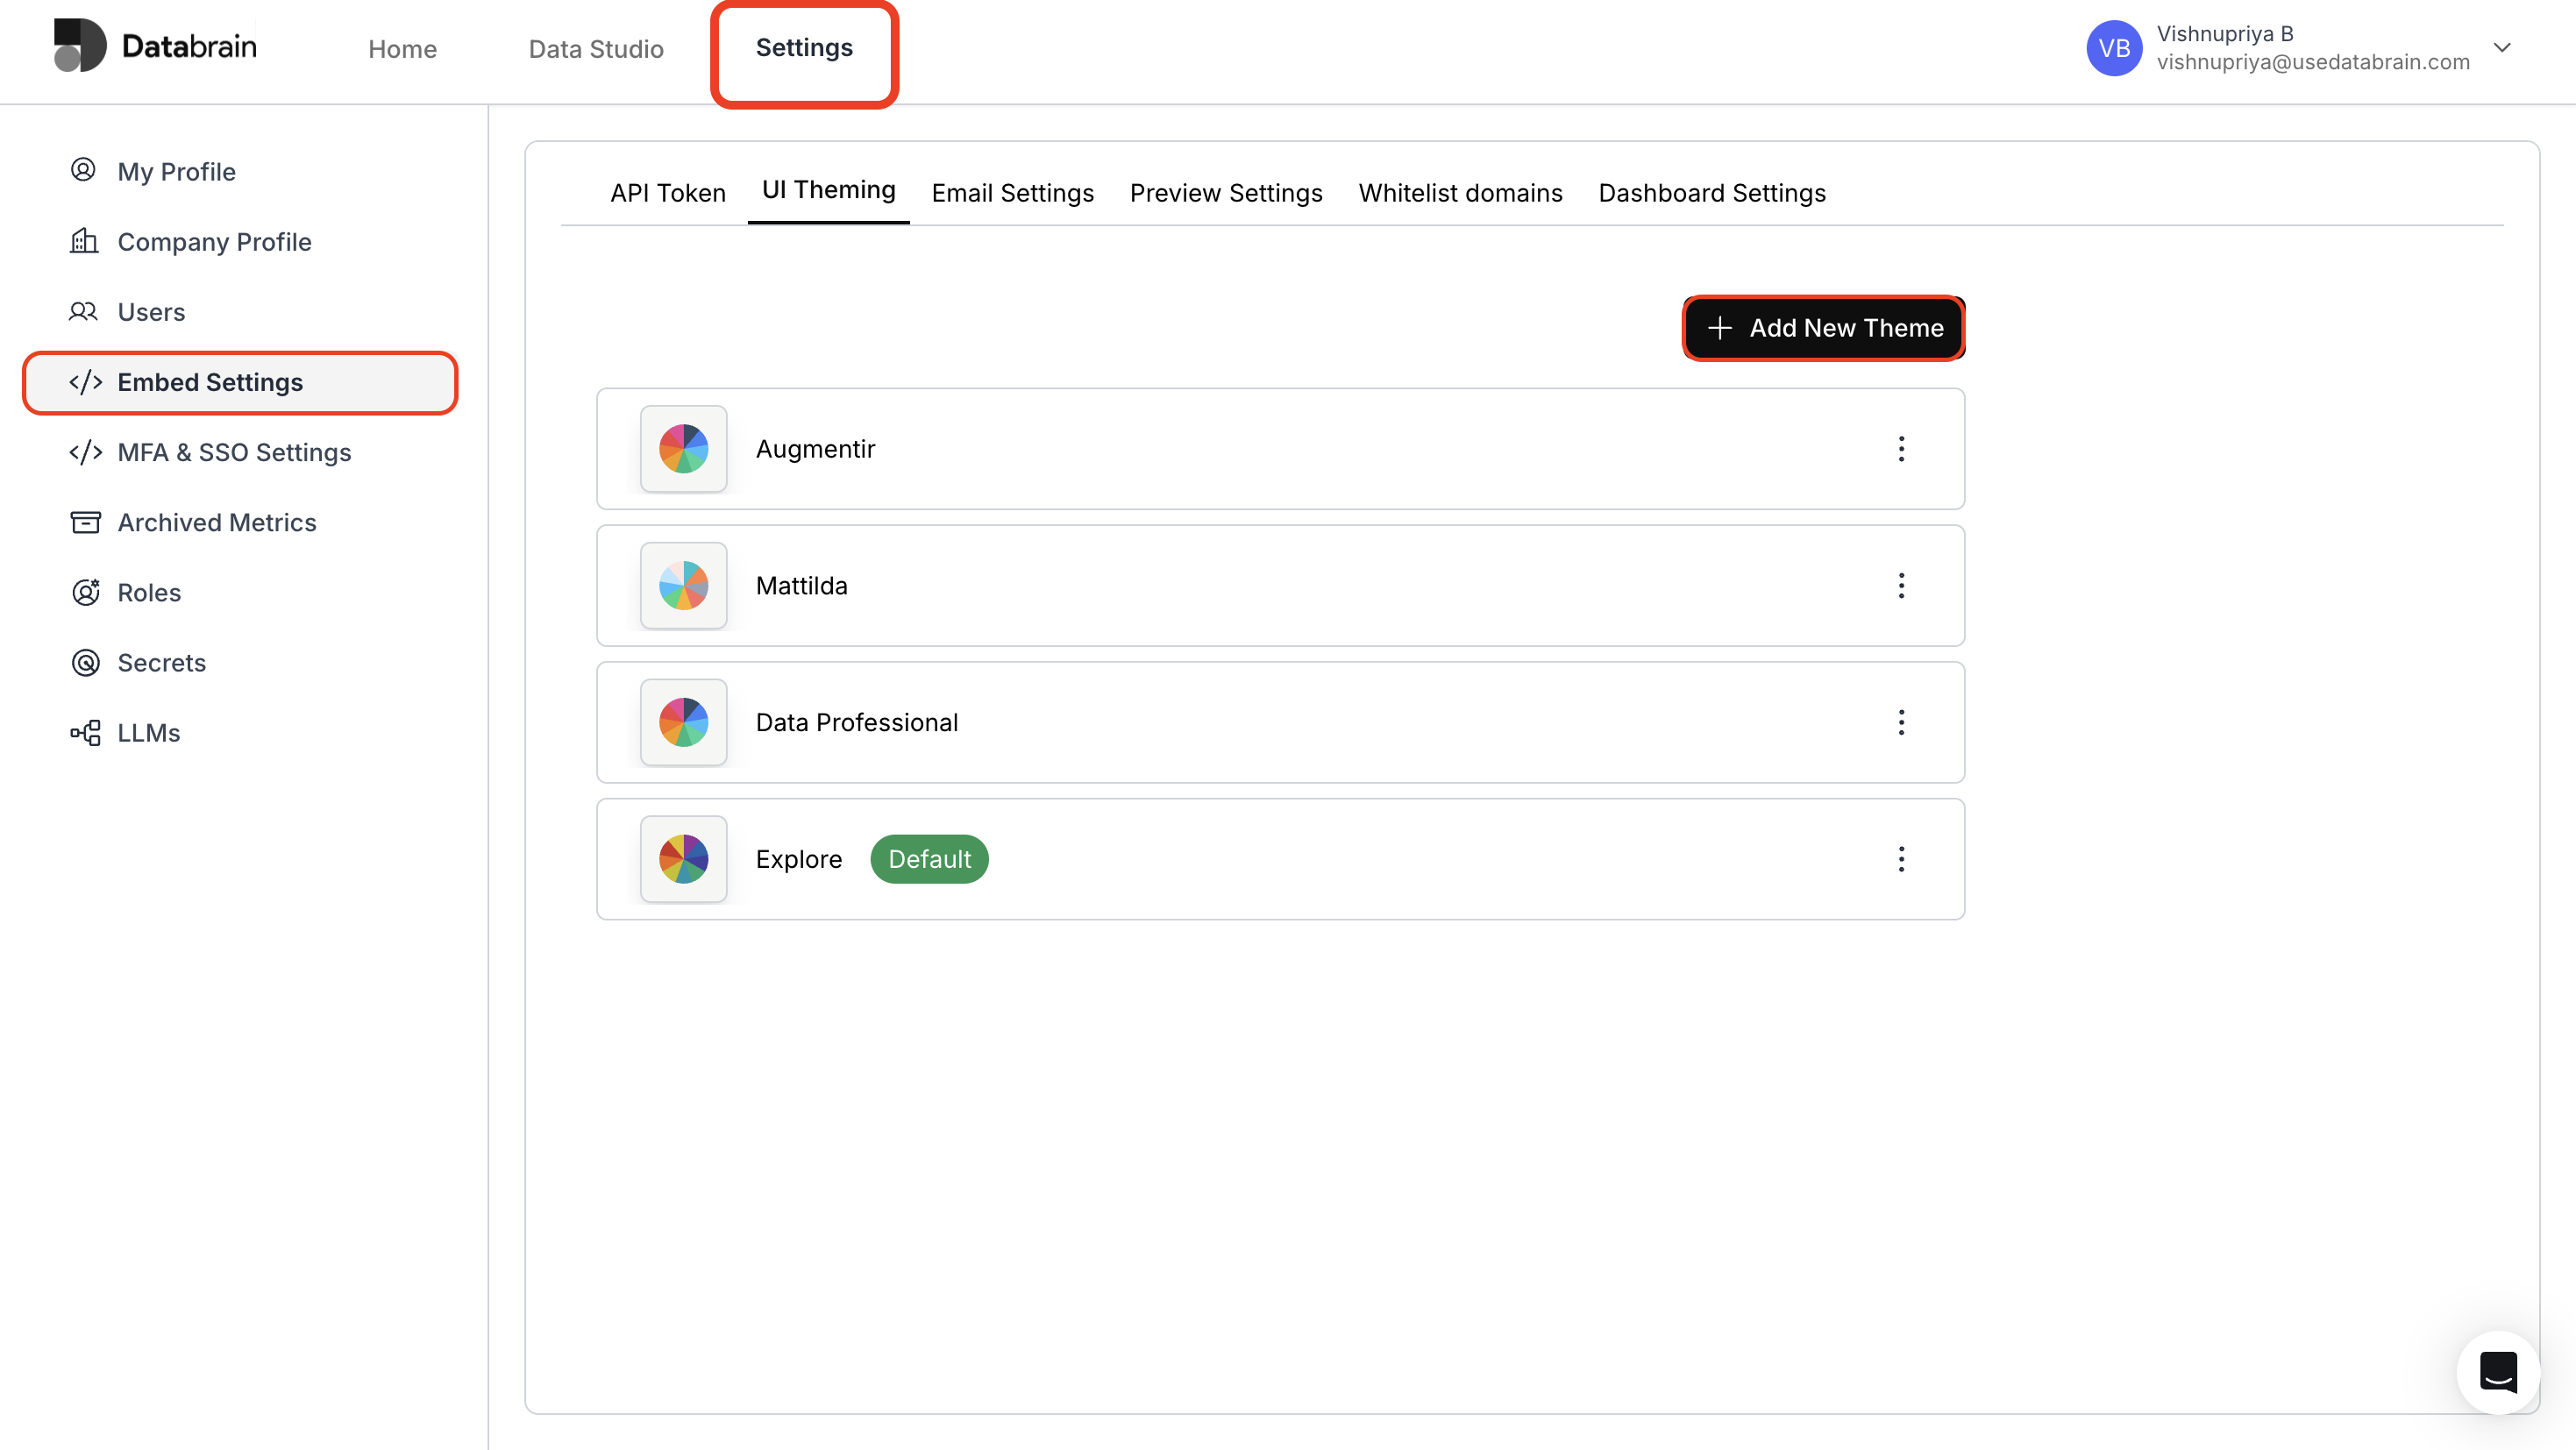
1. **Access UI Theming:**
* Click on the **"Settings"** tab near the Data Studio tab.
* In the **"Embed Settings"** section, select **"UI Theming"** from the settings menu tabs and click on **"+ Add New Theme".**
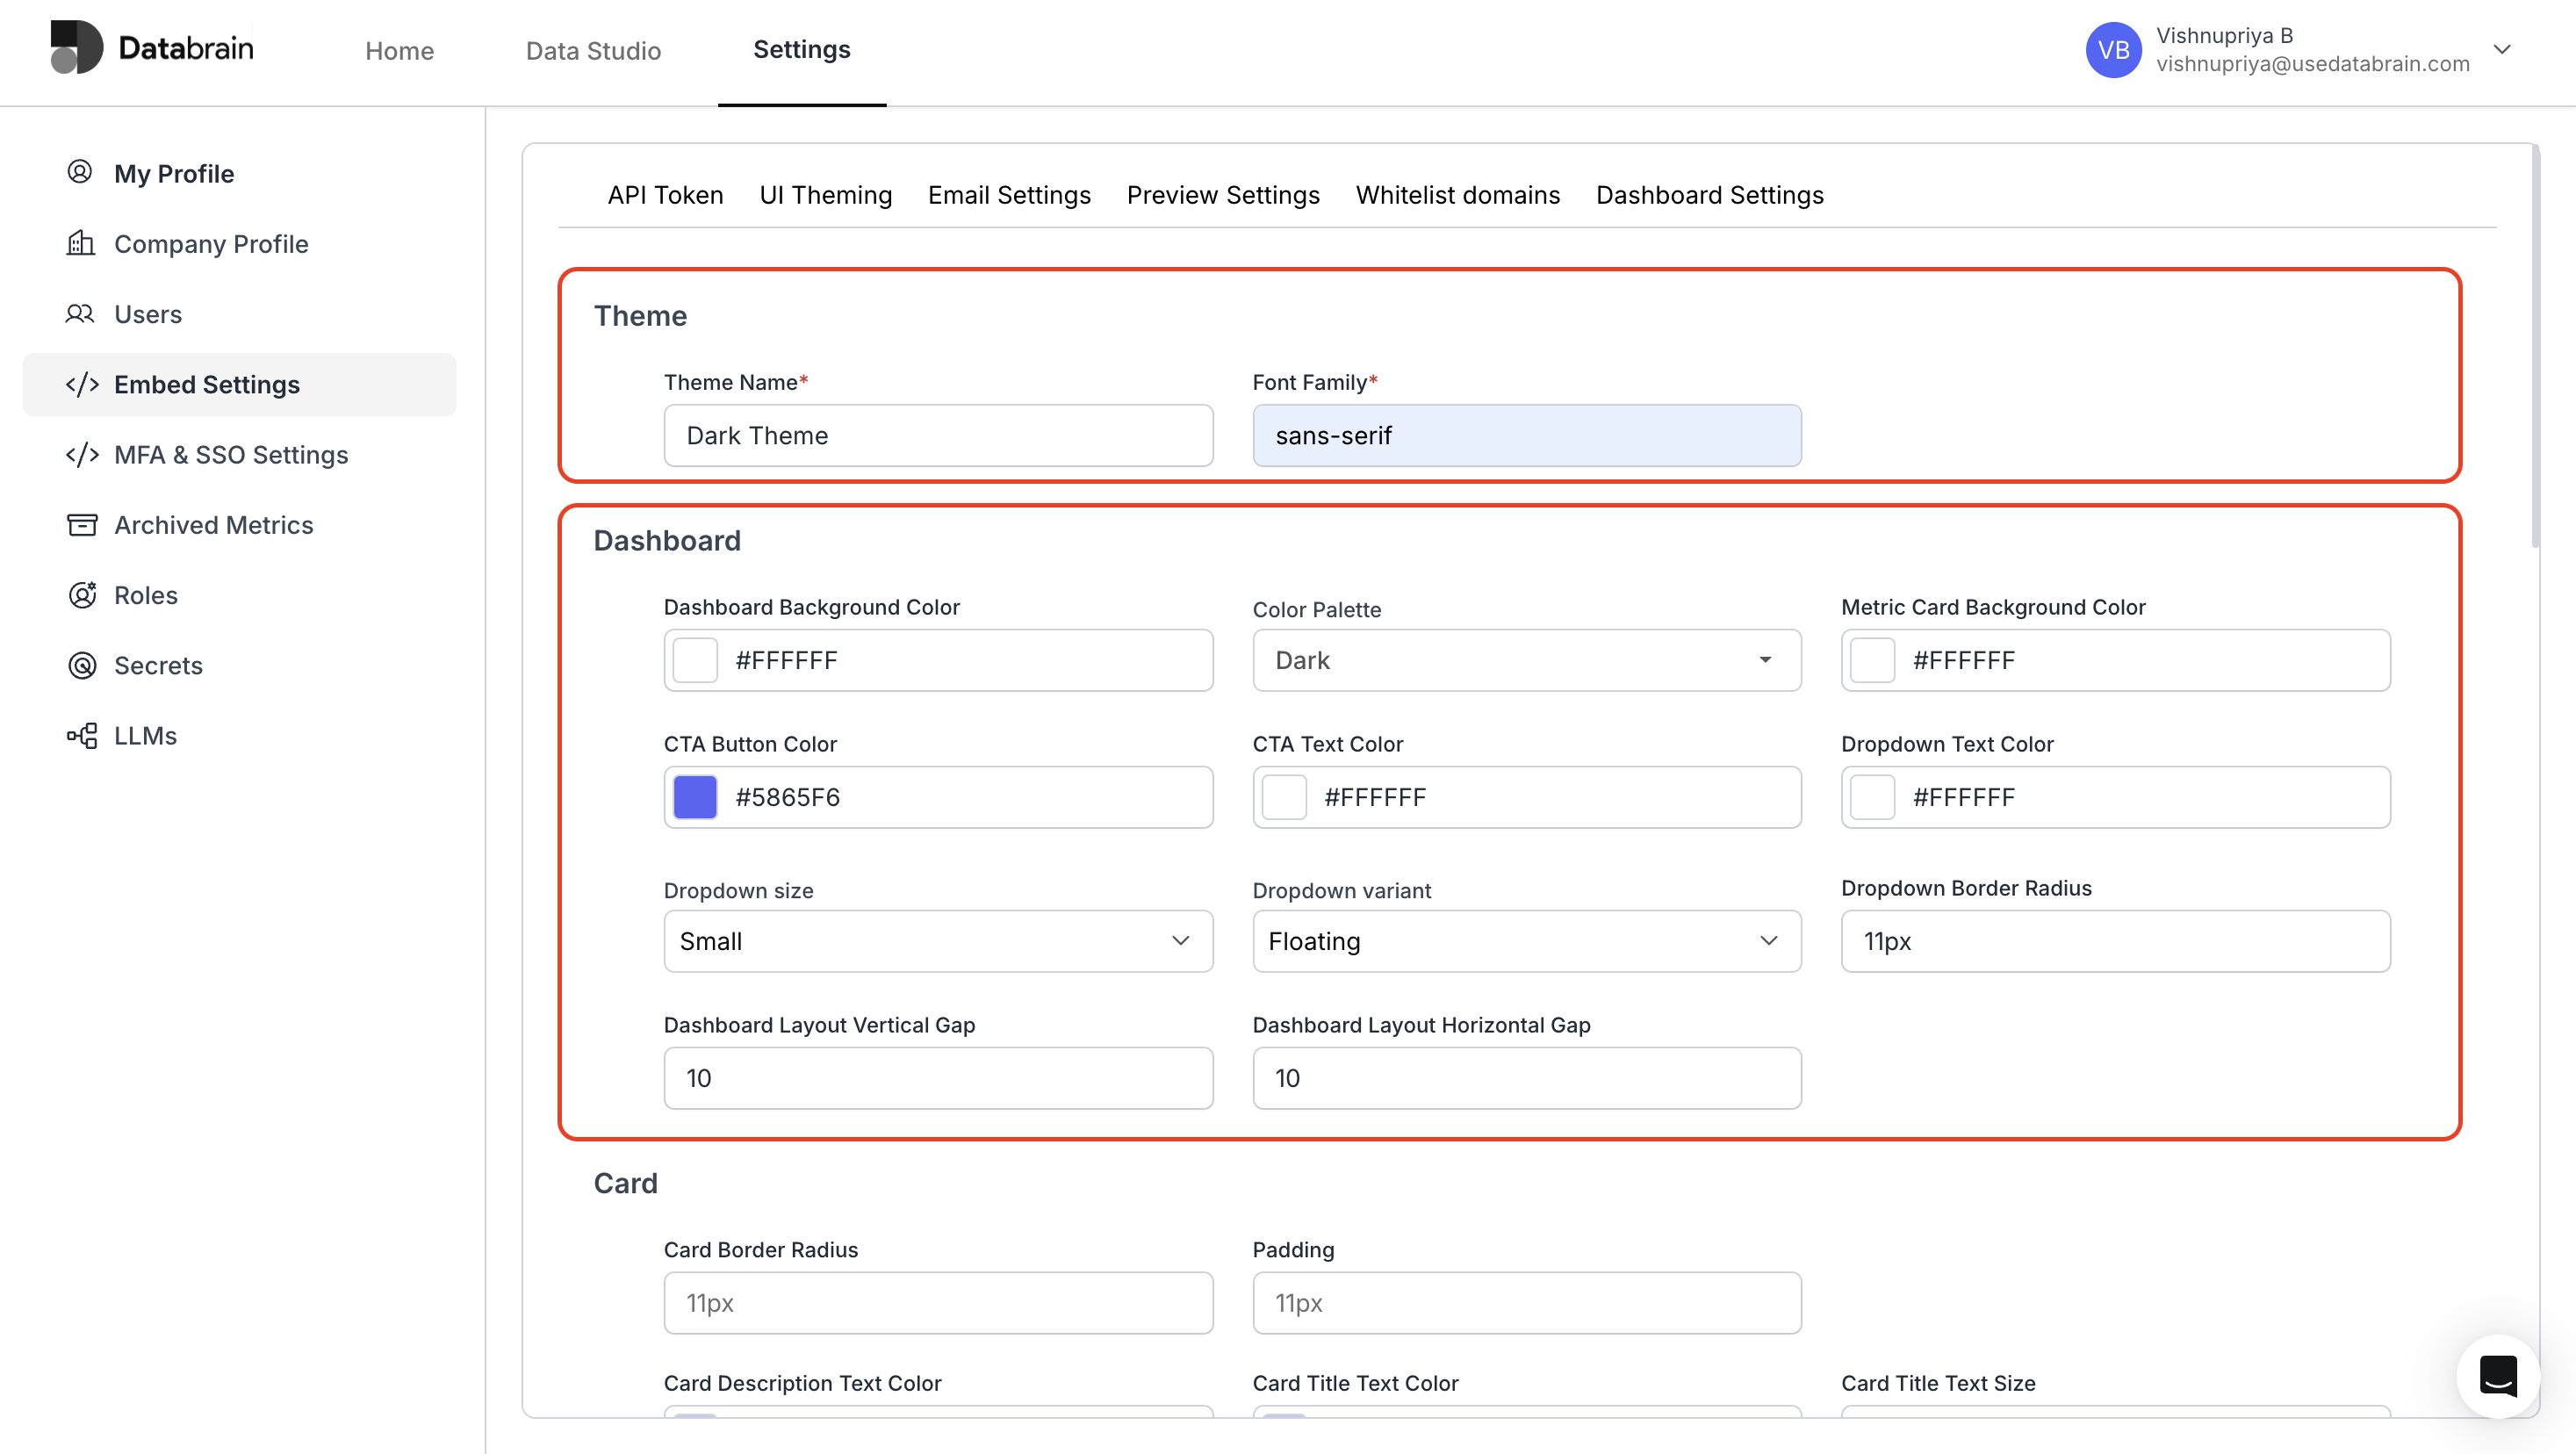
 2. **Configure Basic Theme & Dashboard Settings:**
* Enter Theme Name in text field and set a suitable Font Family.
* Choose your desired dashboard and metric background colors.
2. **Configure Basic Theme & Dashboard Settings:**
* Enter Theme Name in text field and set a suitable Font Family.
* Choose your desired dashboard and metric background colors.
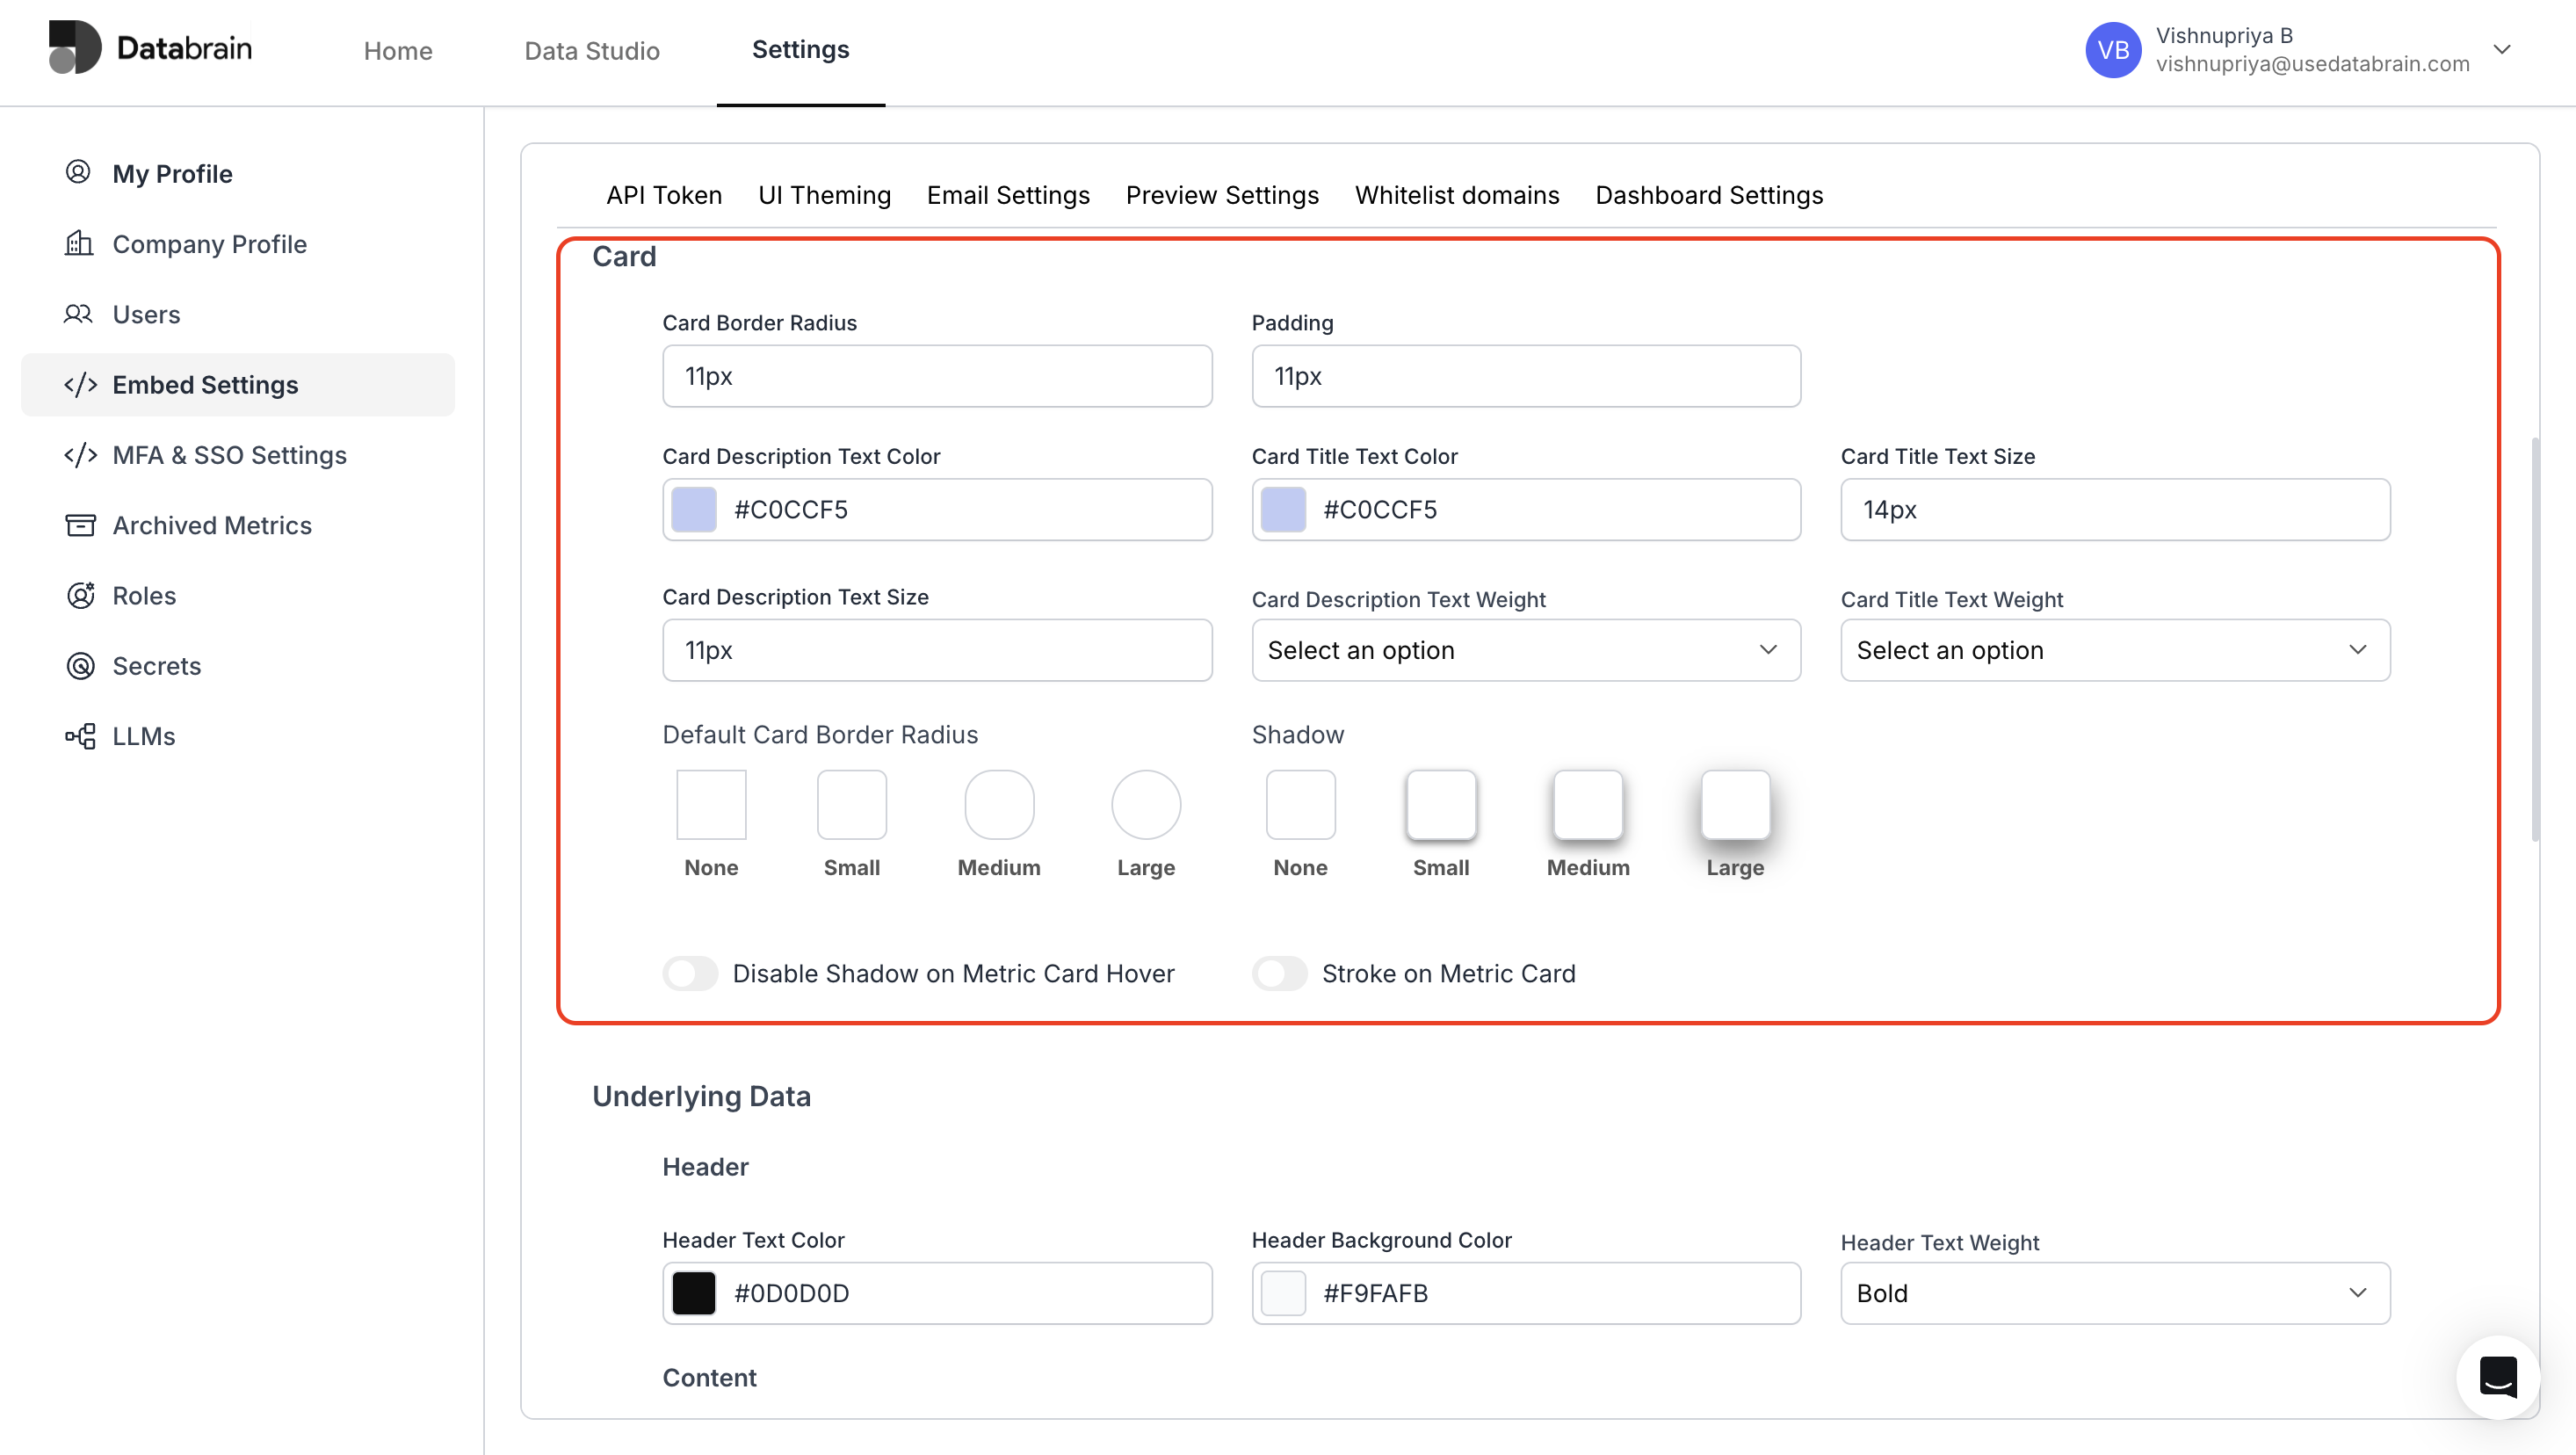
 3. **Configure Card Settings:**
* Enter card border, card description and card title details.
* Choose relevant colors for the card title and card description.
3. **Configure Card Settings:**
* Enter card border, card description and card title details.
* Choose relevant colors for the card title and card description.
 4. **Configure Underlying Data Settings :**
* Choose the Color options for the header and content.
4. **Configure Underlying Data Settings :**
* Choose the Color options for the header and content.
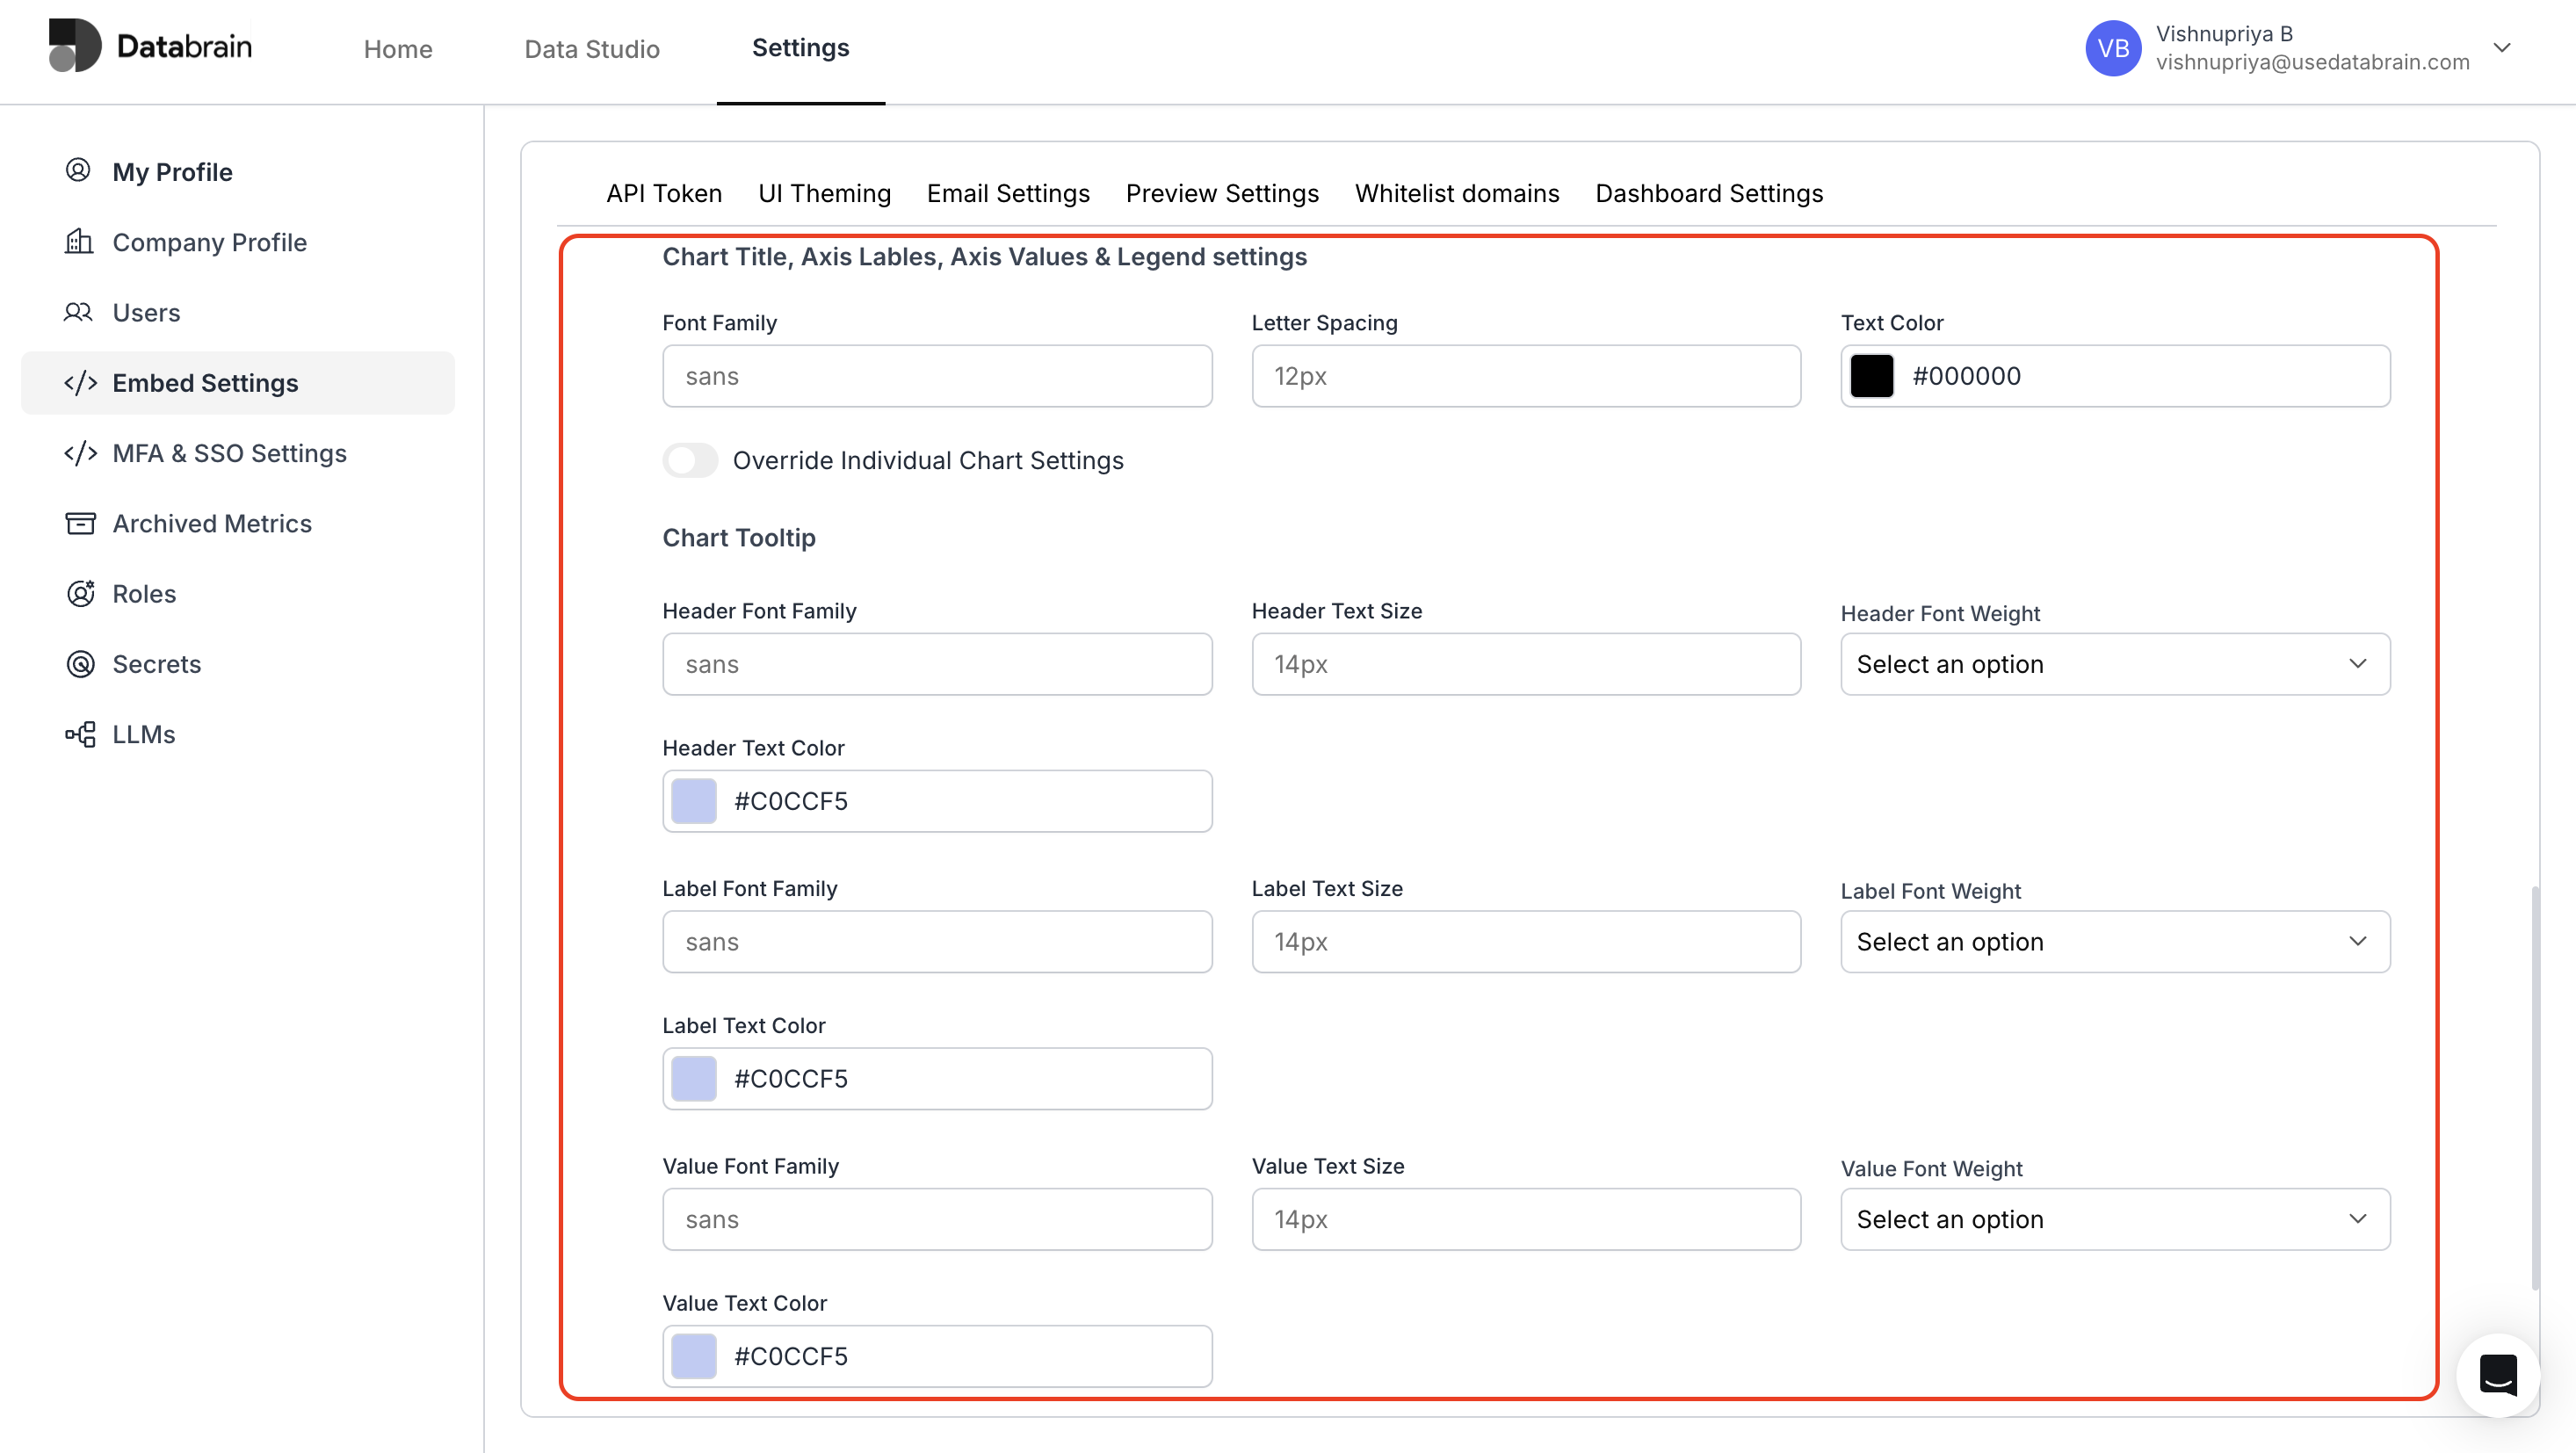
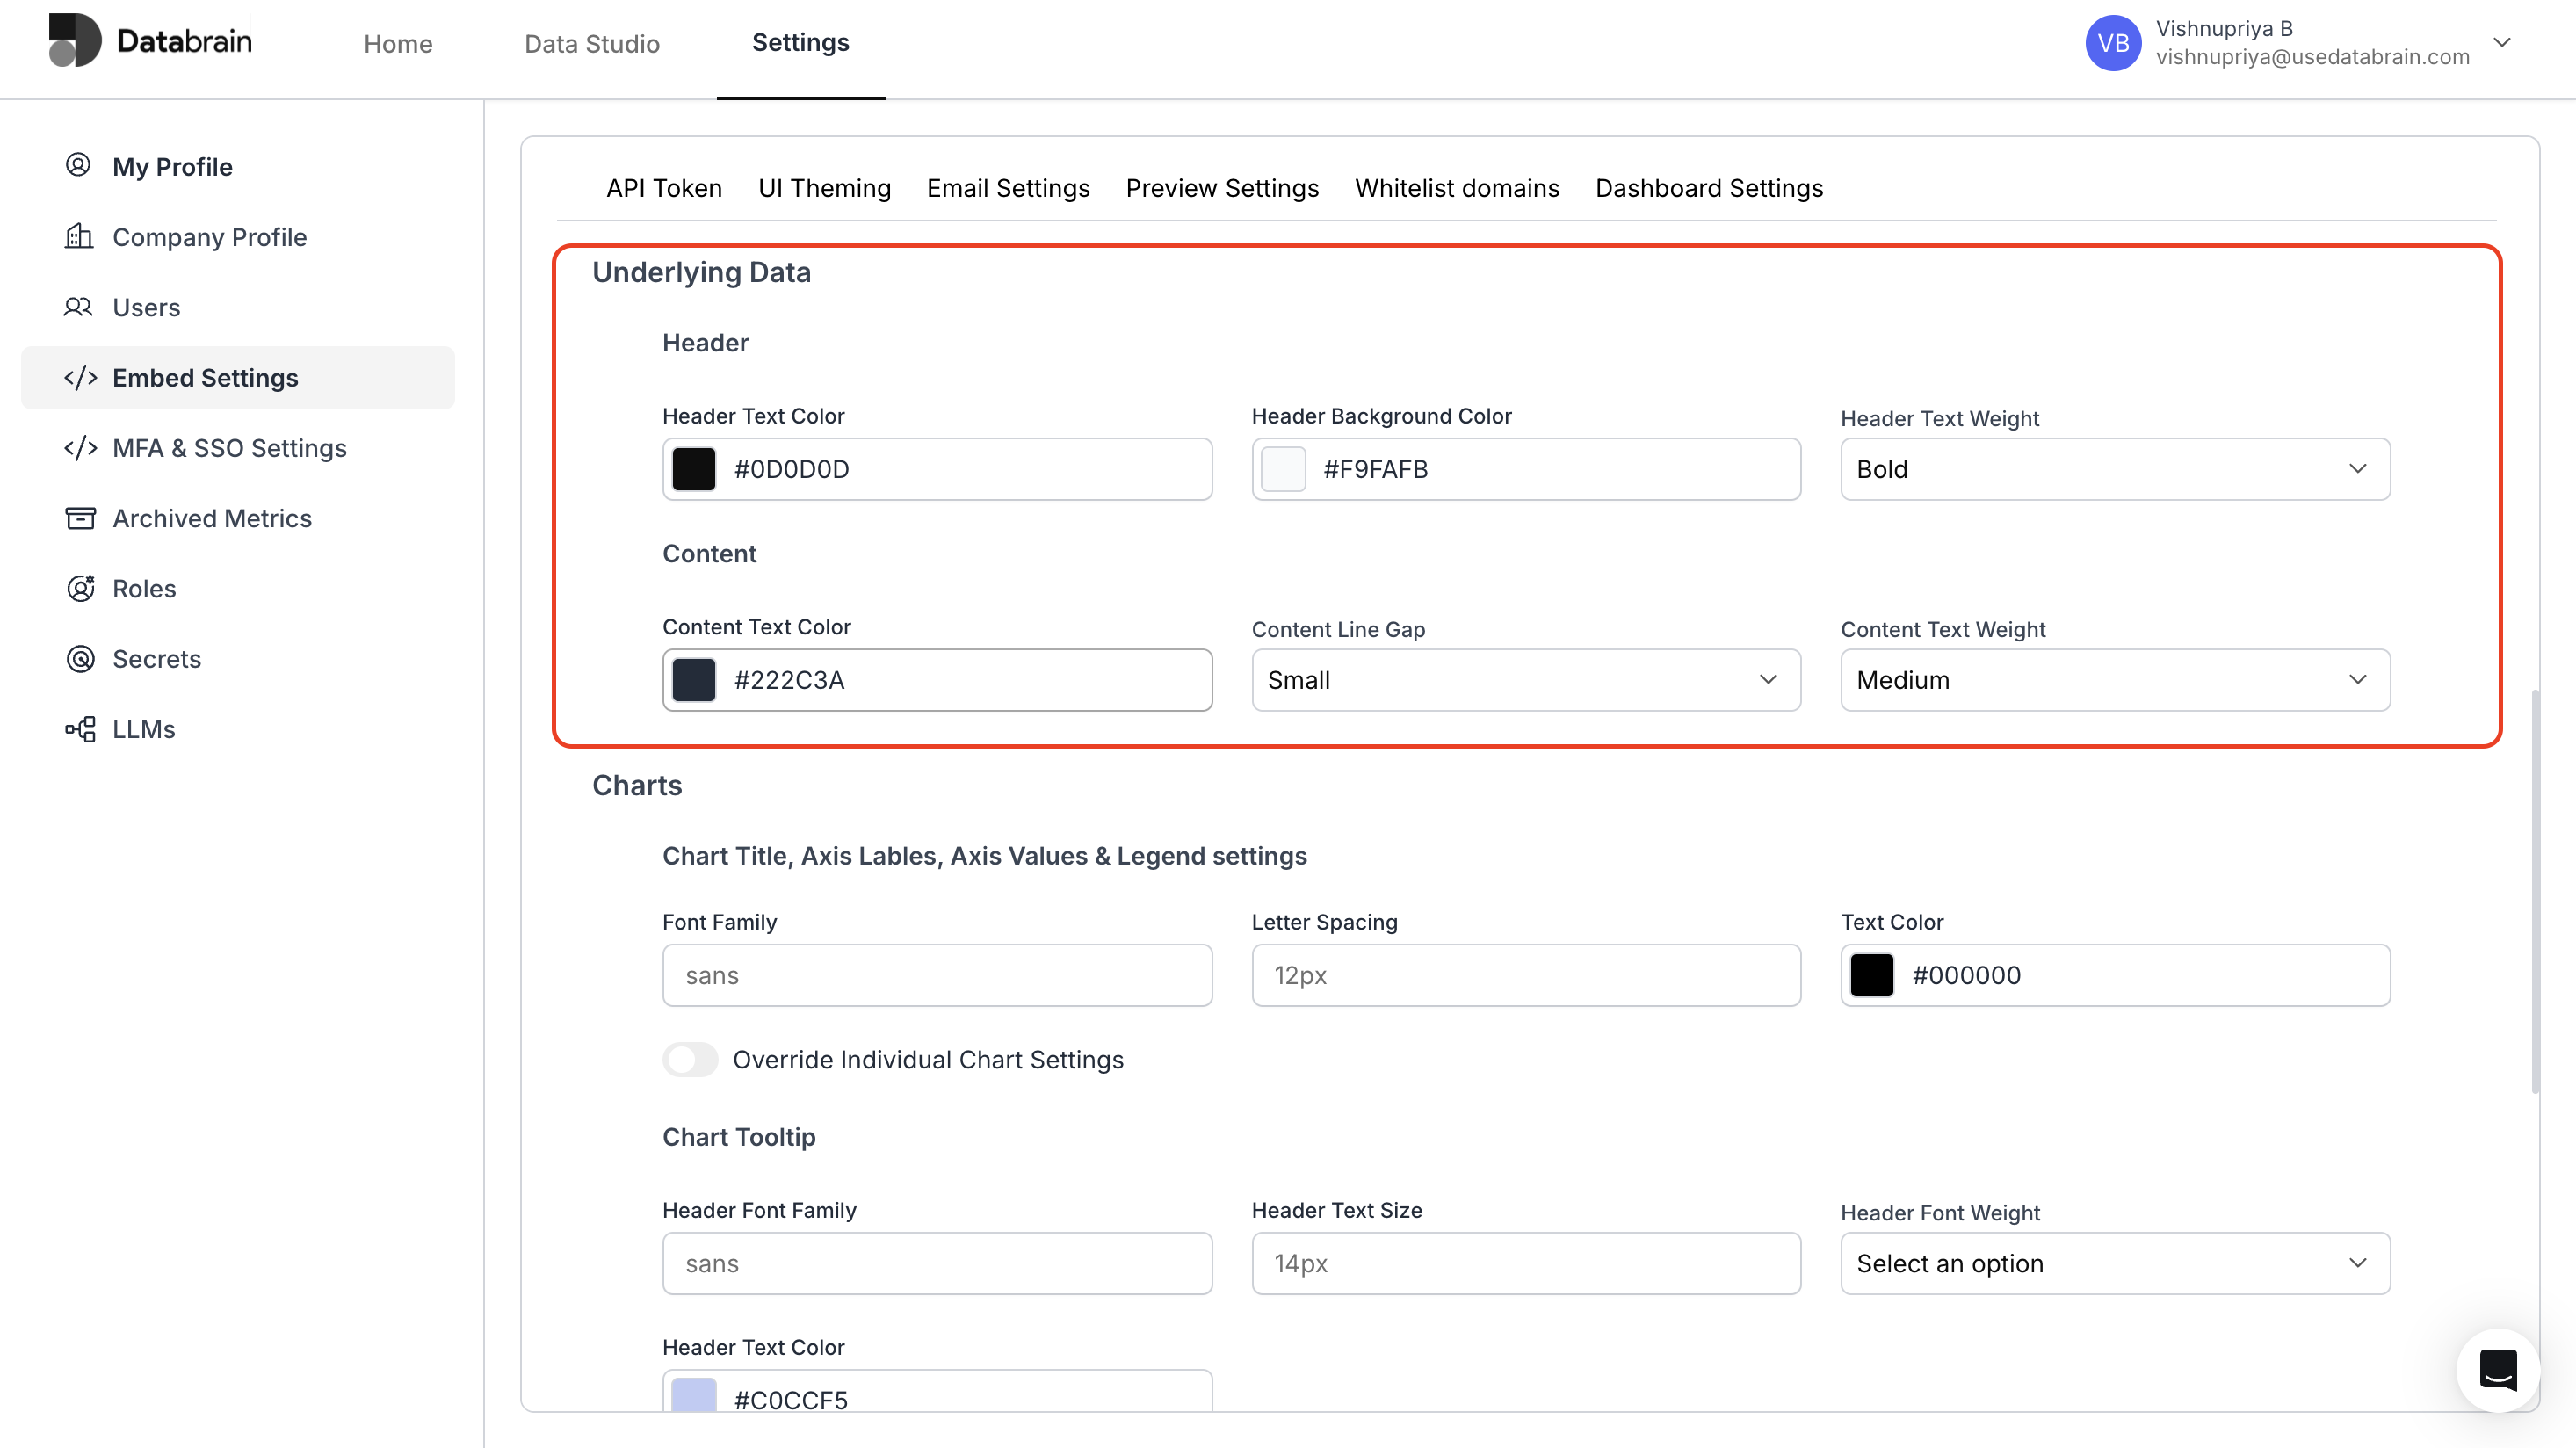 5. **Configure Chart Settings :**
* Enter the Font family and choose the color for the Chart title.
* Choose the Font and colour options for Chart tooltip.
5. **Configure Chart Settings :**
* Enter the Font family and choose the color for the Chart title.
* Choose the Font and colour options for Chart tooltip.
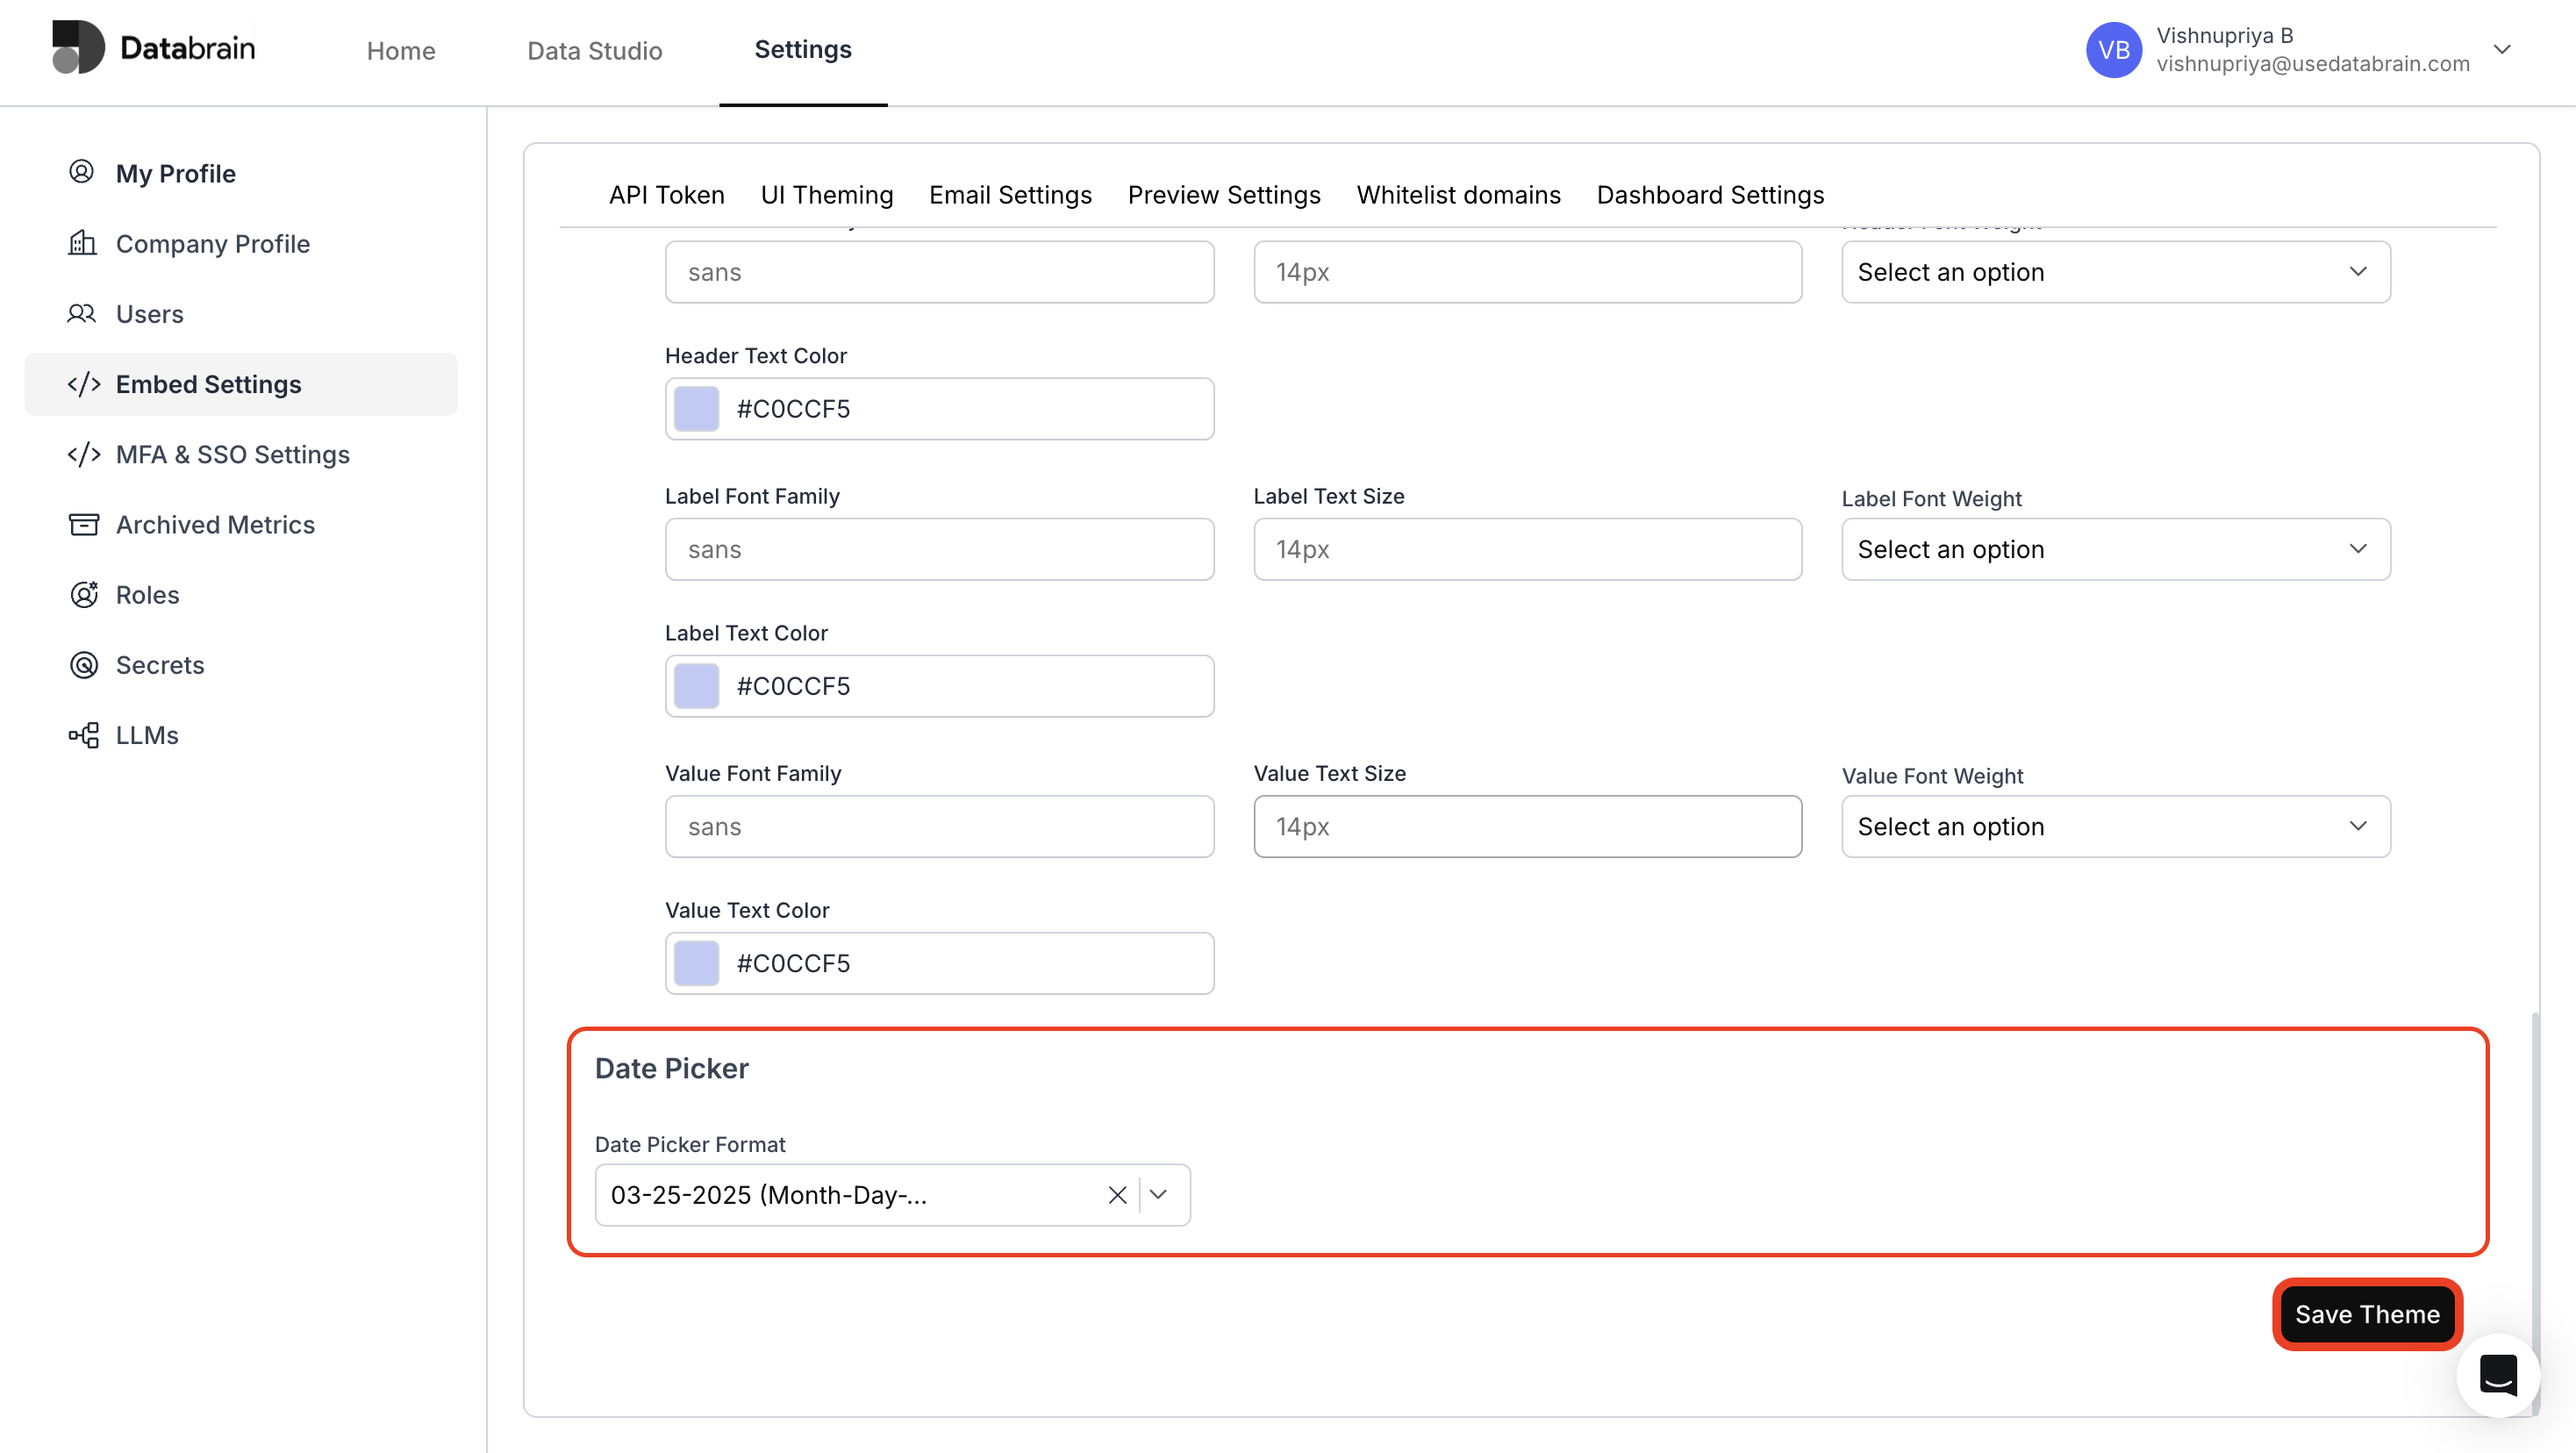
 6. **Configure Date Picker :**
* Choose the Date format from the dropdown options.
* Finally, click **"Save Theme"** to save your created theme.
6. **Configure Date Picker :**
* Choose the Date format from the dropdown options.
* Finally, click **"Save Theme"** to save your created theme.
 7. **View your created theme in the UI Theming page**
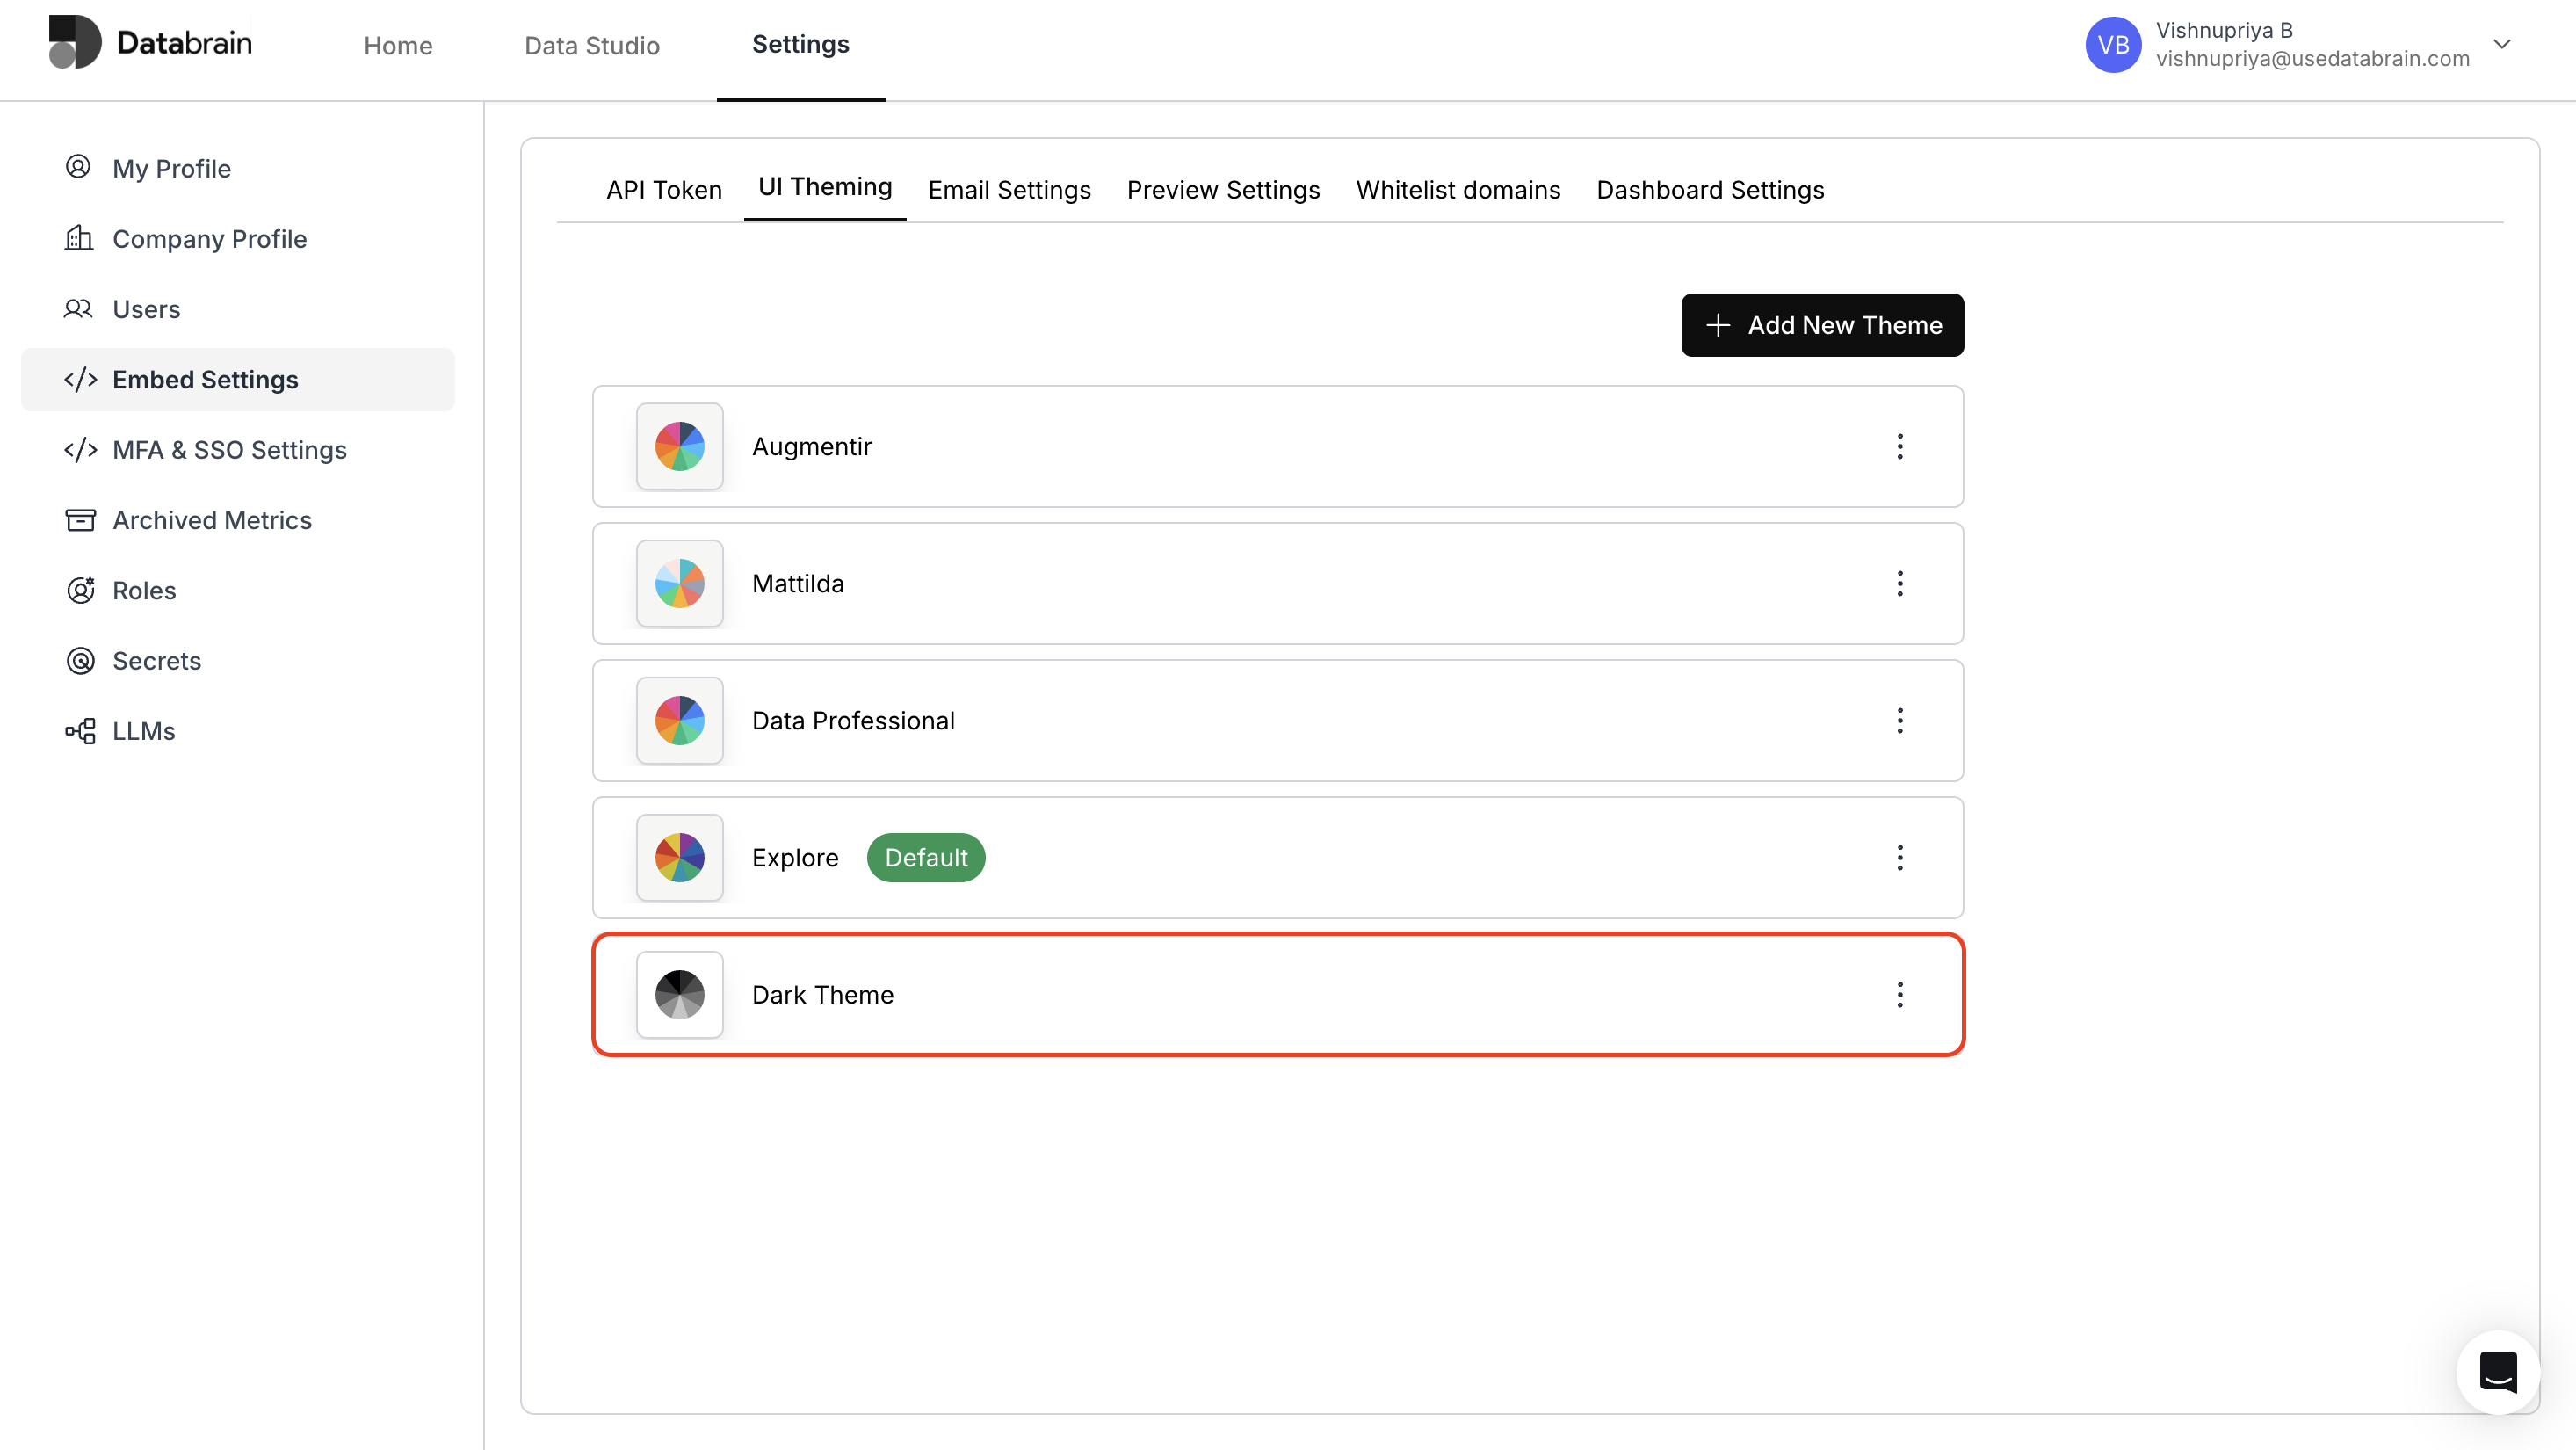 You have succesfully created your Dashboard theme in Databrain !