> ## Documentation Index
> Fetch the complete documentation index at: https://docs.usedatabrain.com/llms.txt
> Use this file to discover all available pages before exploring further.
# Chart Click Action with metric
> This guide offers a straightforward approach to enhancing your data visualization experience by enabling and configuring chart click actions with metrics.
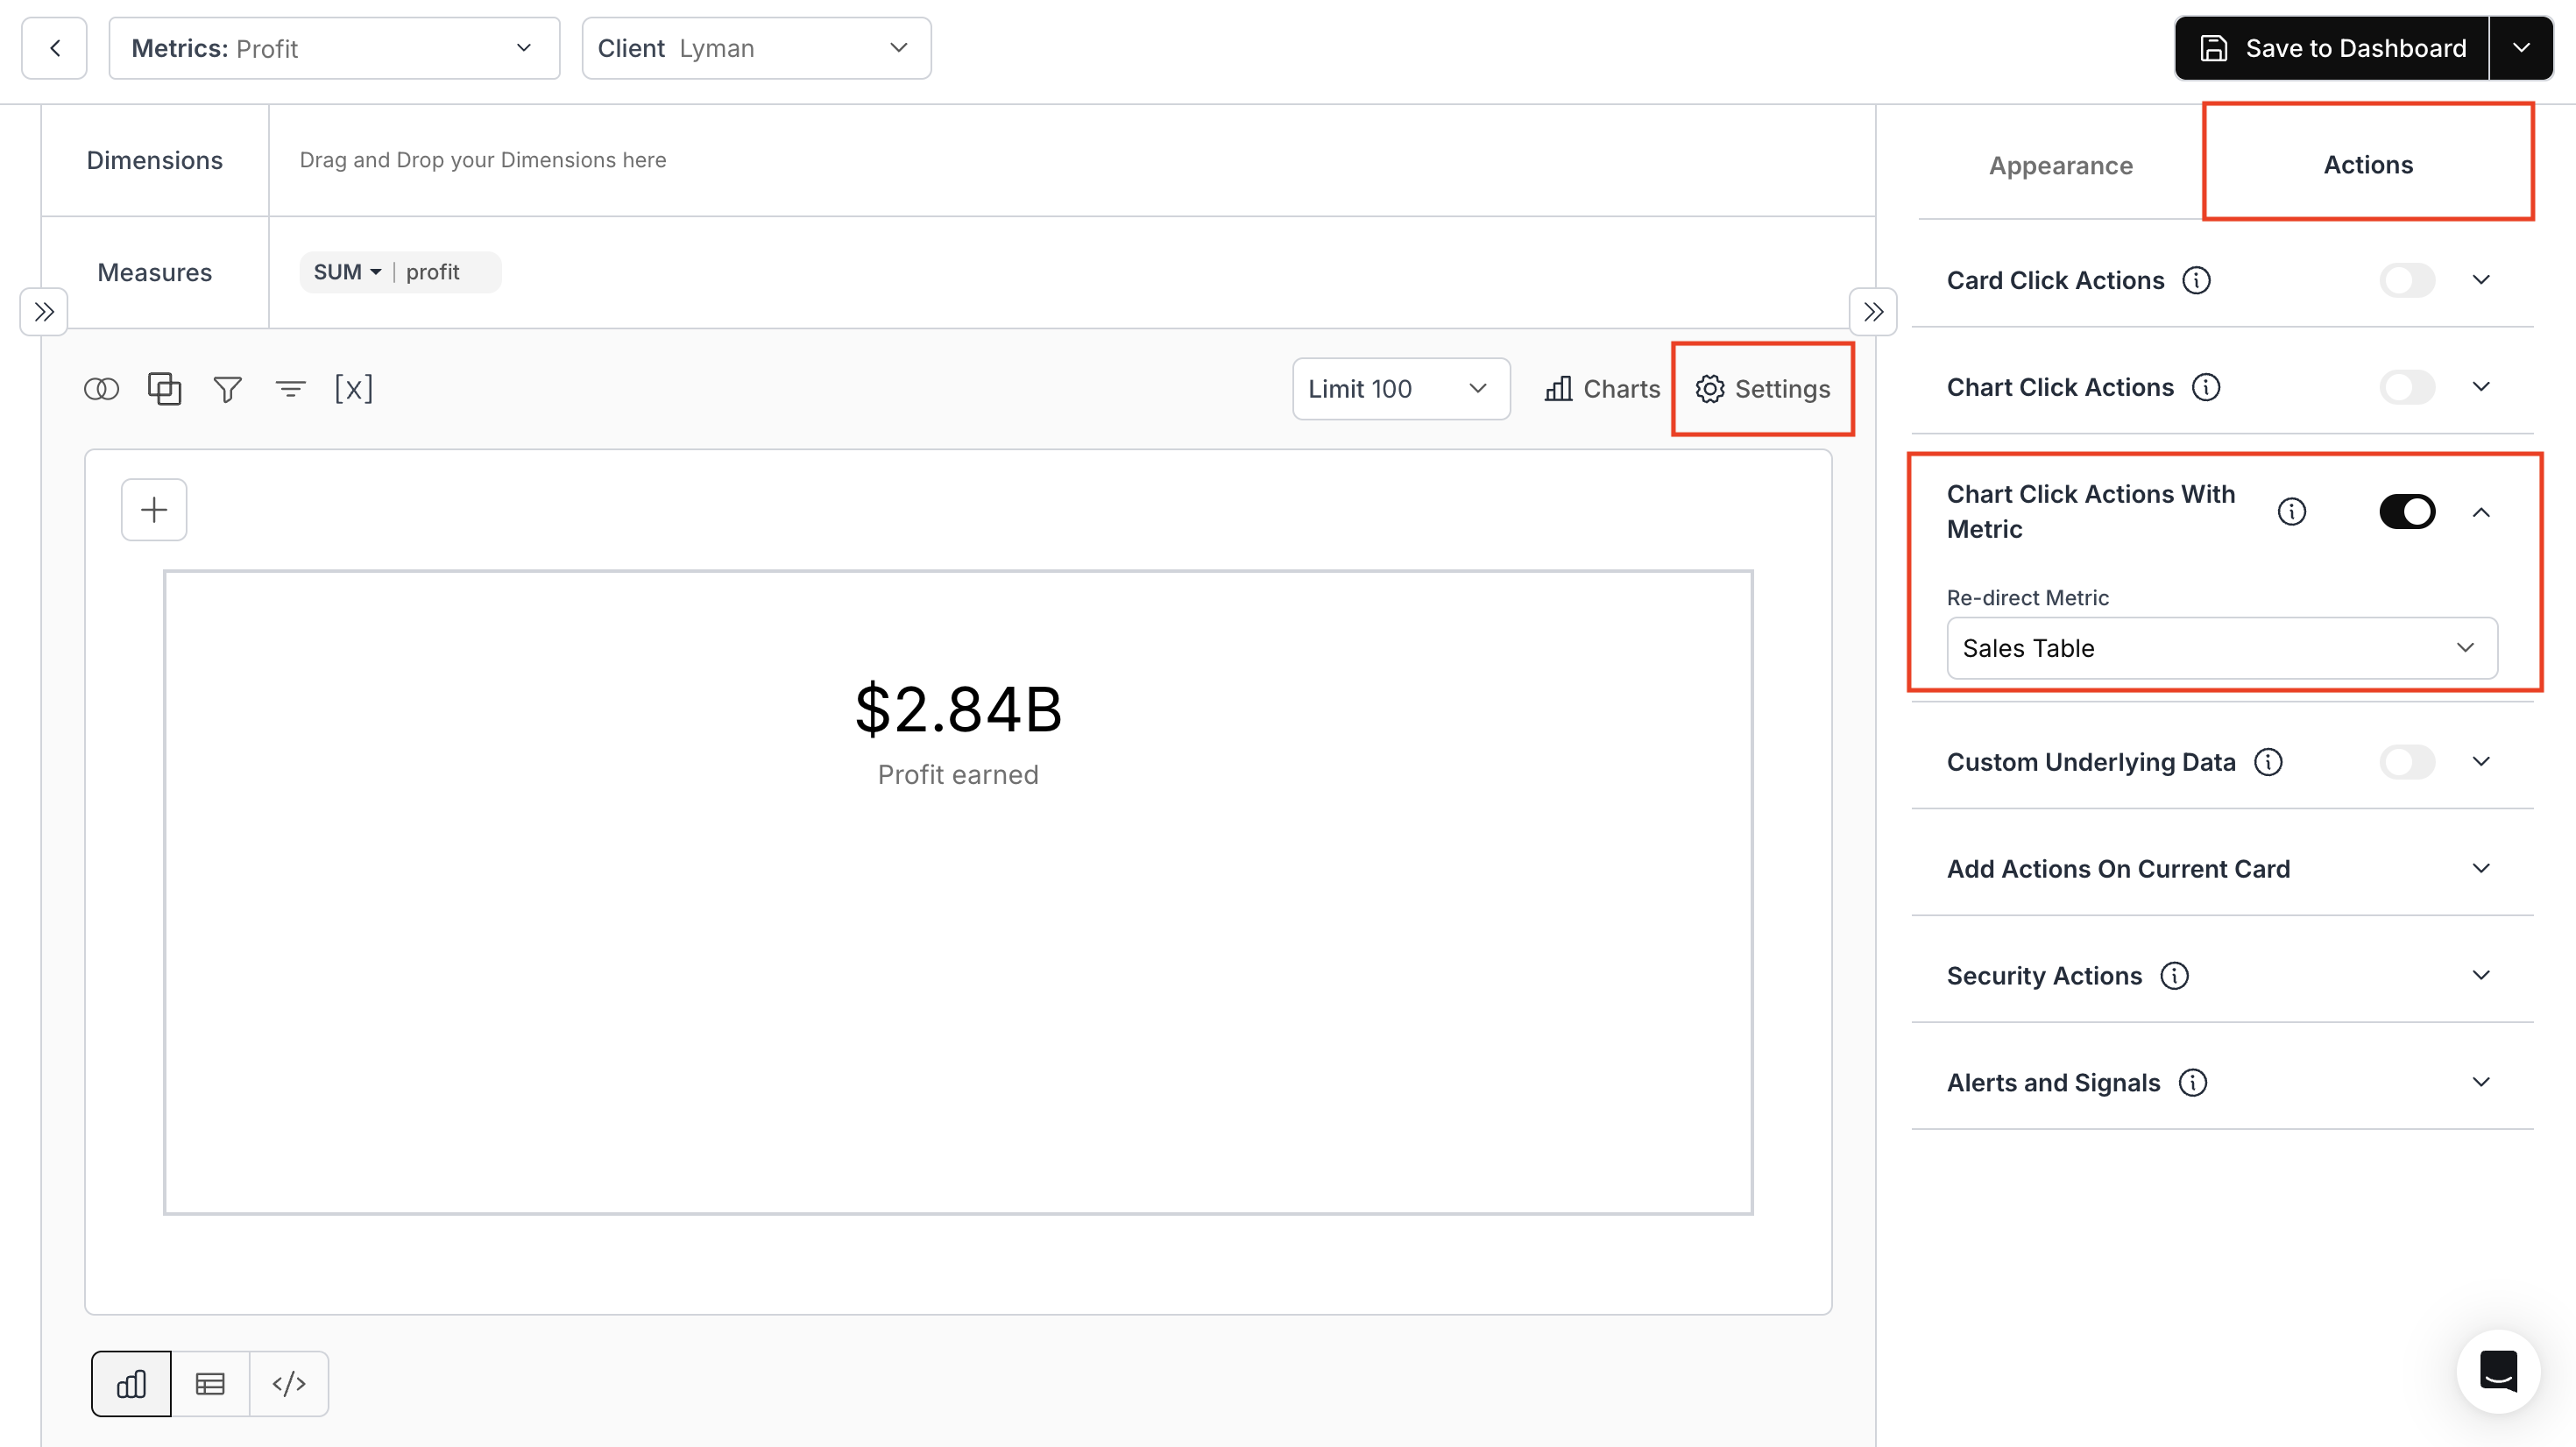
### 1. **Enable & Configure Chart Click Actions with Metric**
* Click on the **Settings** icon and navigate to the **Actions** section.
* Then, toggle on the **Chart Click Actions with Metric** option.
* Select the metric you want to drill down into from the current metric and save the metric to your dashboard.
 ### 2. **Save Metric to Dashbaord**
 ### 3. **View the Drill-Down Action**
Once configured, clicking on a chart will drill down into the selected metric, displaying a more detailed view.
### 3. **View the Drill-Down Action**
Once configured, clicking on a chart will drill down into the selected metric, displaying a more detailed view.
 You’ve successfully enabled Chart Click Action with Metric!\
Your charts can now drill directly into deeper insights, creating a seamless and interactive analytical flow.
You’ve successfully enabled Chart Click Action with Metric!\
Your charts can now drill directly into deeper insights, creating a seamless and interactive analytical flow.