July 7, 2026 Updates
July 7, 2026 Updates
Features:
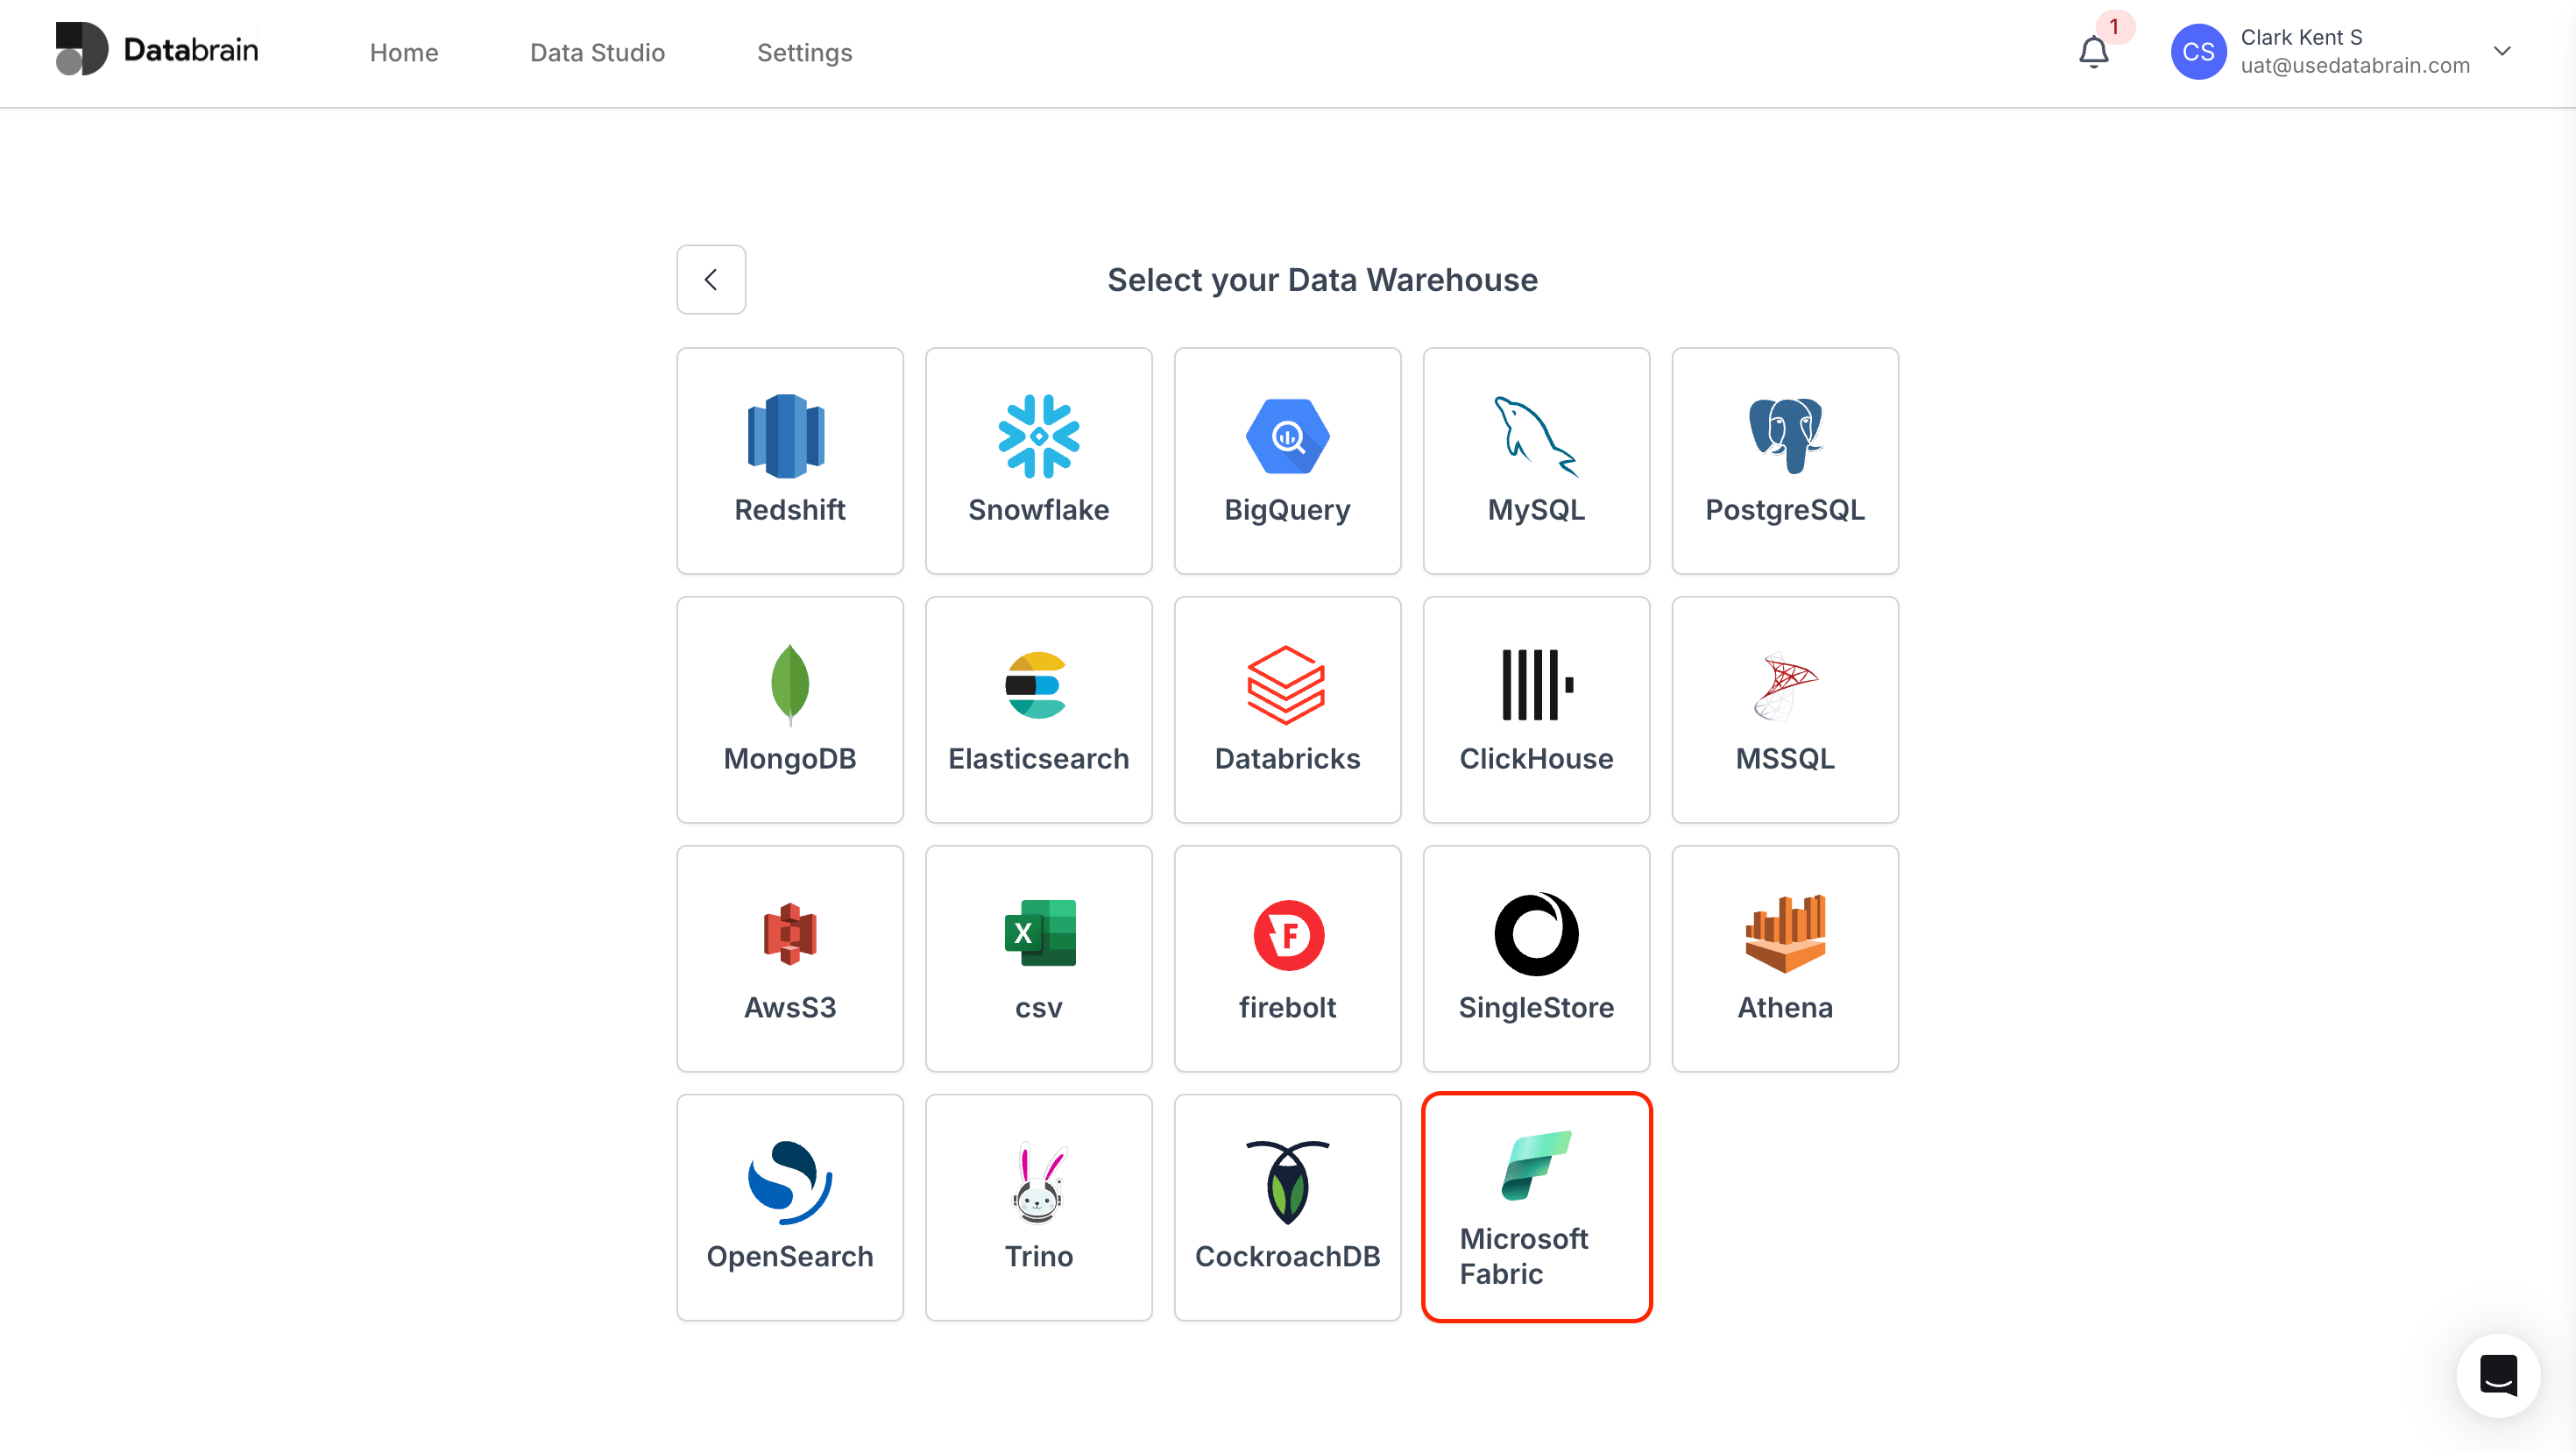
- Microsoft Fabric Data Source:
Added support for Microsoft Fabric as a new data source.
- Multi-Dimension Support for End Users:
End users can now create metrics using multiple dimensions.
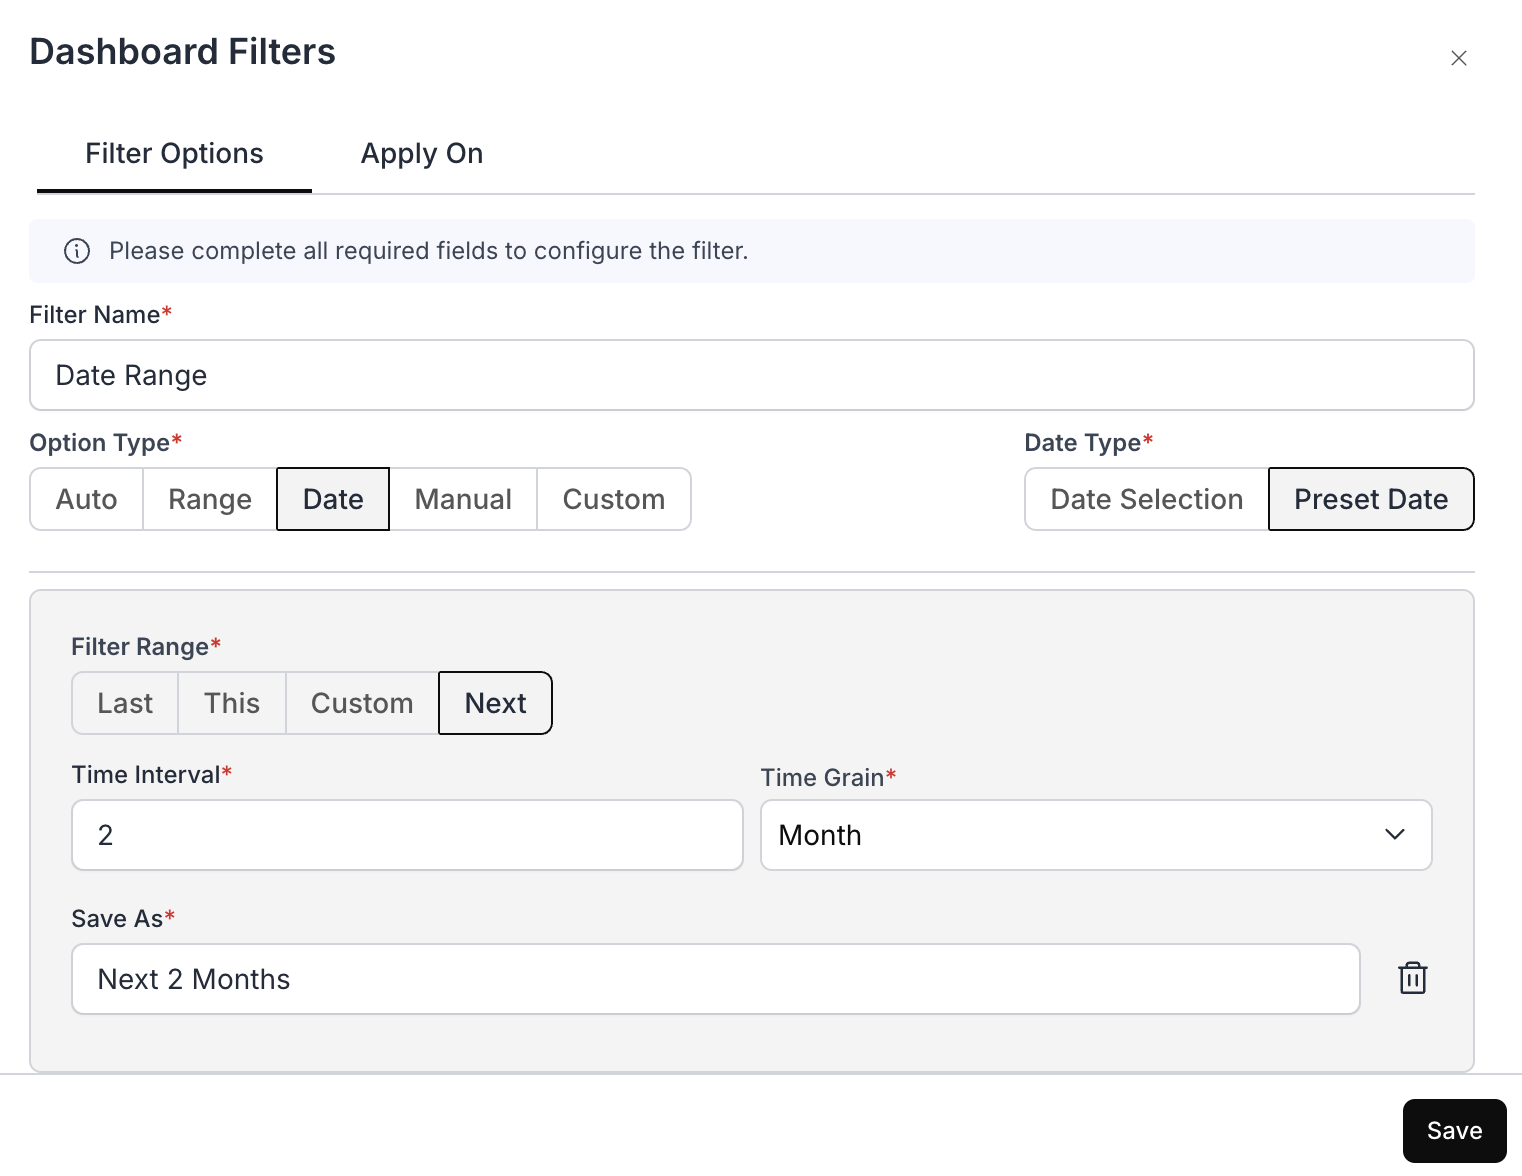
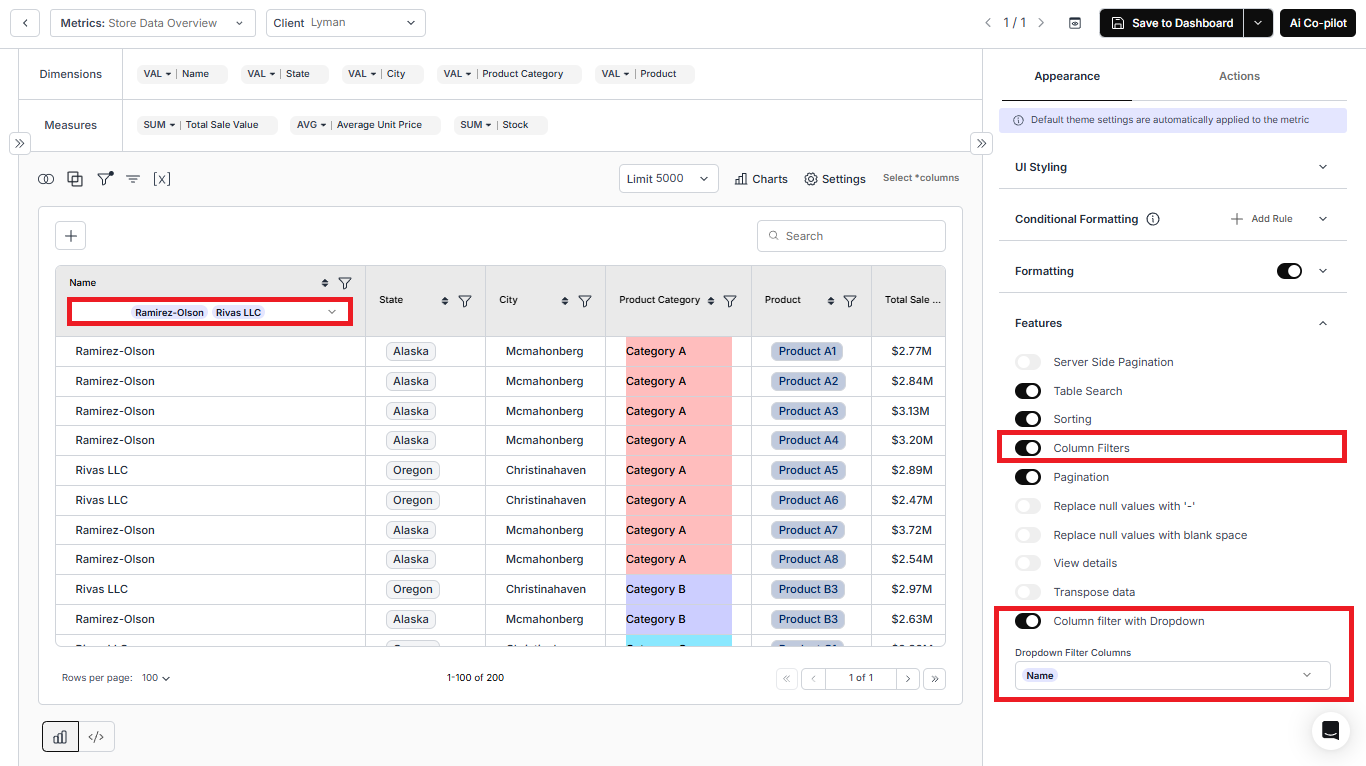
- Dashboard Filters for End Users:
End users can now create dashboard filters from client-specified columns. The below guest token request body enables end-user dashboard filter creation:
dashboardFilterColumns setting ensures end users can create filters only on approved columns.Enhancements:
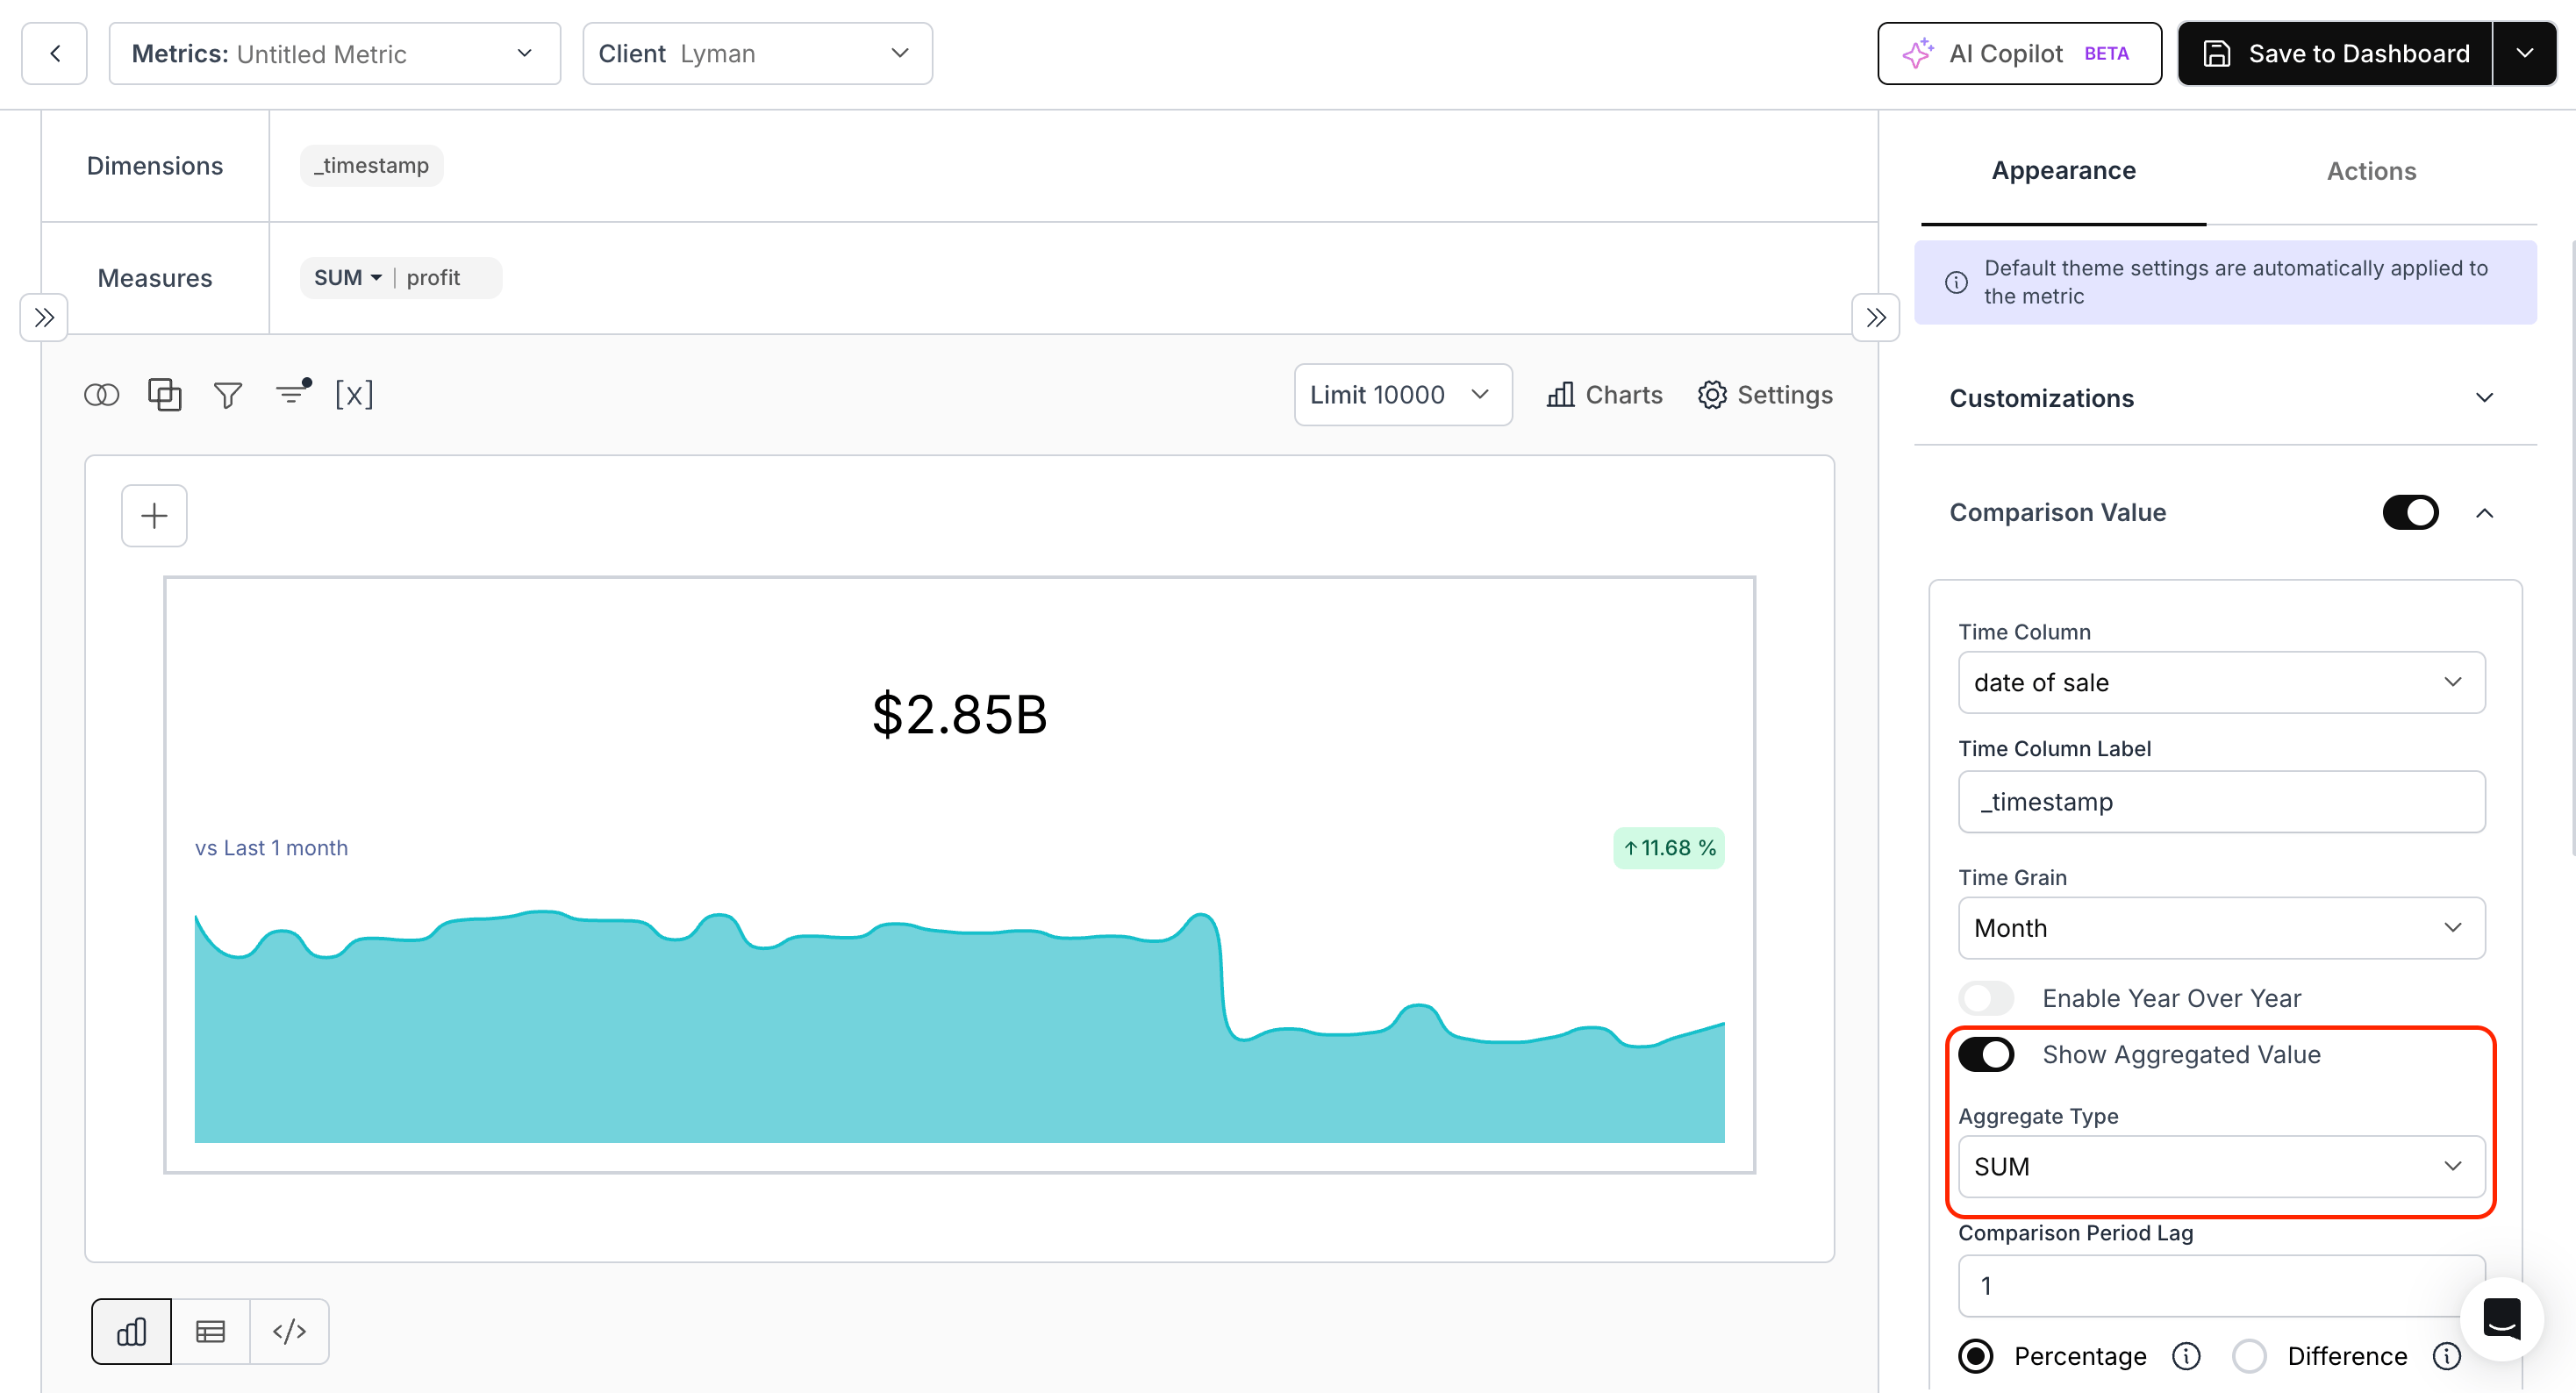
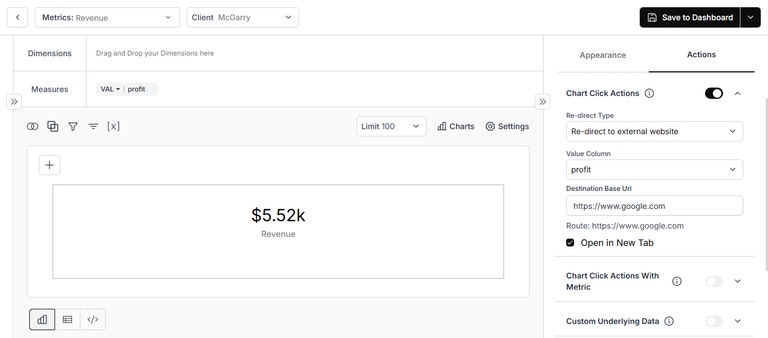
- Single Value Card Enhancement:
Added support for comparison values in the Single Value Card, along with a Show Aggregated Value toggle to display the aggregated value instead of the current period value.
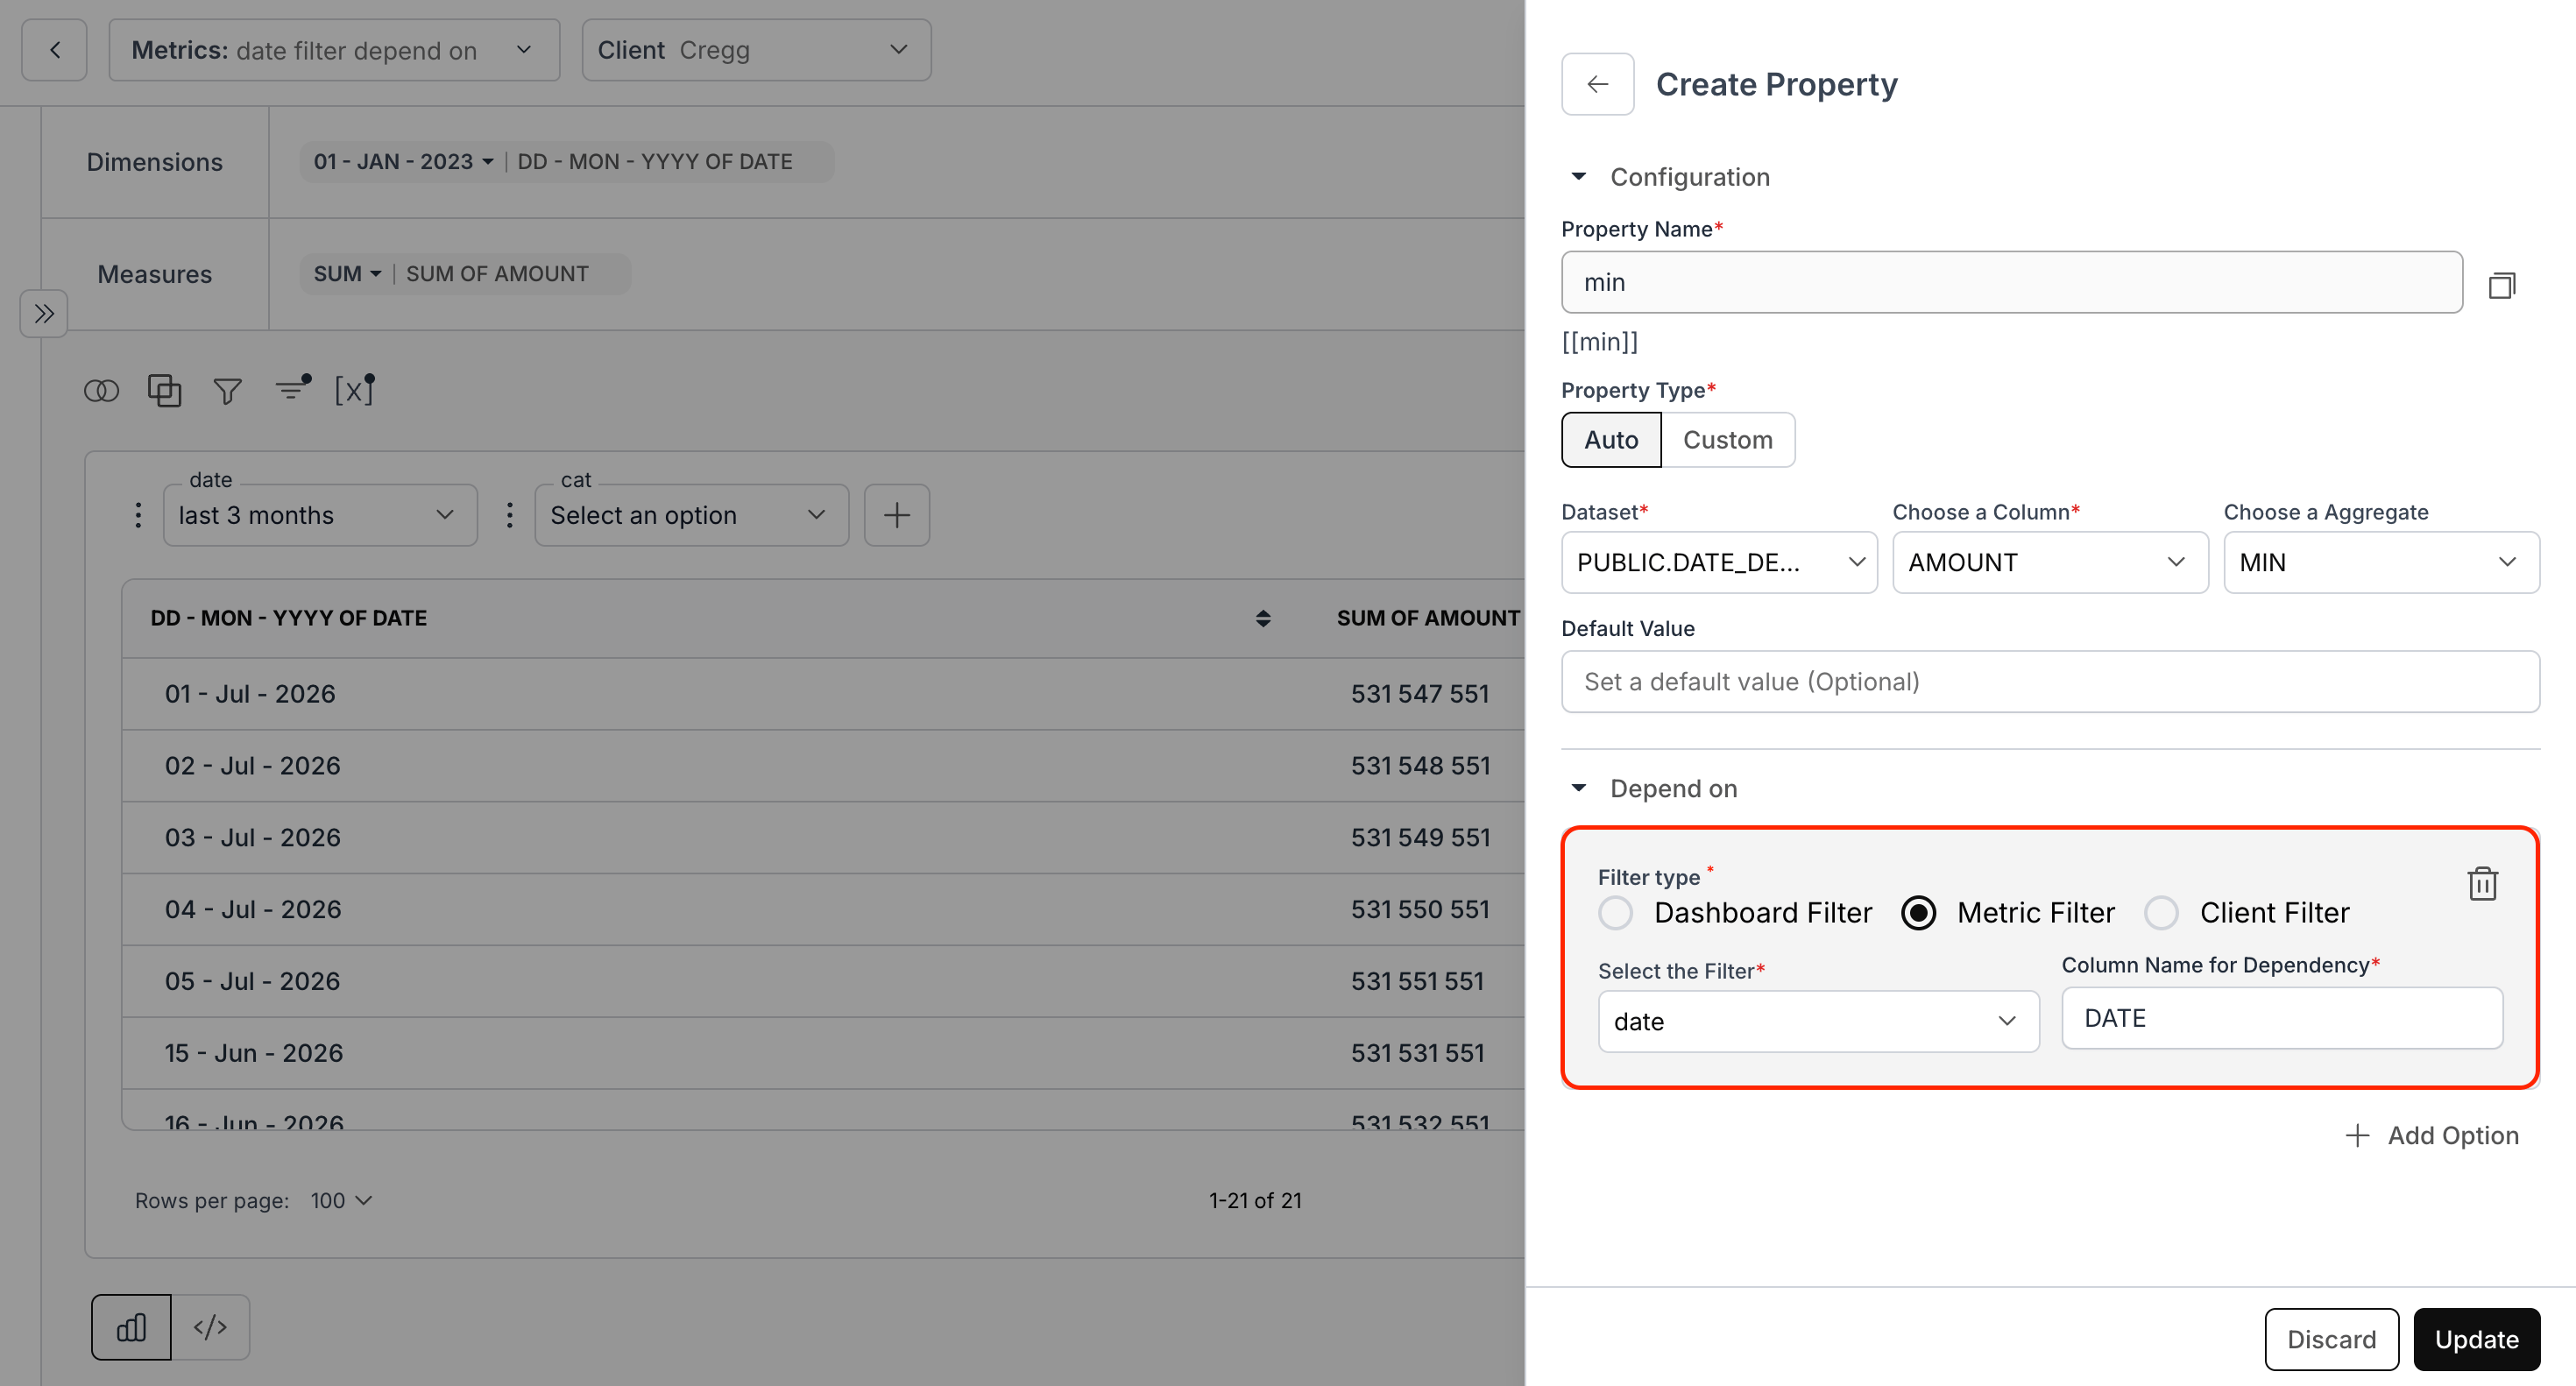
- Date Filter Dependency Support:
Dashboard Filters (Auto & Custom), Metric Filters (Auto & Custom), and Dynamic Properties can now depend on Date Filters.
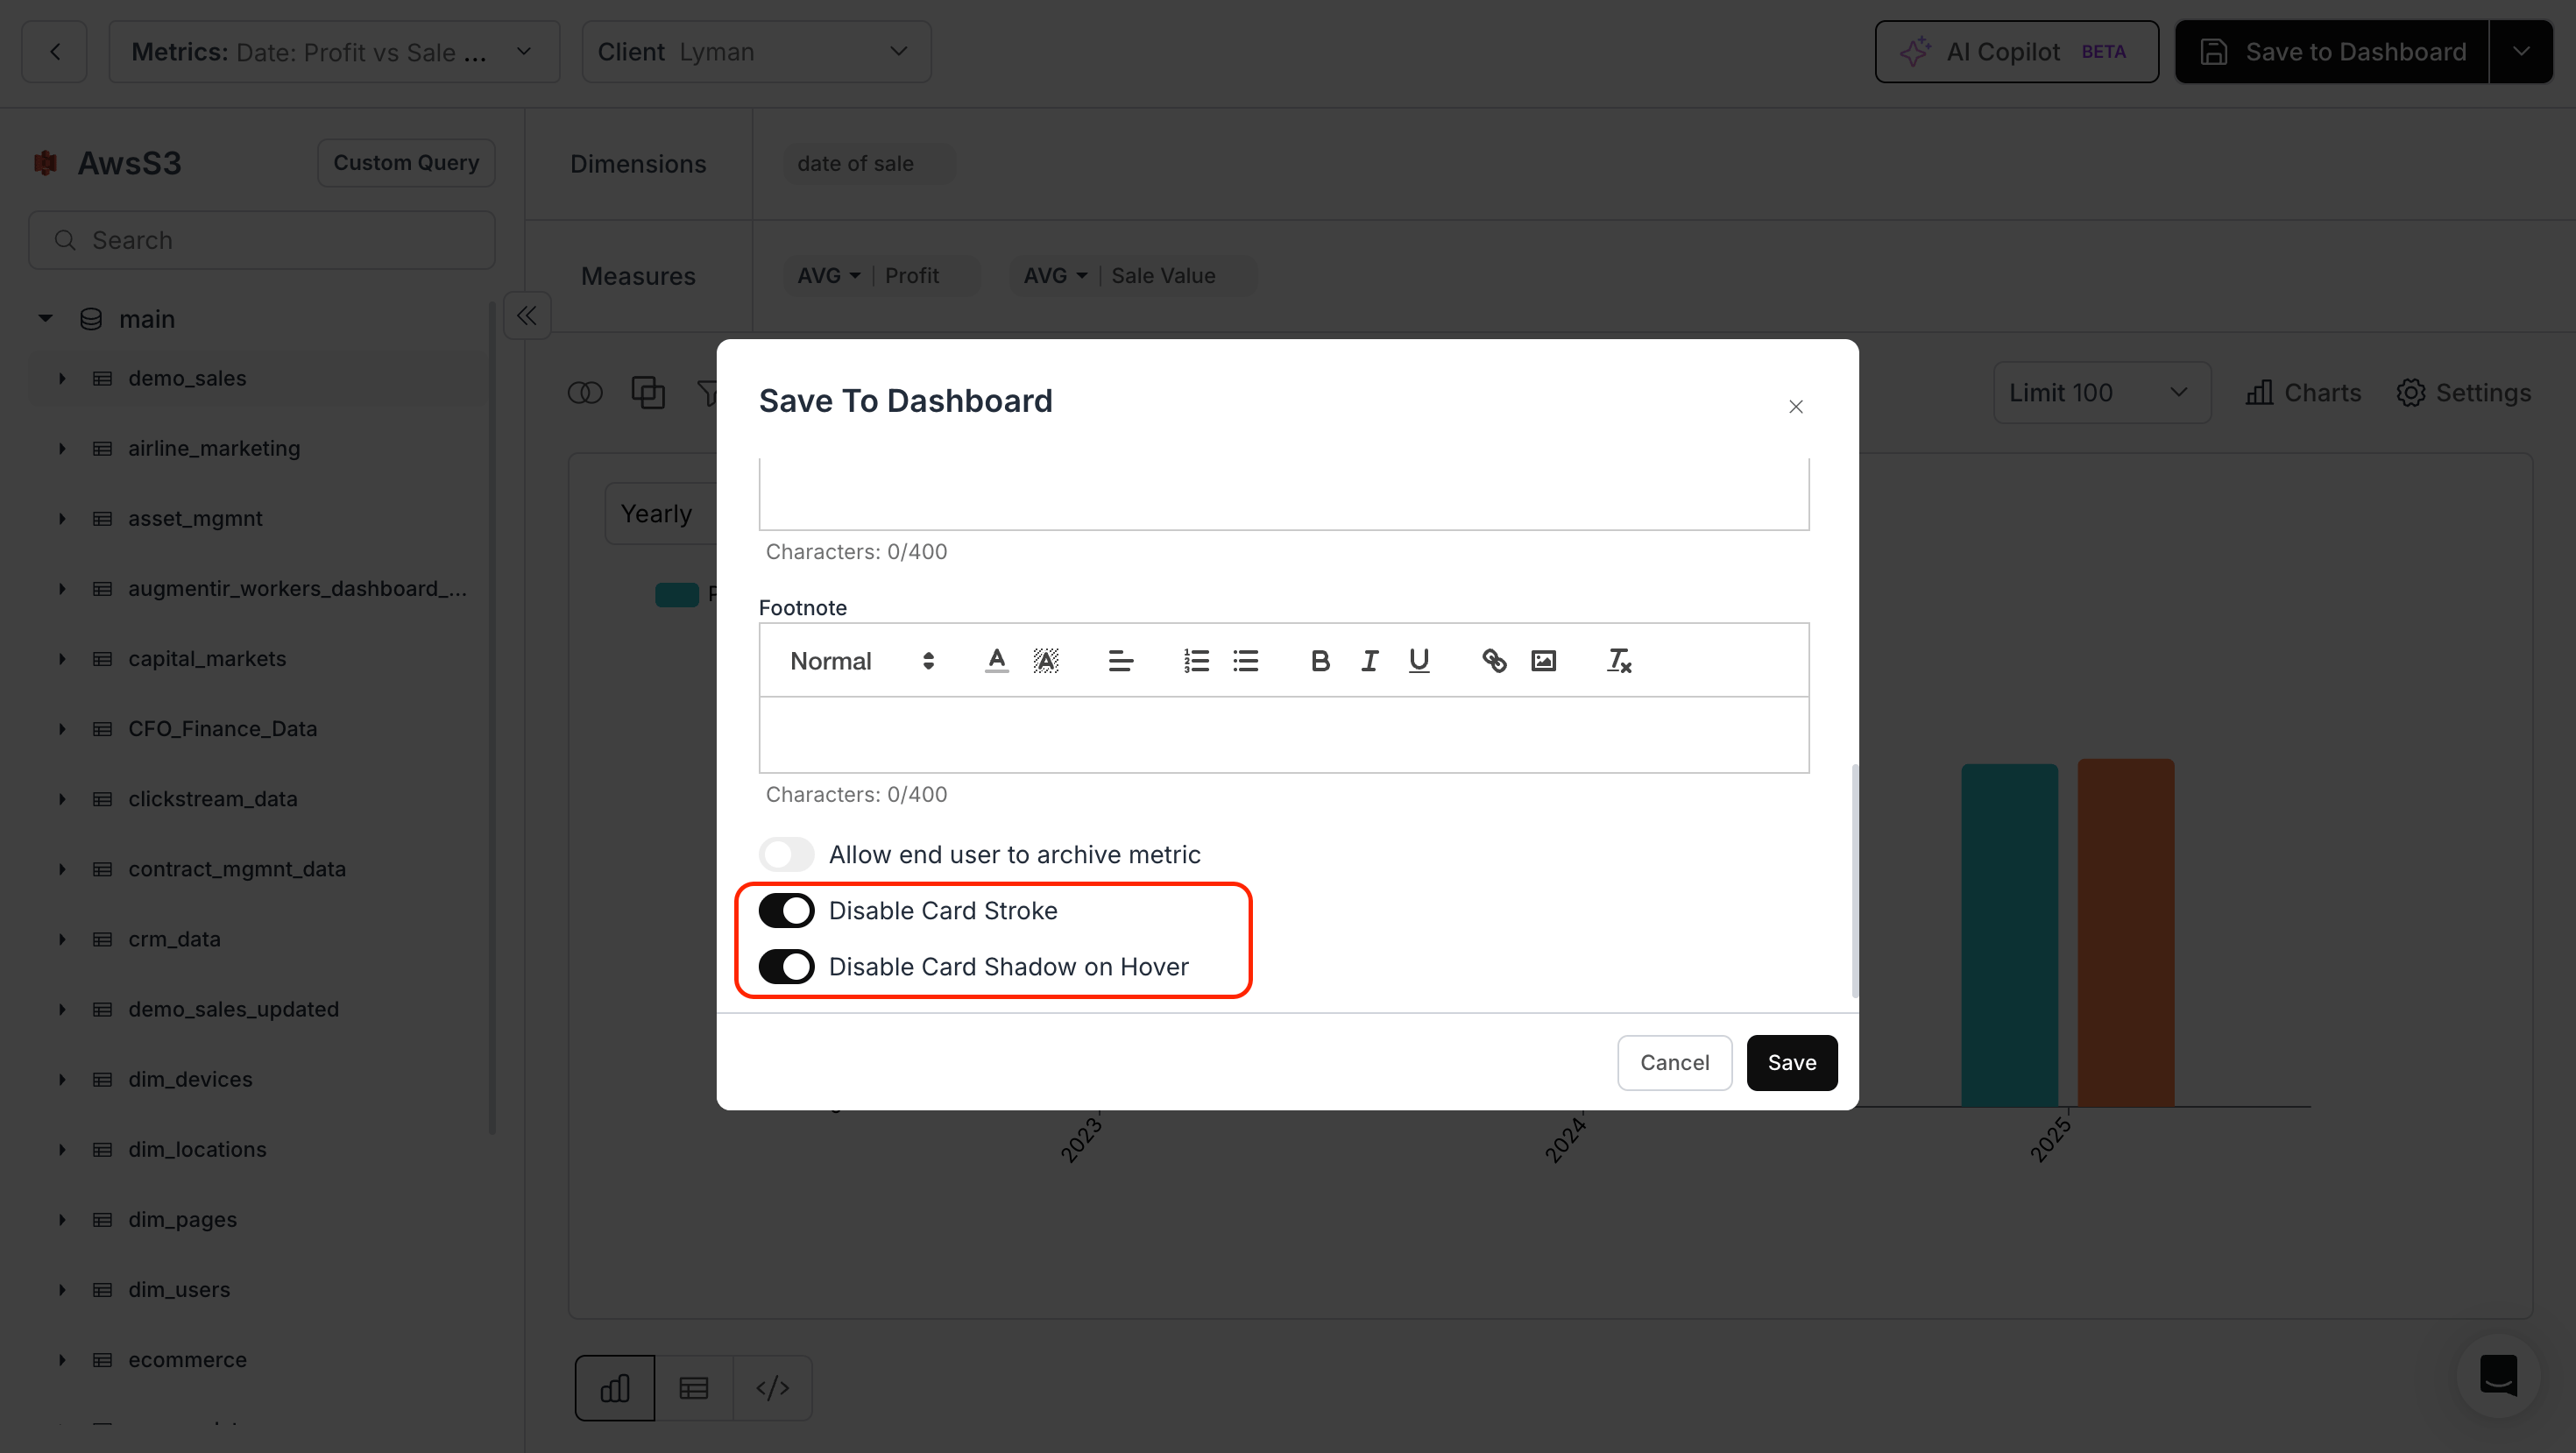
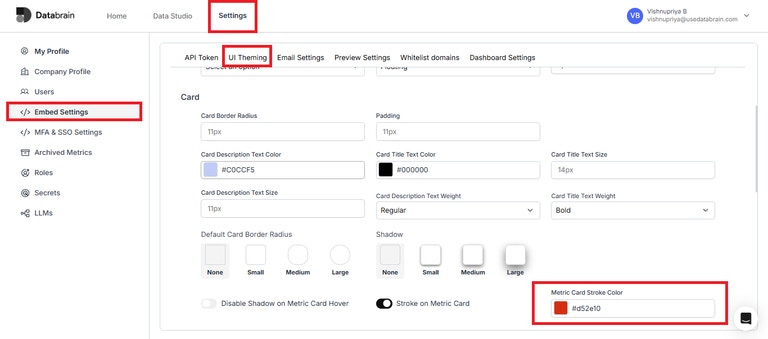
- Metric Card Appearance Controls:
Added options to show or hide the card stroke and hover shadow for individual metric cards. These settings are available in the Save to Dashboard dialog.
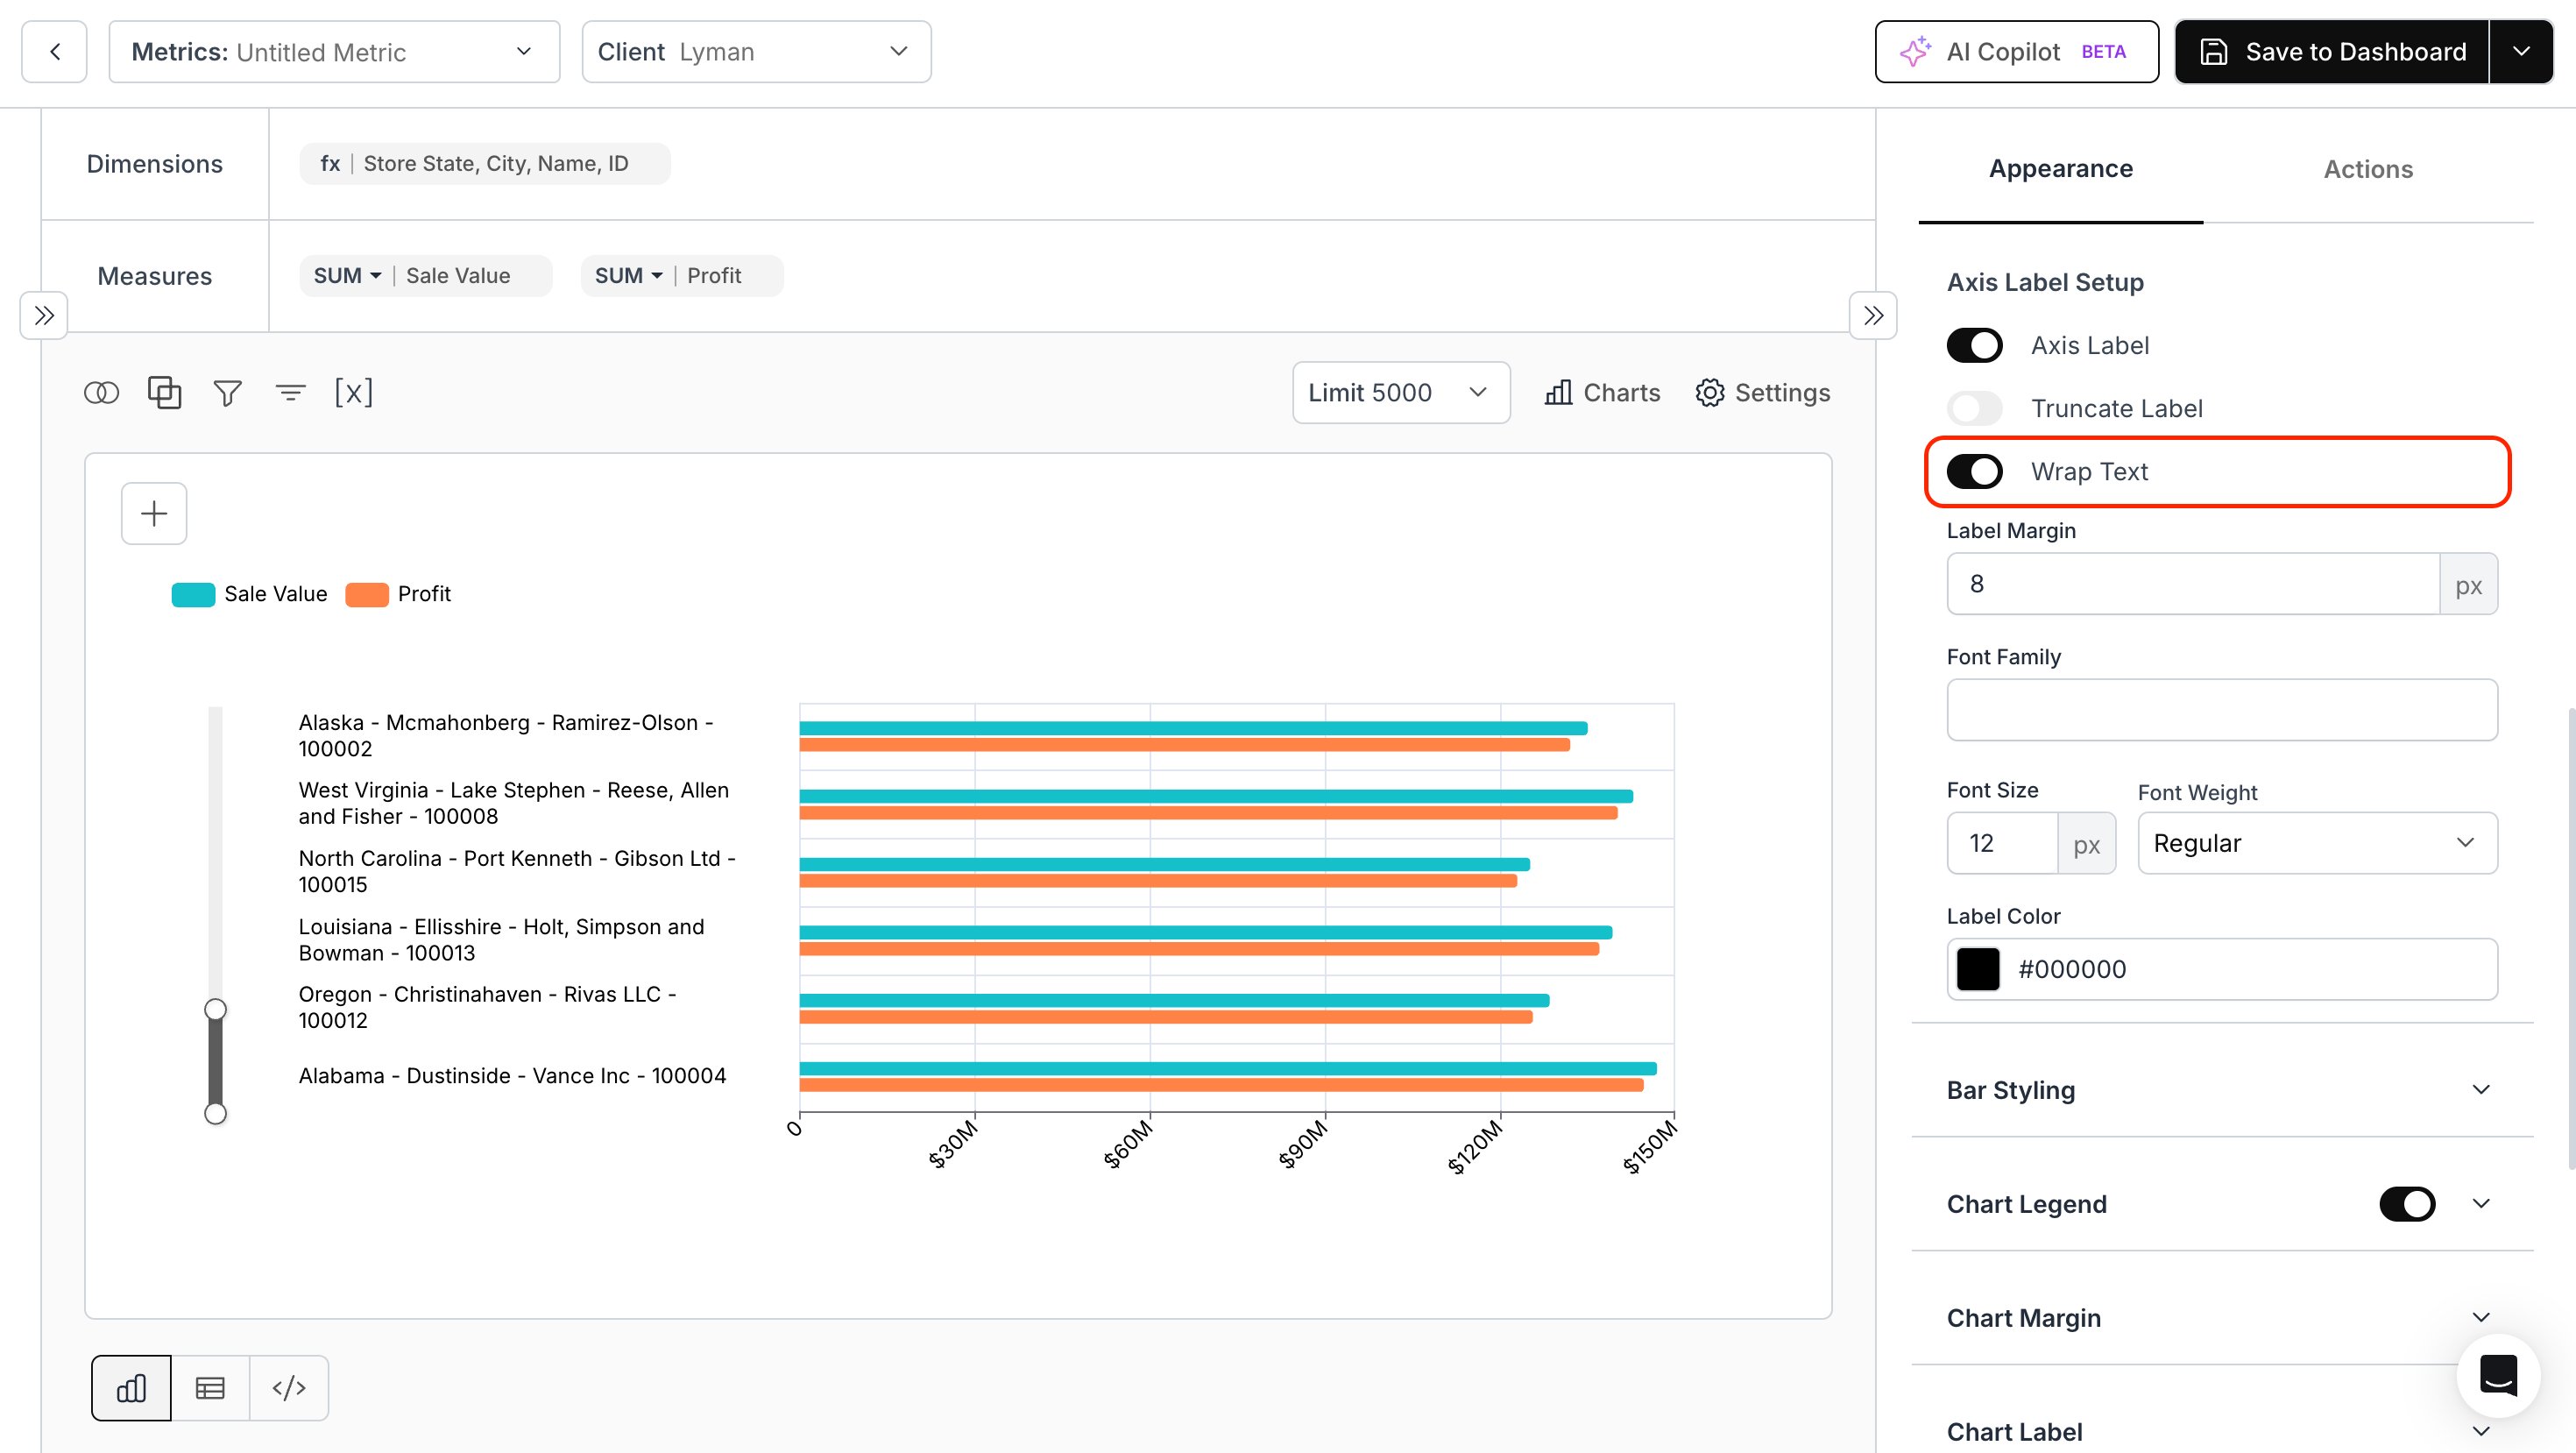
- Wrap Text Support for Y-Axis Labels:
Added a Wrap Text toggle under Axis Label Setup for vertical charts. Long category labels are now wrapped into an aligned column for improved readability.
Fixes:
-
Dashboard Export/Import:
Fixed an issue where Metric IDs referenced in Metric Expressions were not updated after importing a dashboard, resulting in connection errors. -
Schema Caching:
Improved schema caching performance for data sources containing 500+ databases. -
Chart Legend Colors:
Fixed an issue where legend colors were not applied correctly when the dimension column was of INT data type. -
Table Chart Number Formatting:
Fixed an issue where number formatting was not applied to the value 0 in Table Charts.
June 24, 2026 Updates
June 24, 2026 Updates
Enhancements:
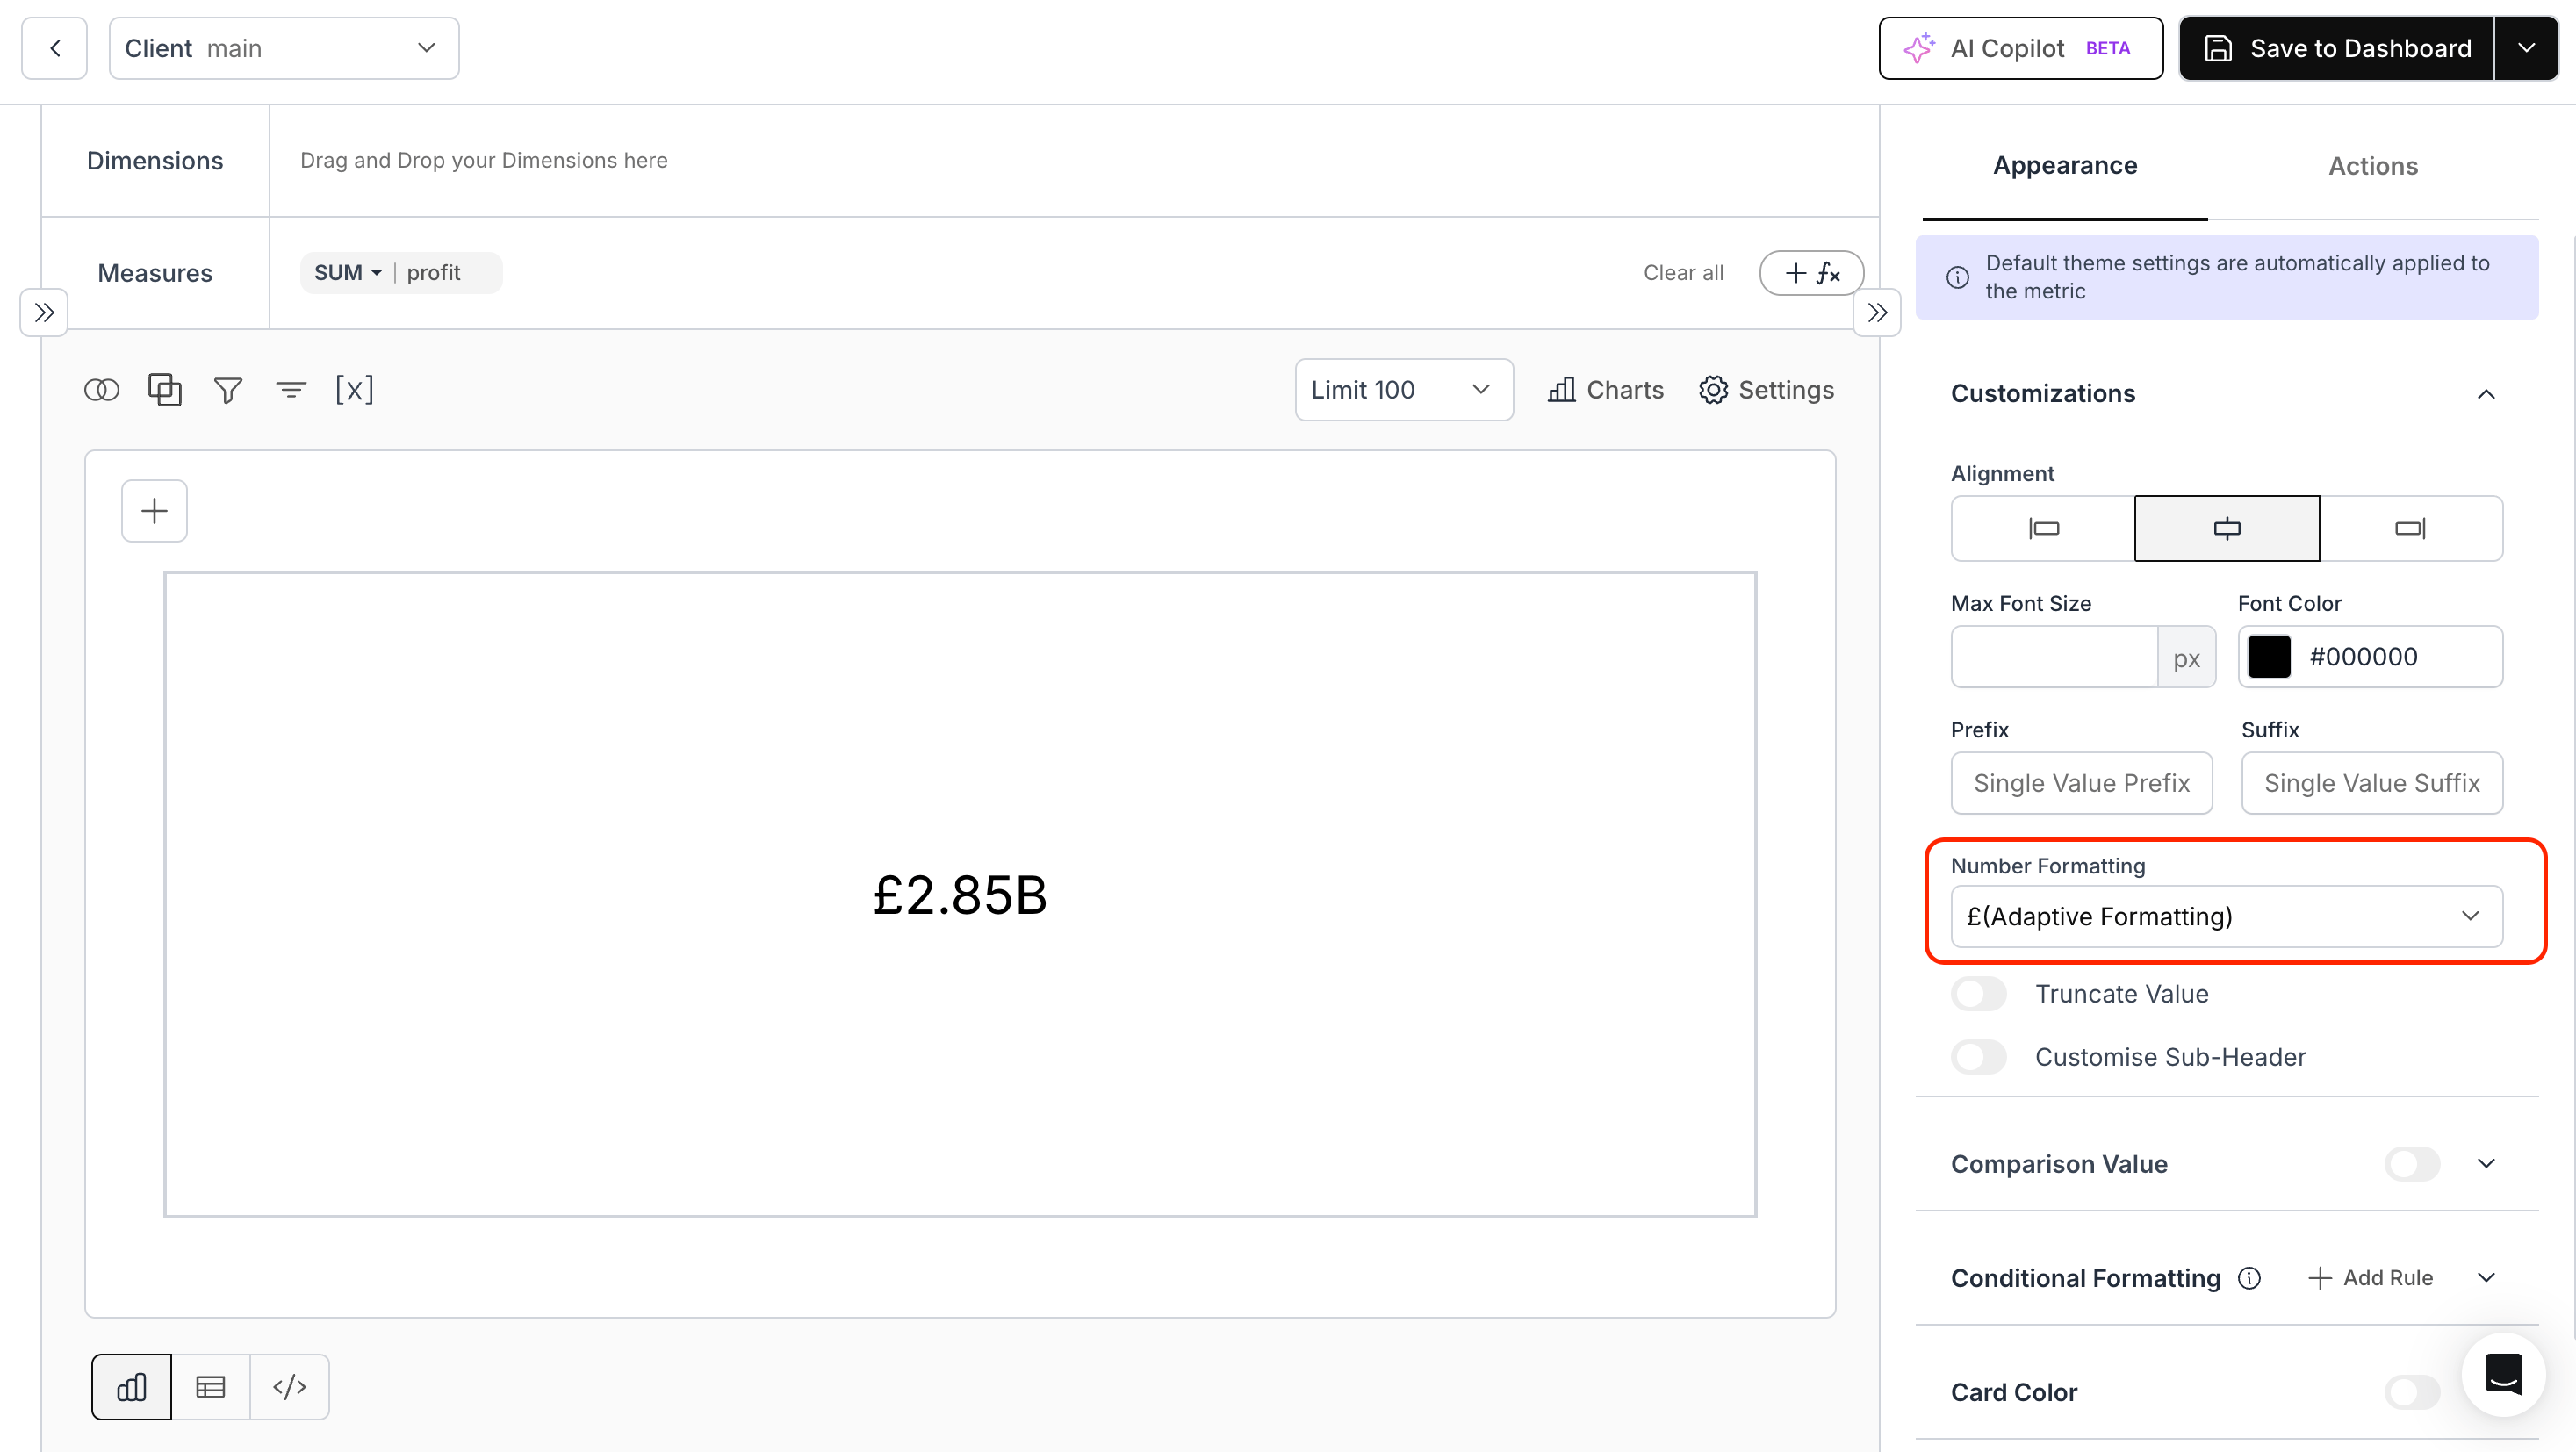
- GBP Formatting Option:
Users can now format numeric values in GBP for supported chart types.
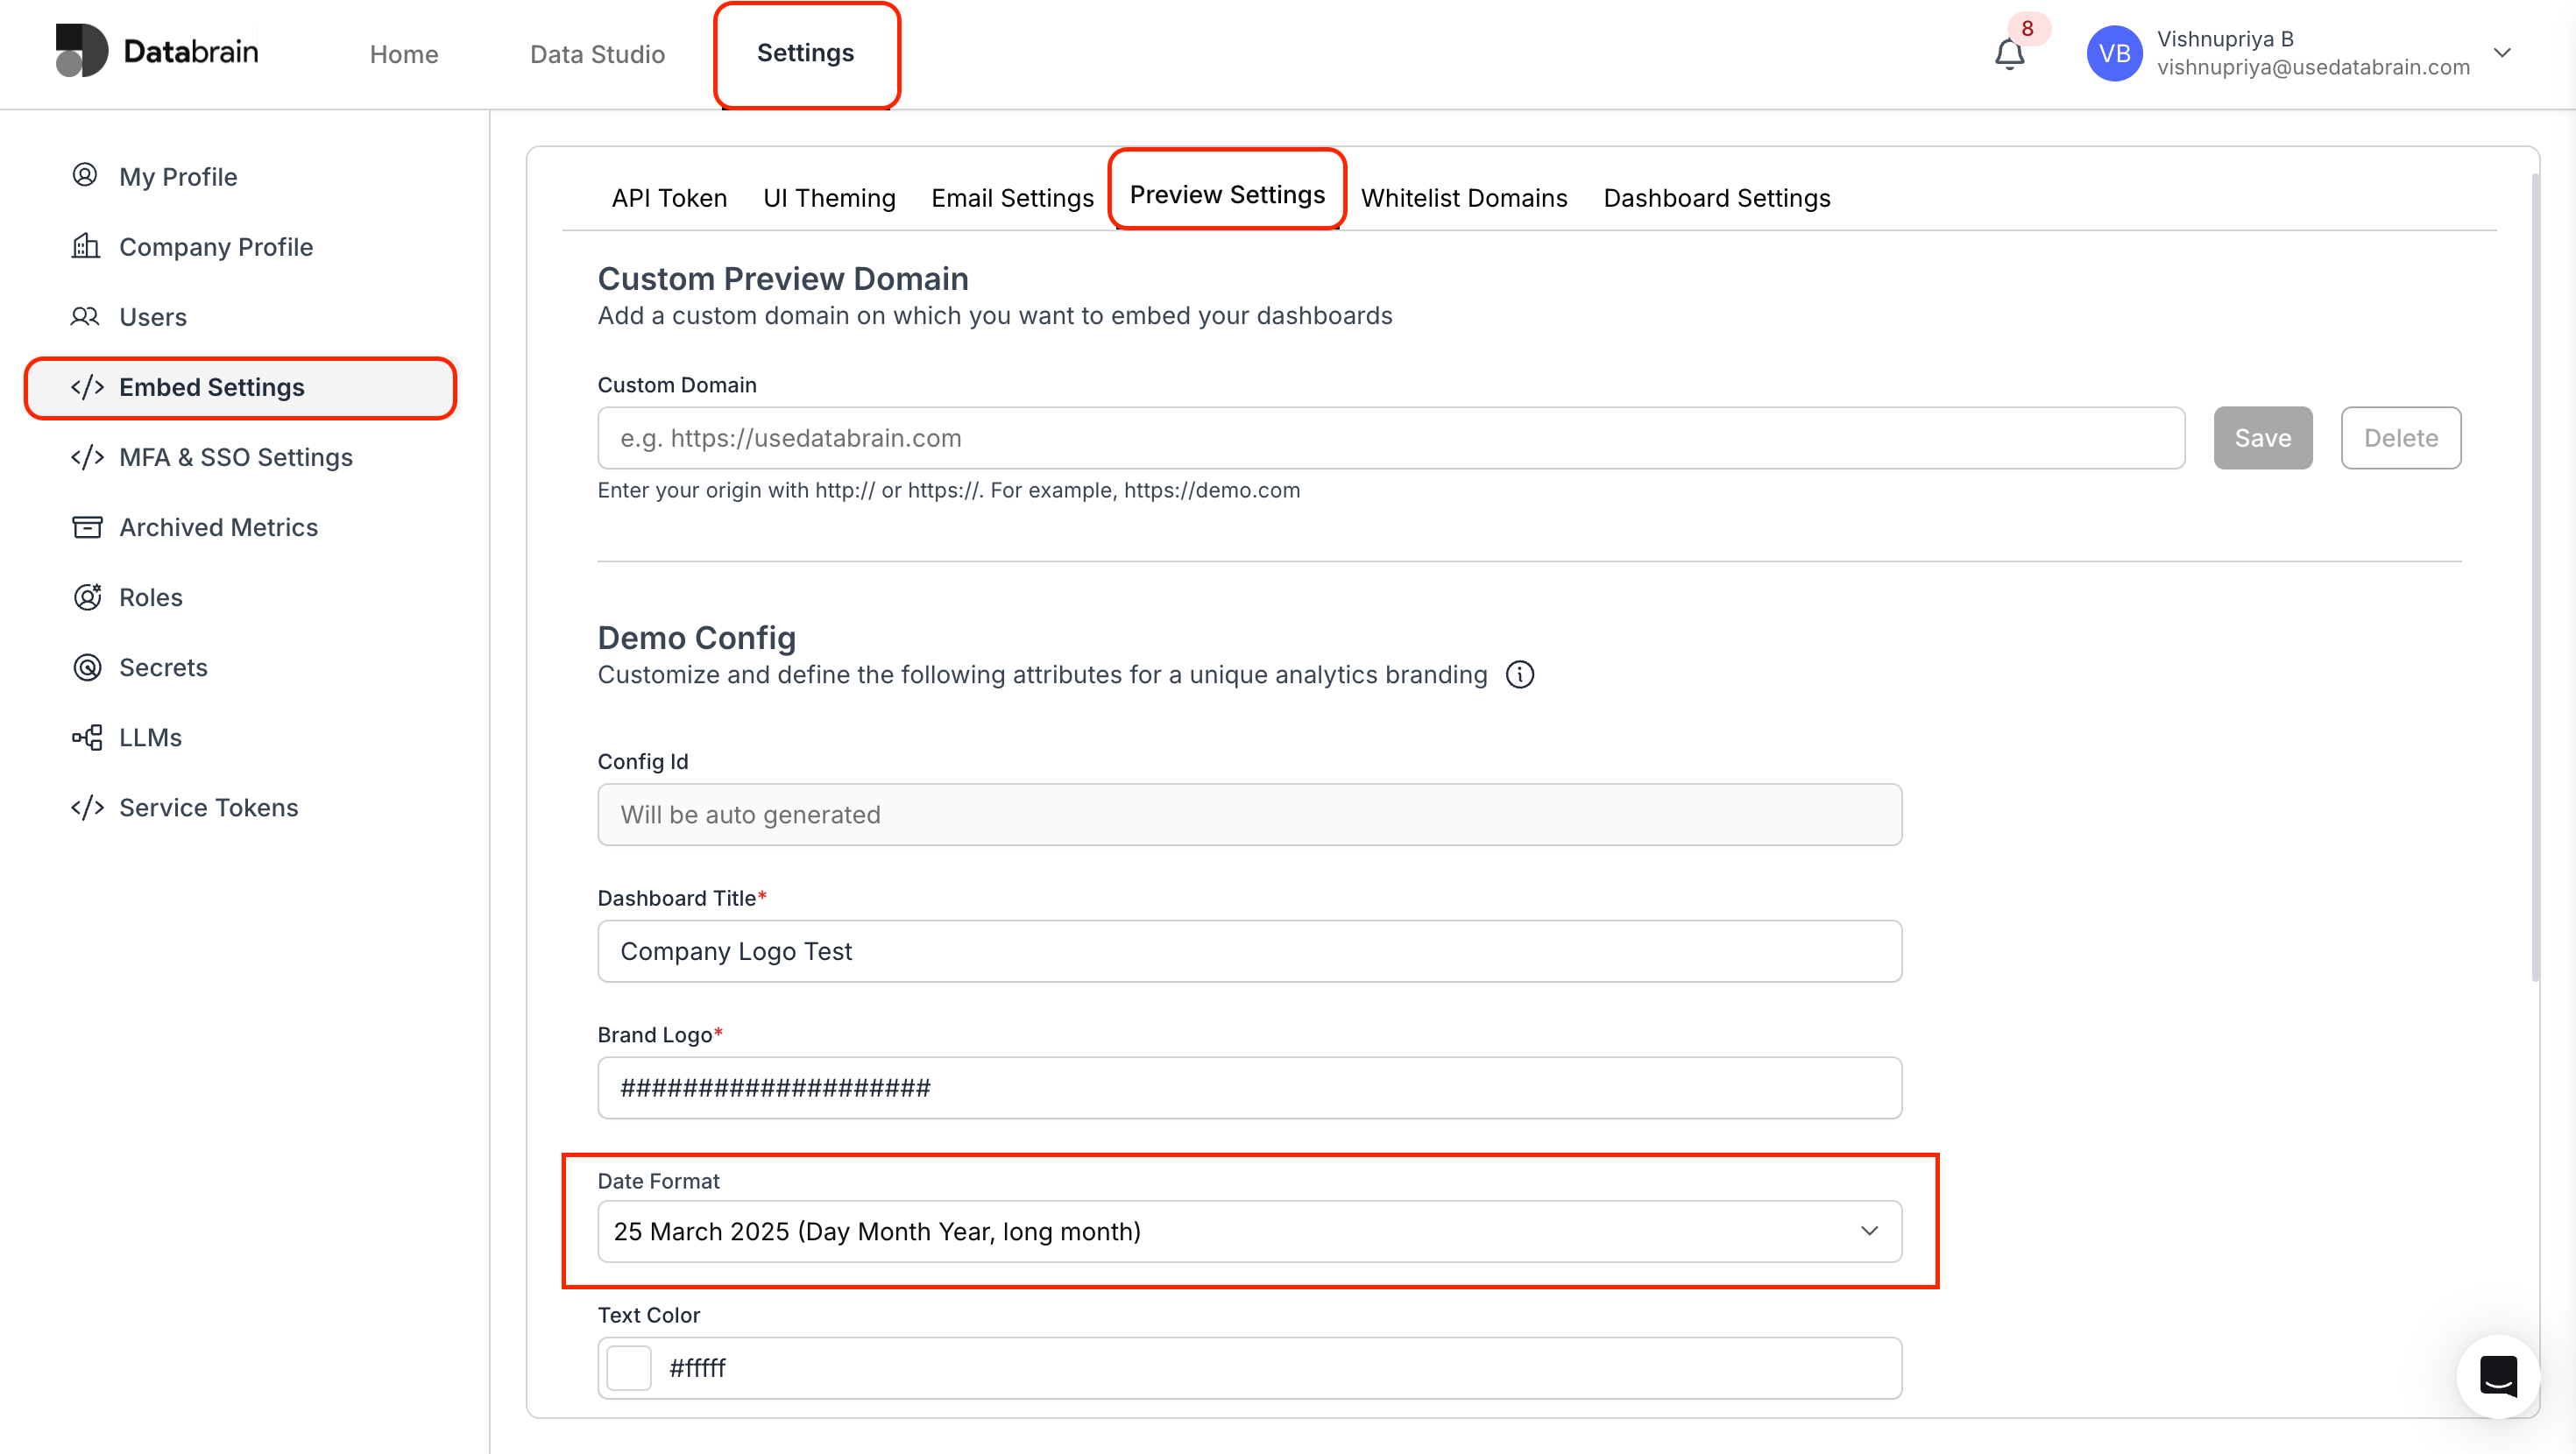
- PDF Export Date Formatting:
Users can now customize the date format used in exported PDFs.
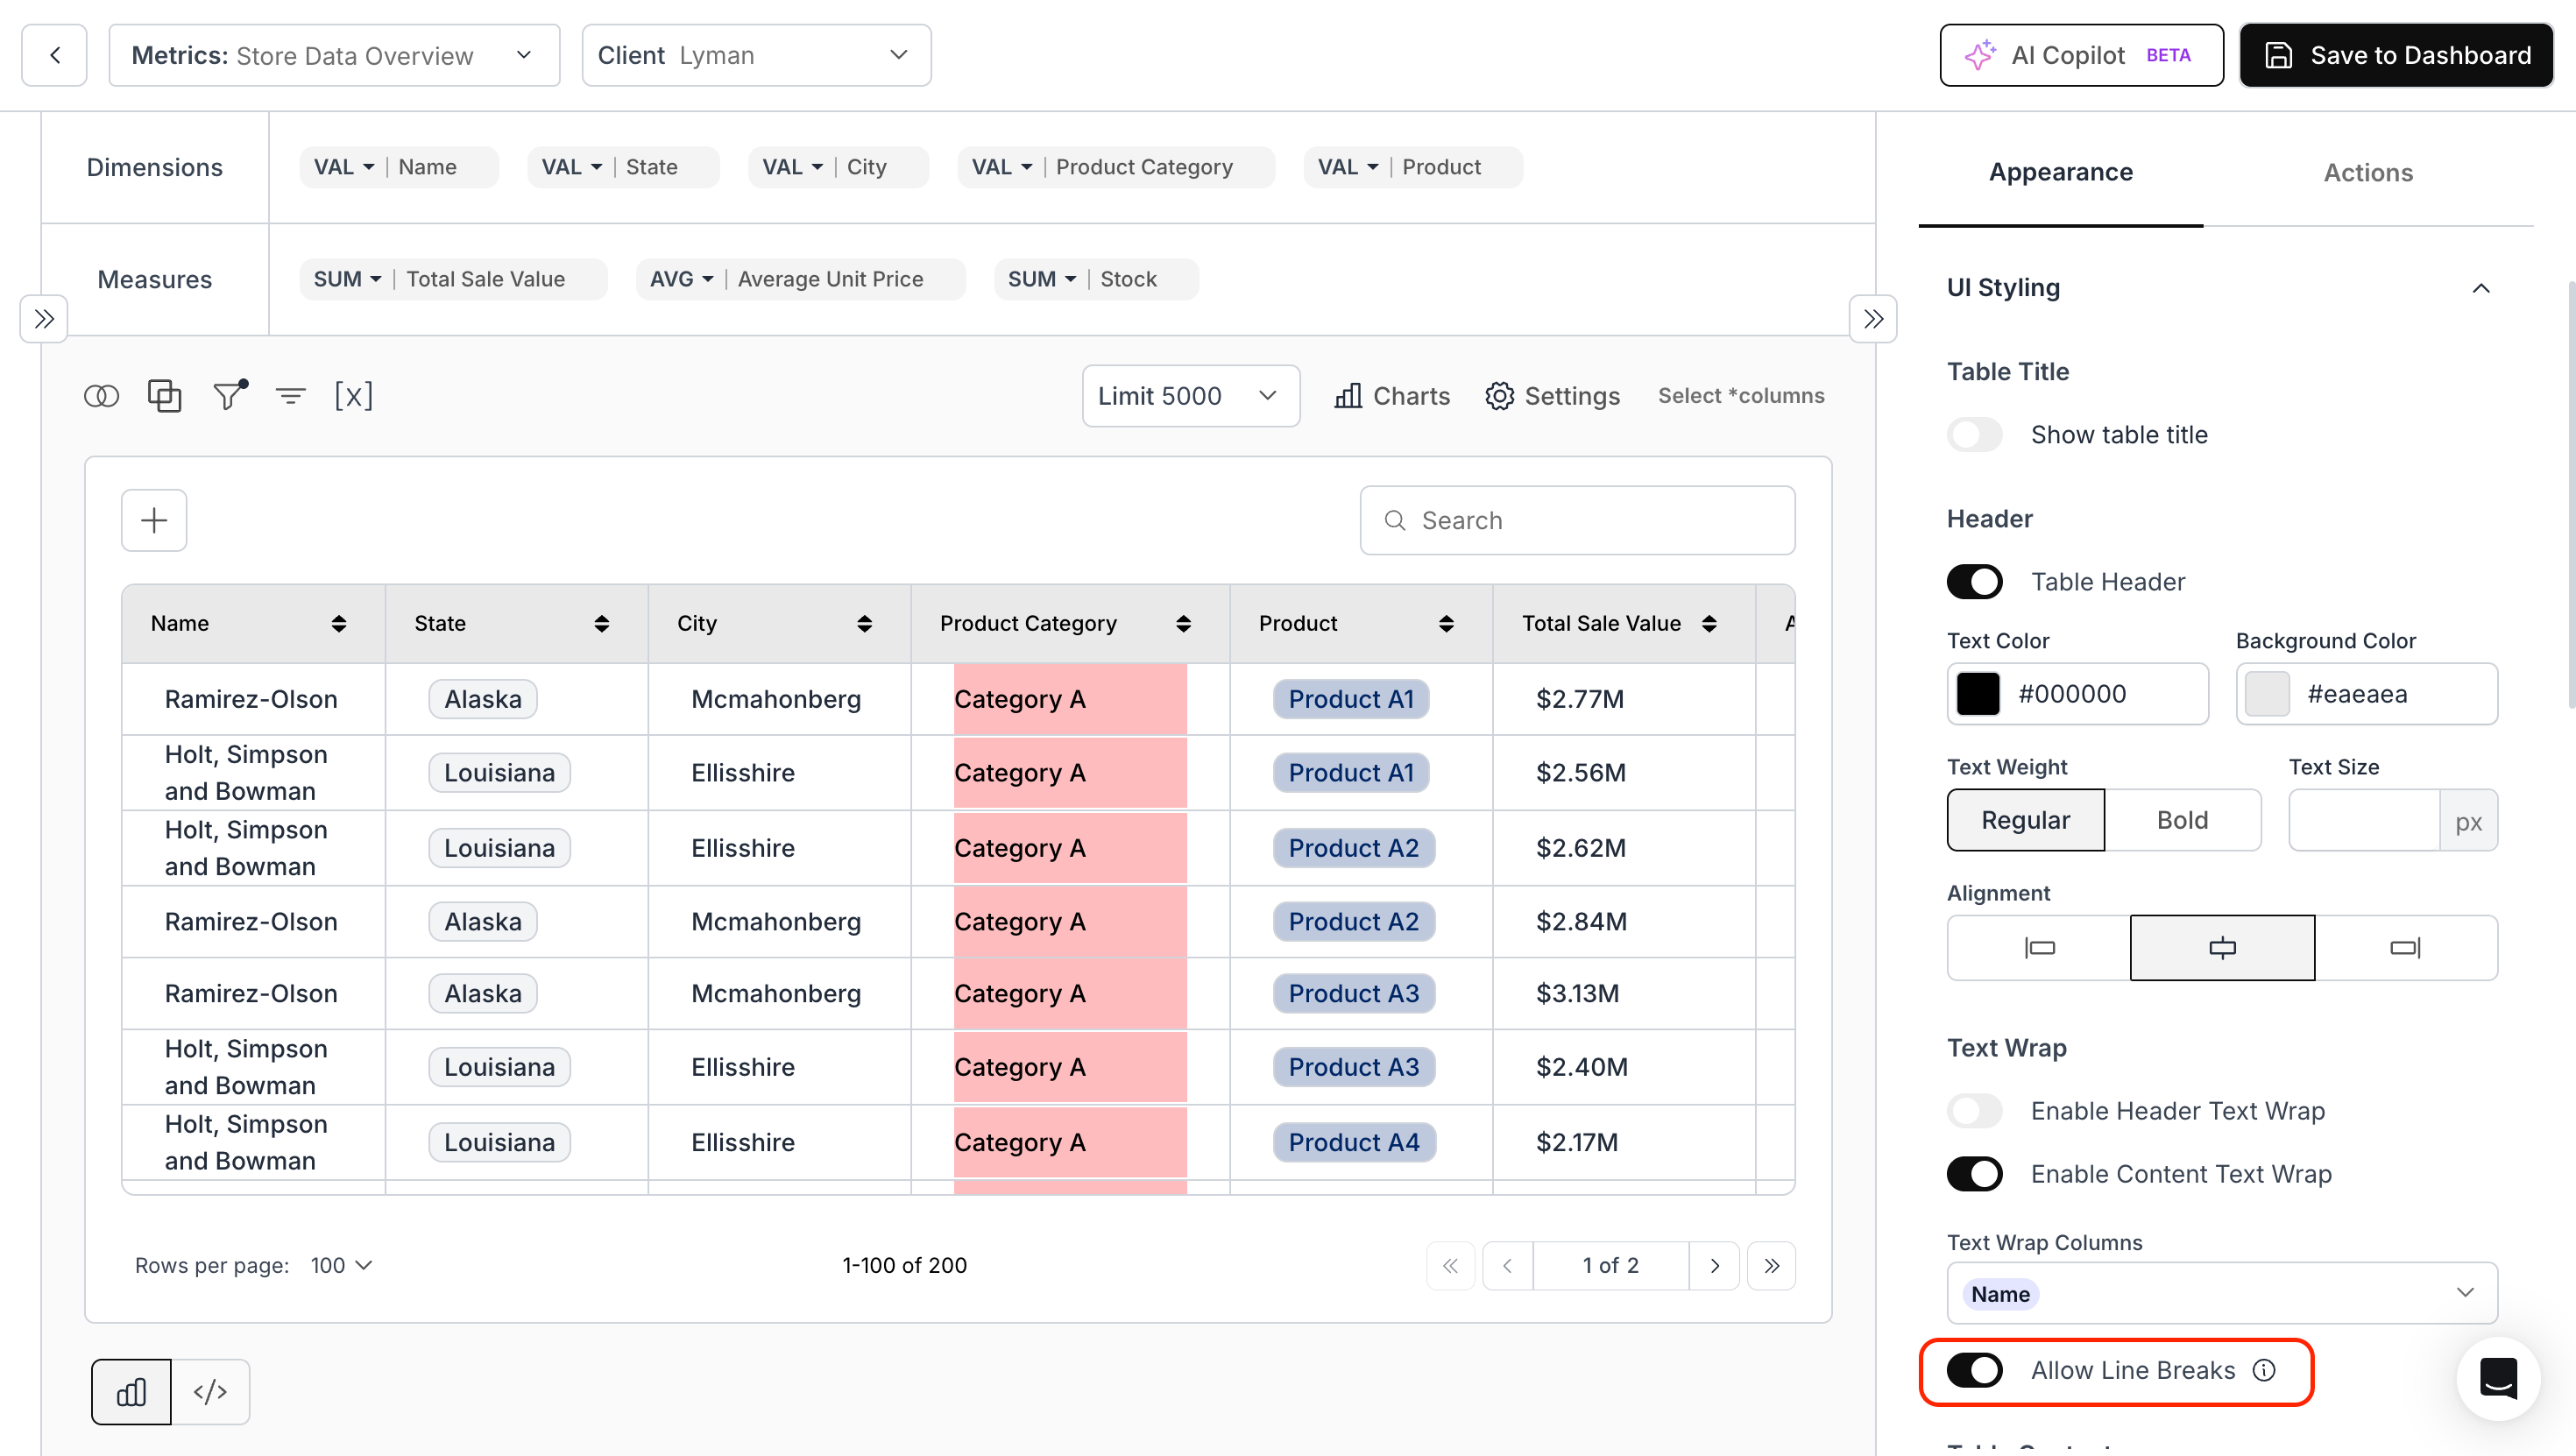
- Line Breaks in Table Chart:
We have added Allow Line Breaks under Chart Settings > UI Styling > Enable Content Text Wrap. When enabled, newline characters from raw data are preserved.
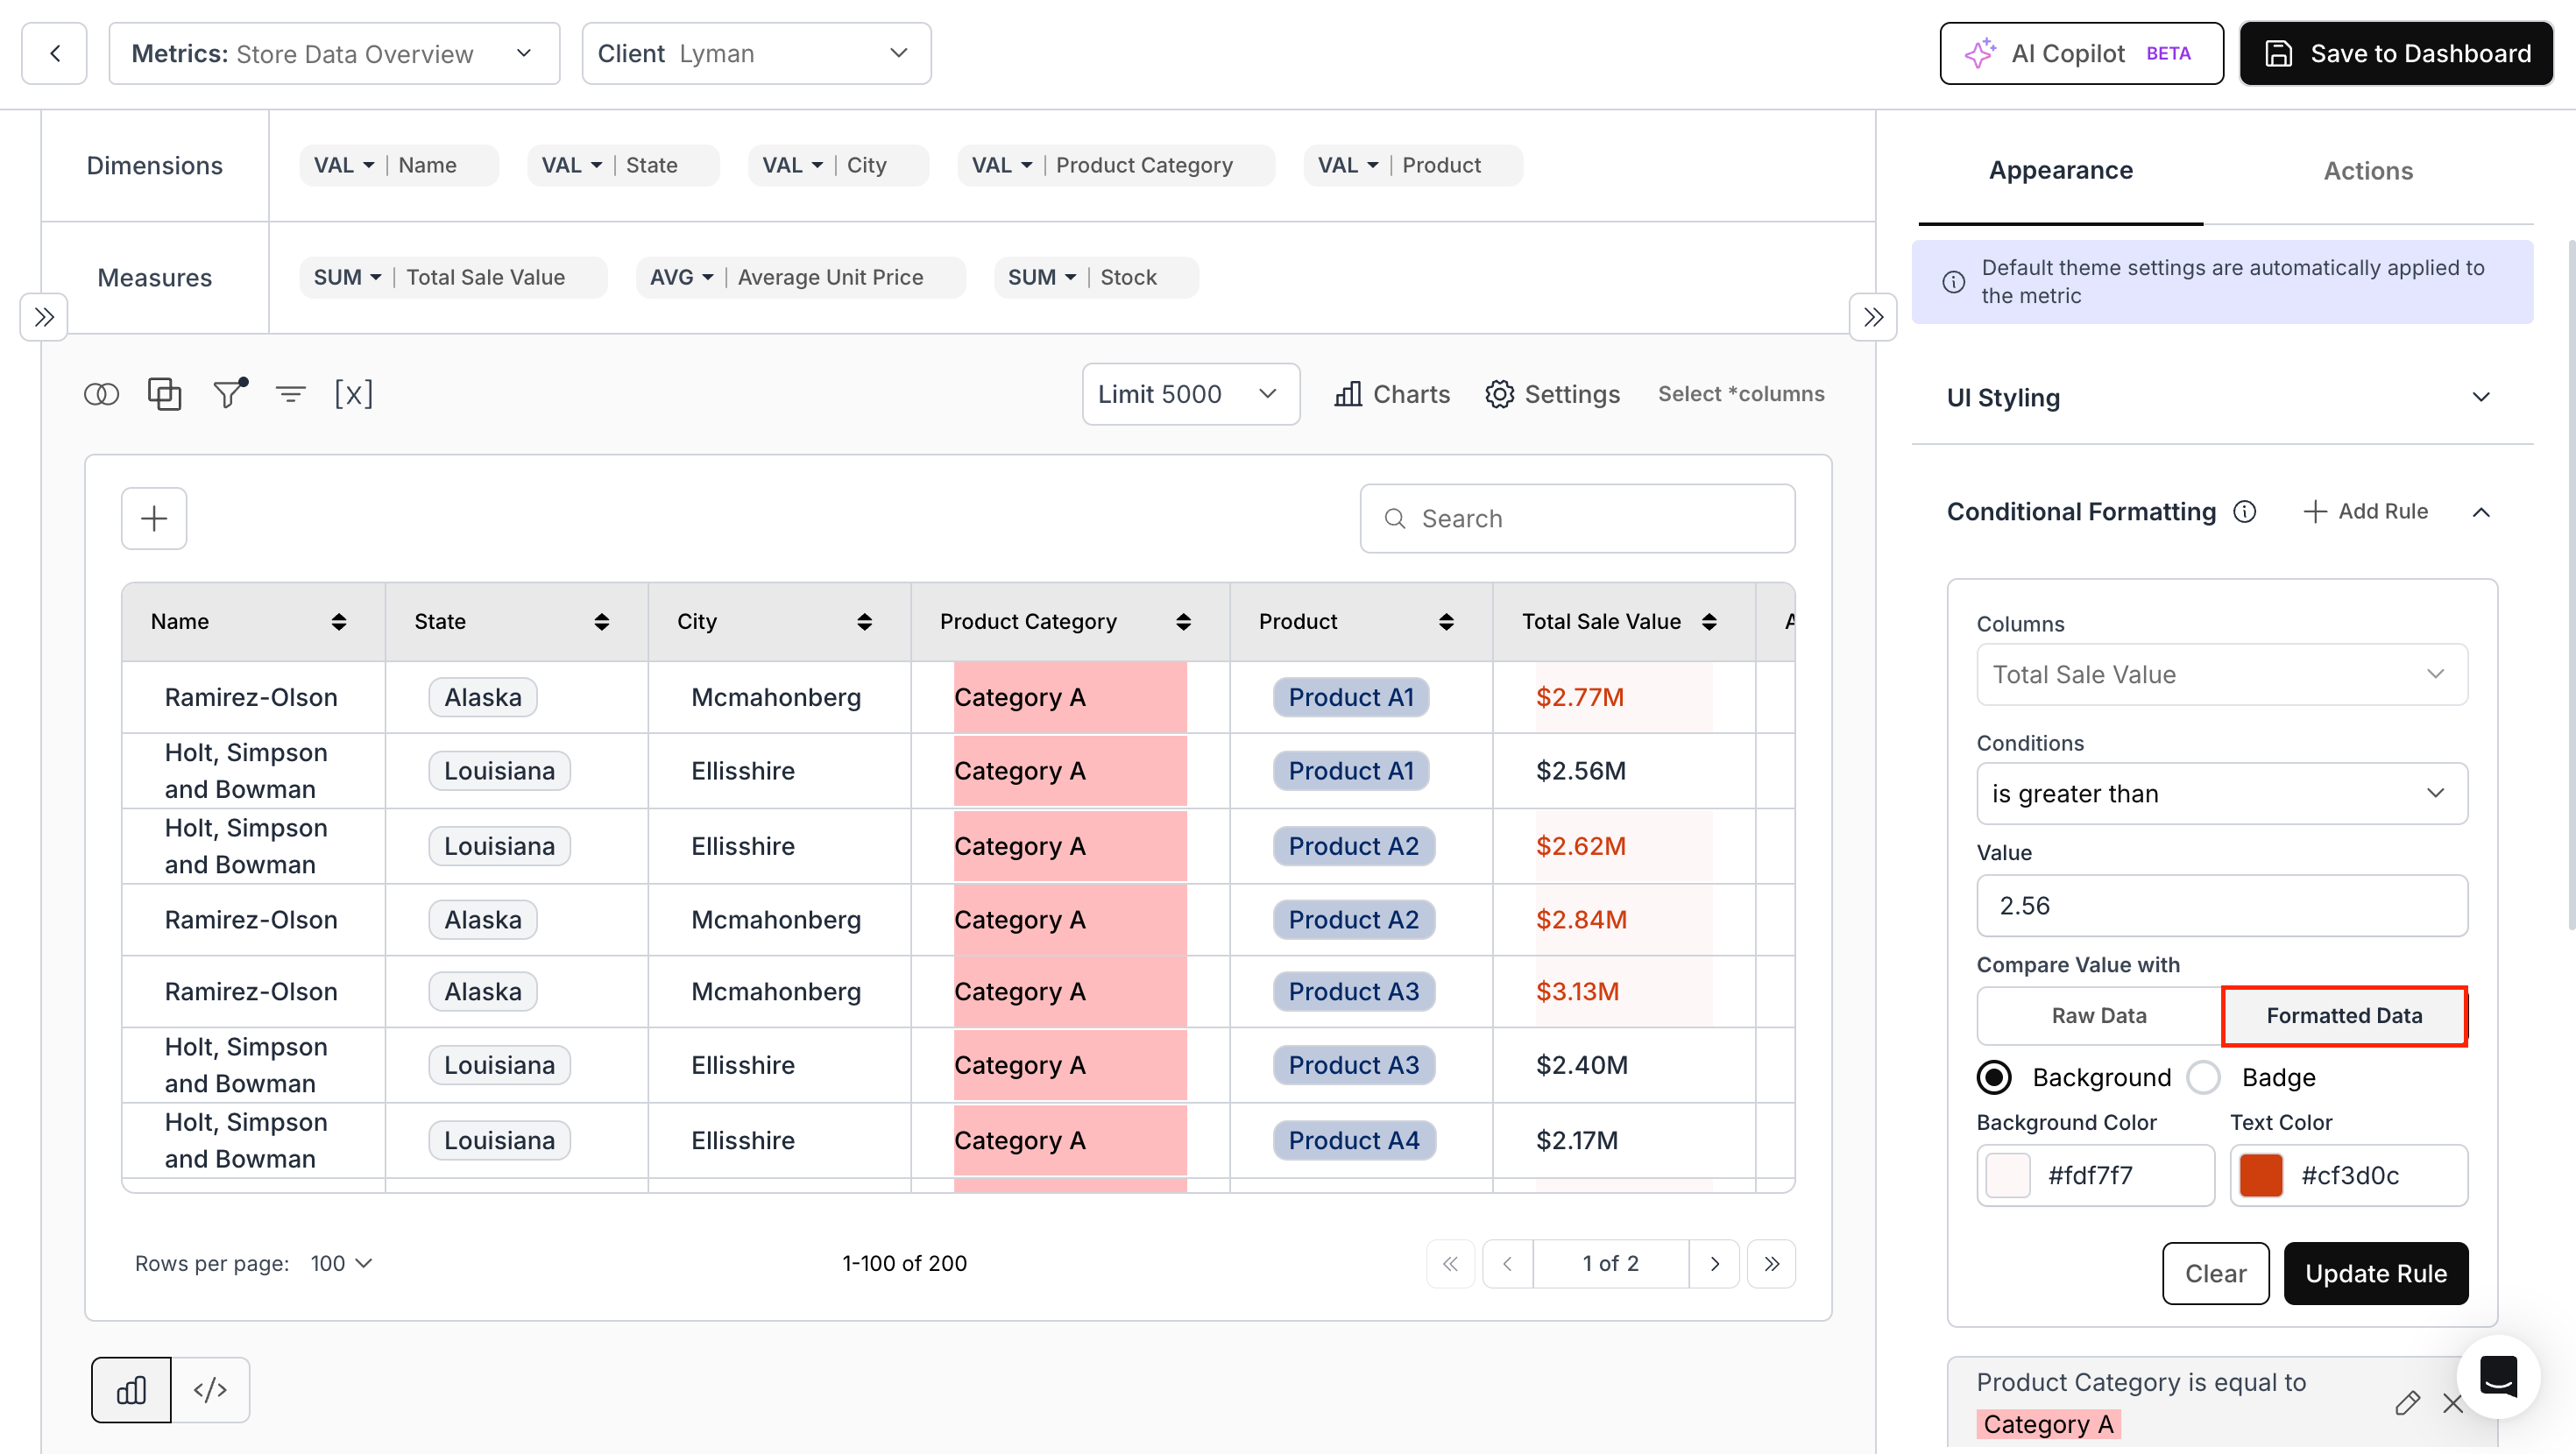
- Conditional Formatting for Formatted Values:
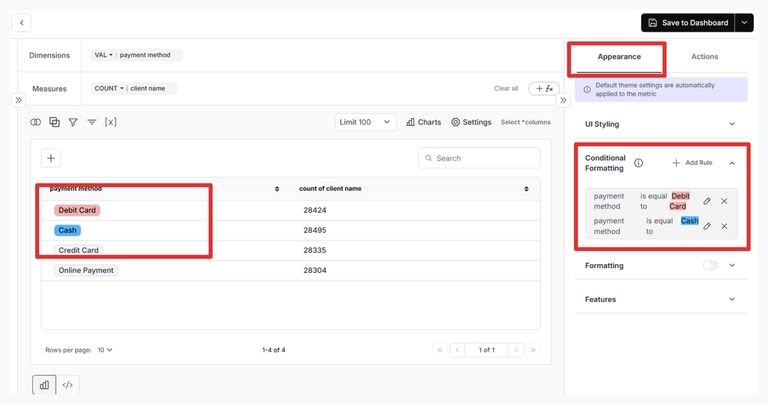
We have added an option to compare conditional formatting rules against either Raw Data or Formatted Data. The Formatted Data option is available only when number formatting is applied to the selected column.
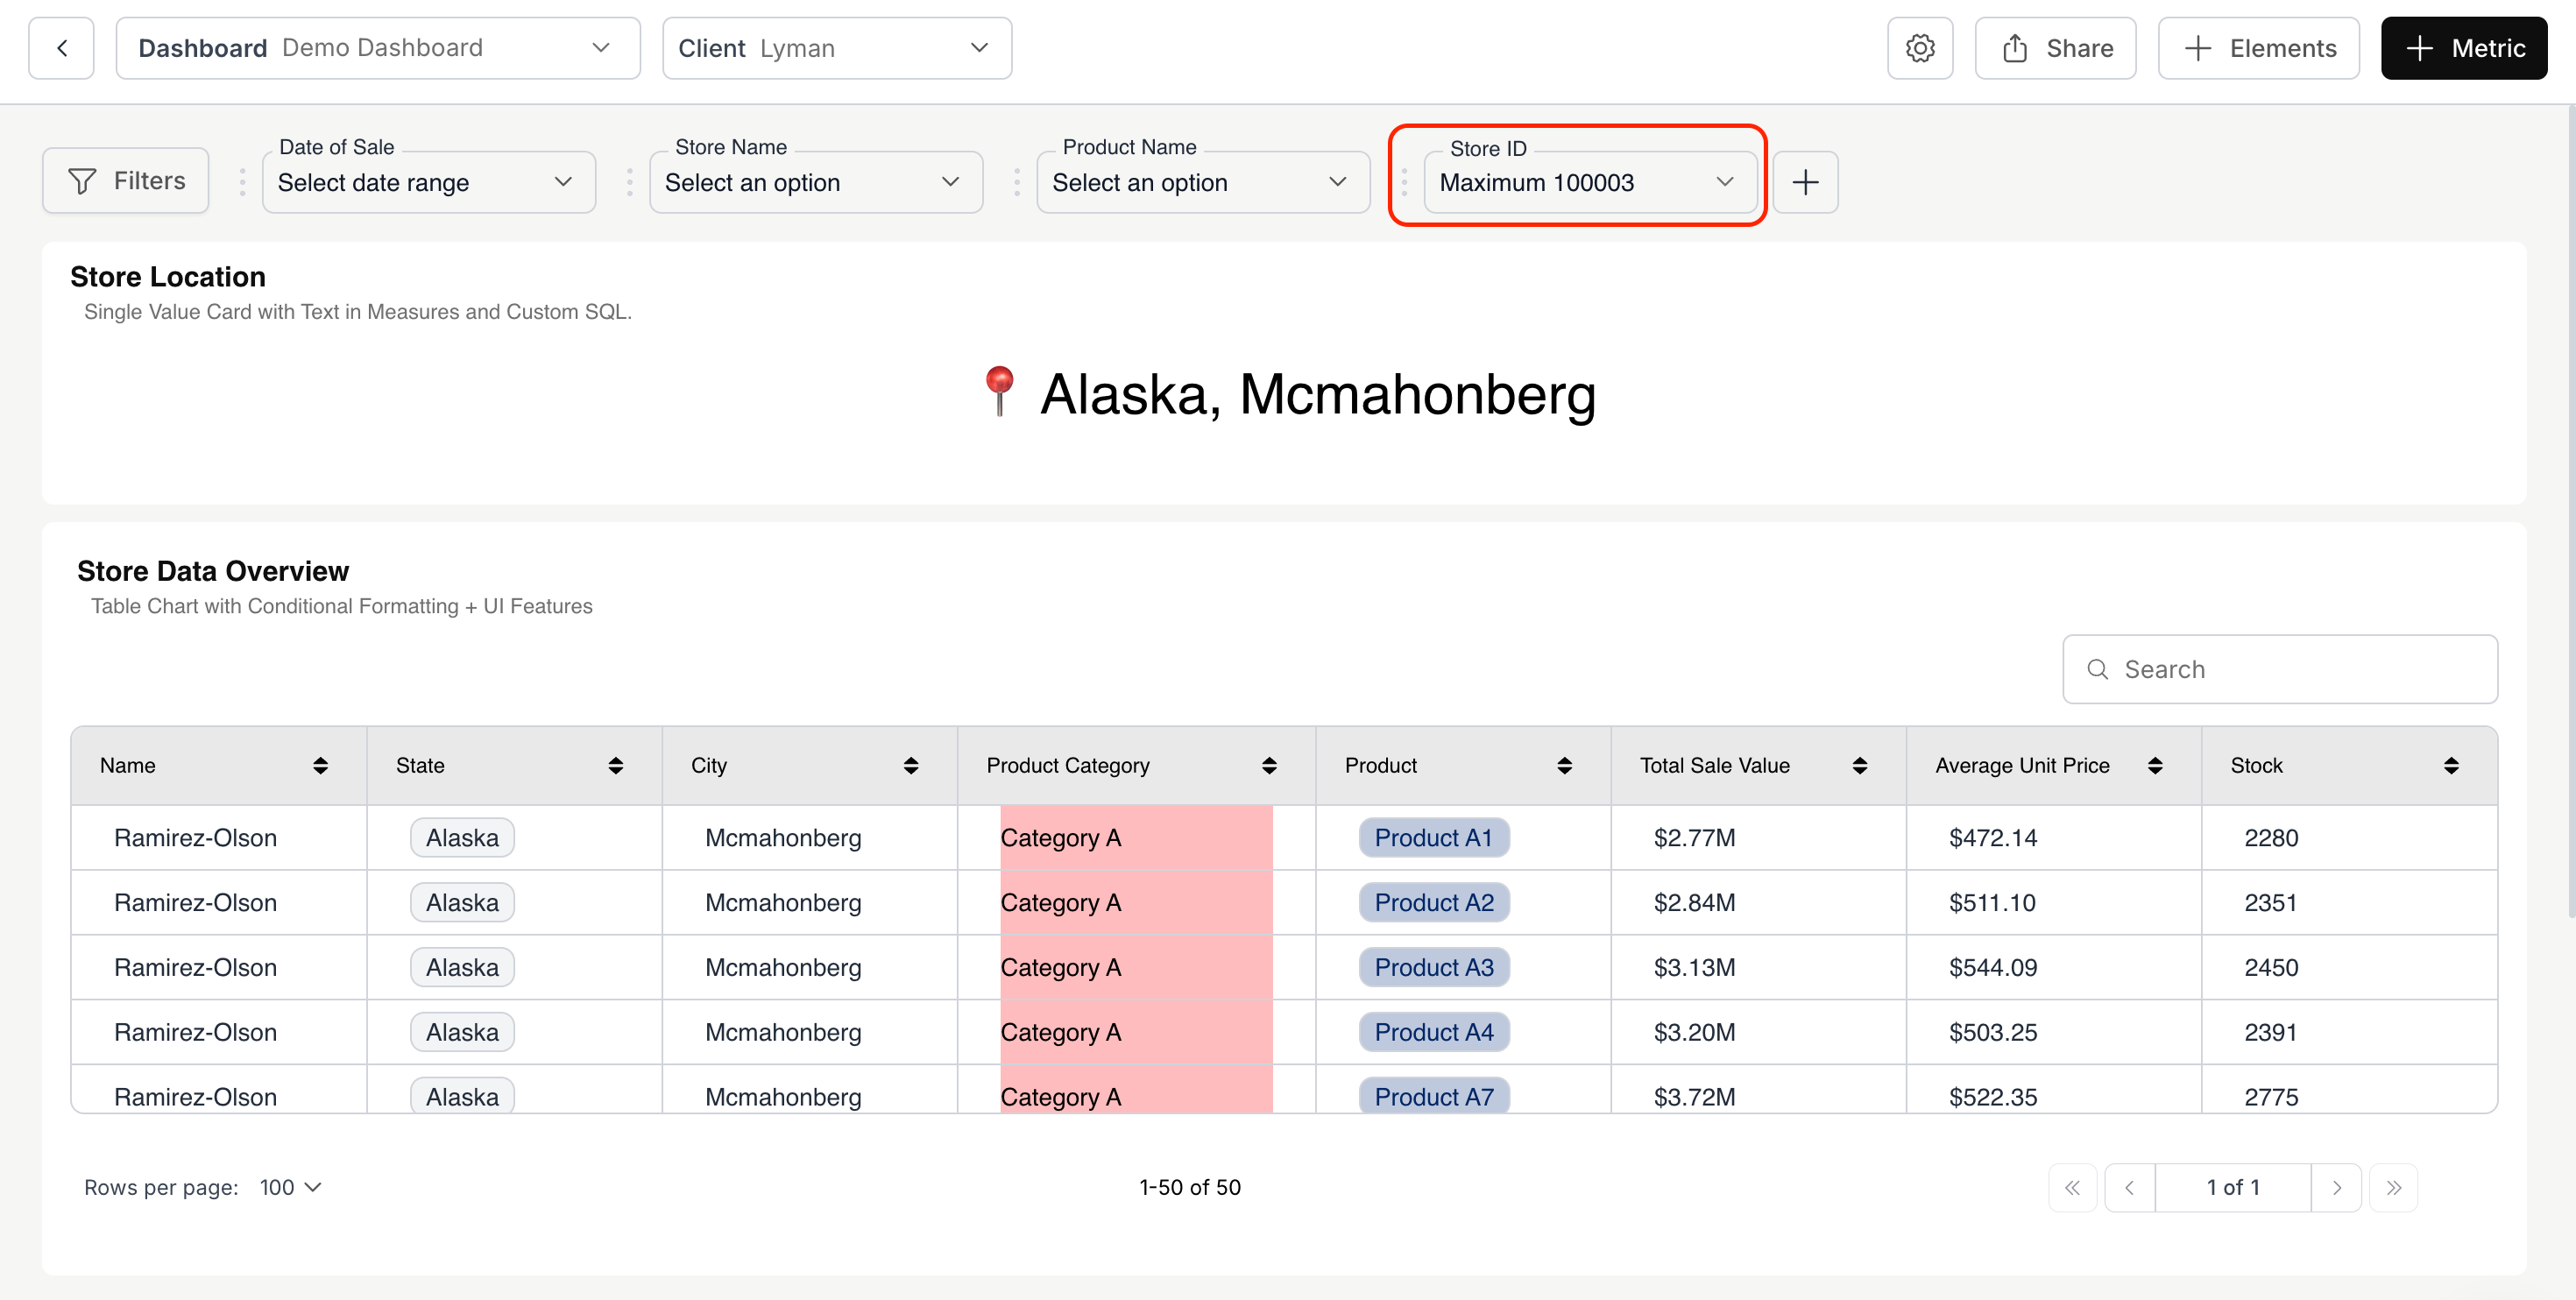
- Dashboard Range Filter Enhancement:
Dashboard range filters now support cases where only a minimum or maximum value is provided.
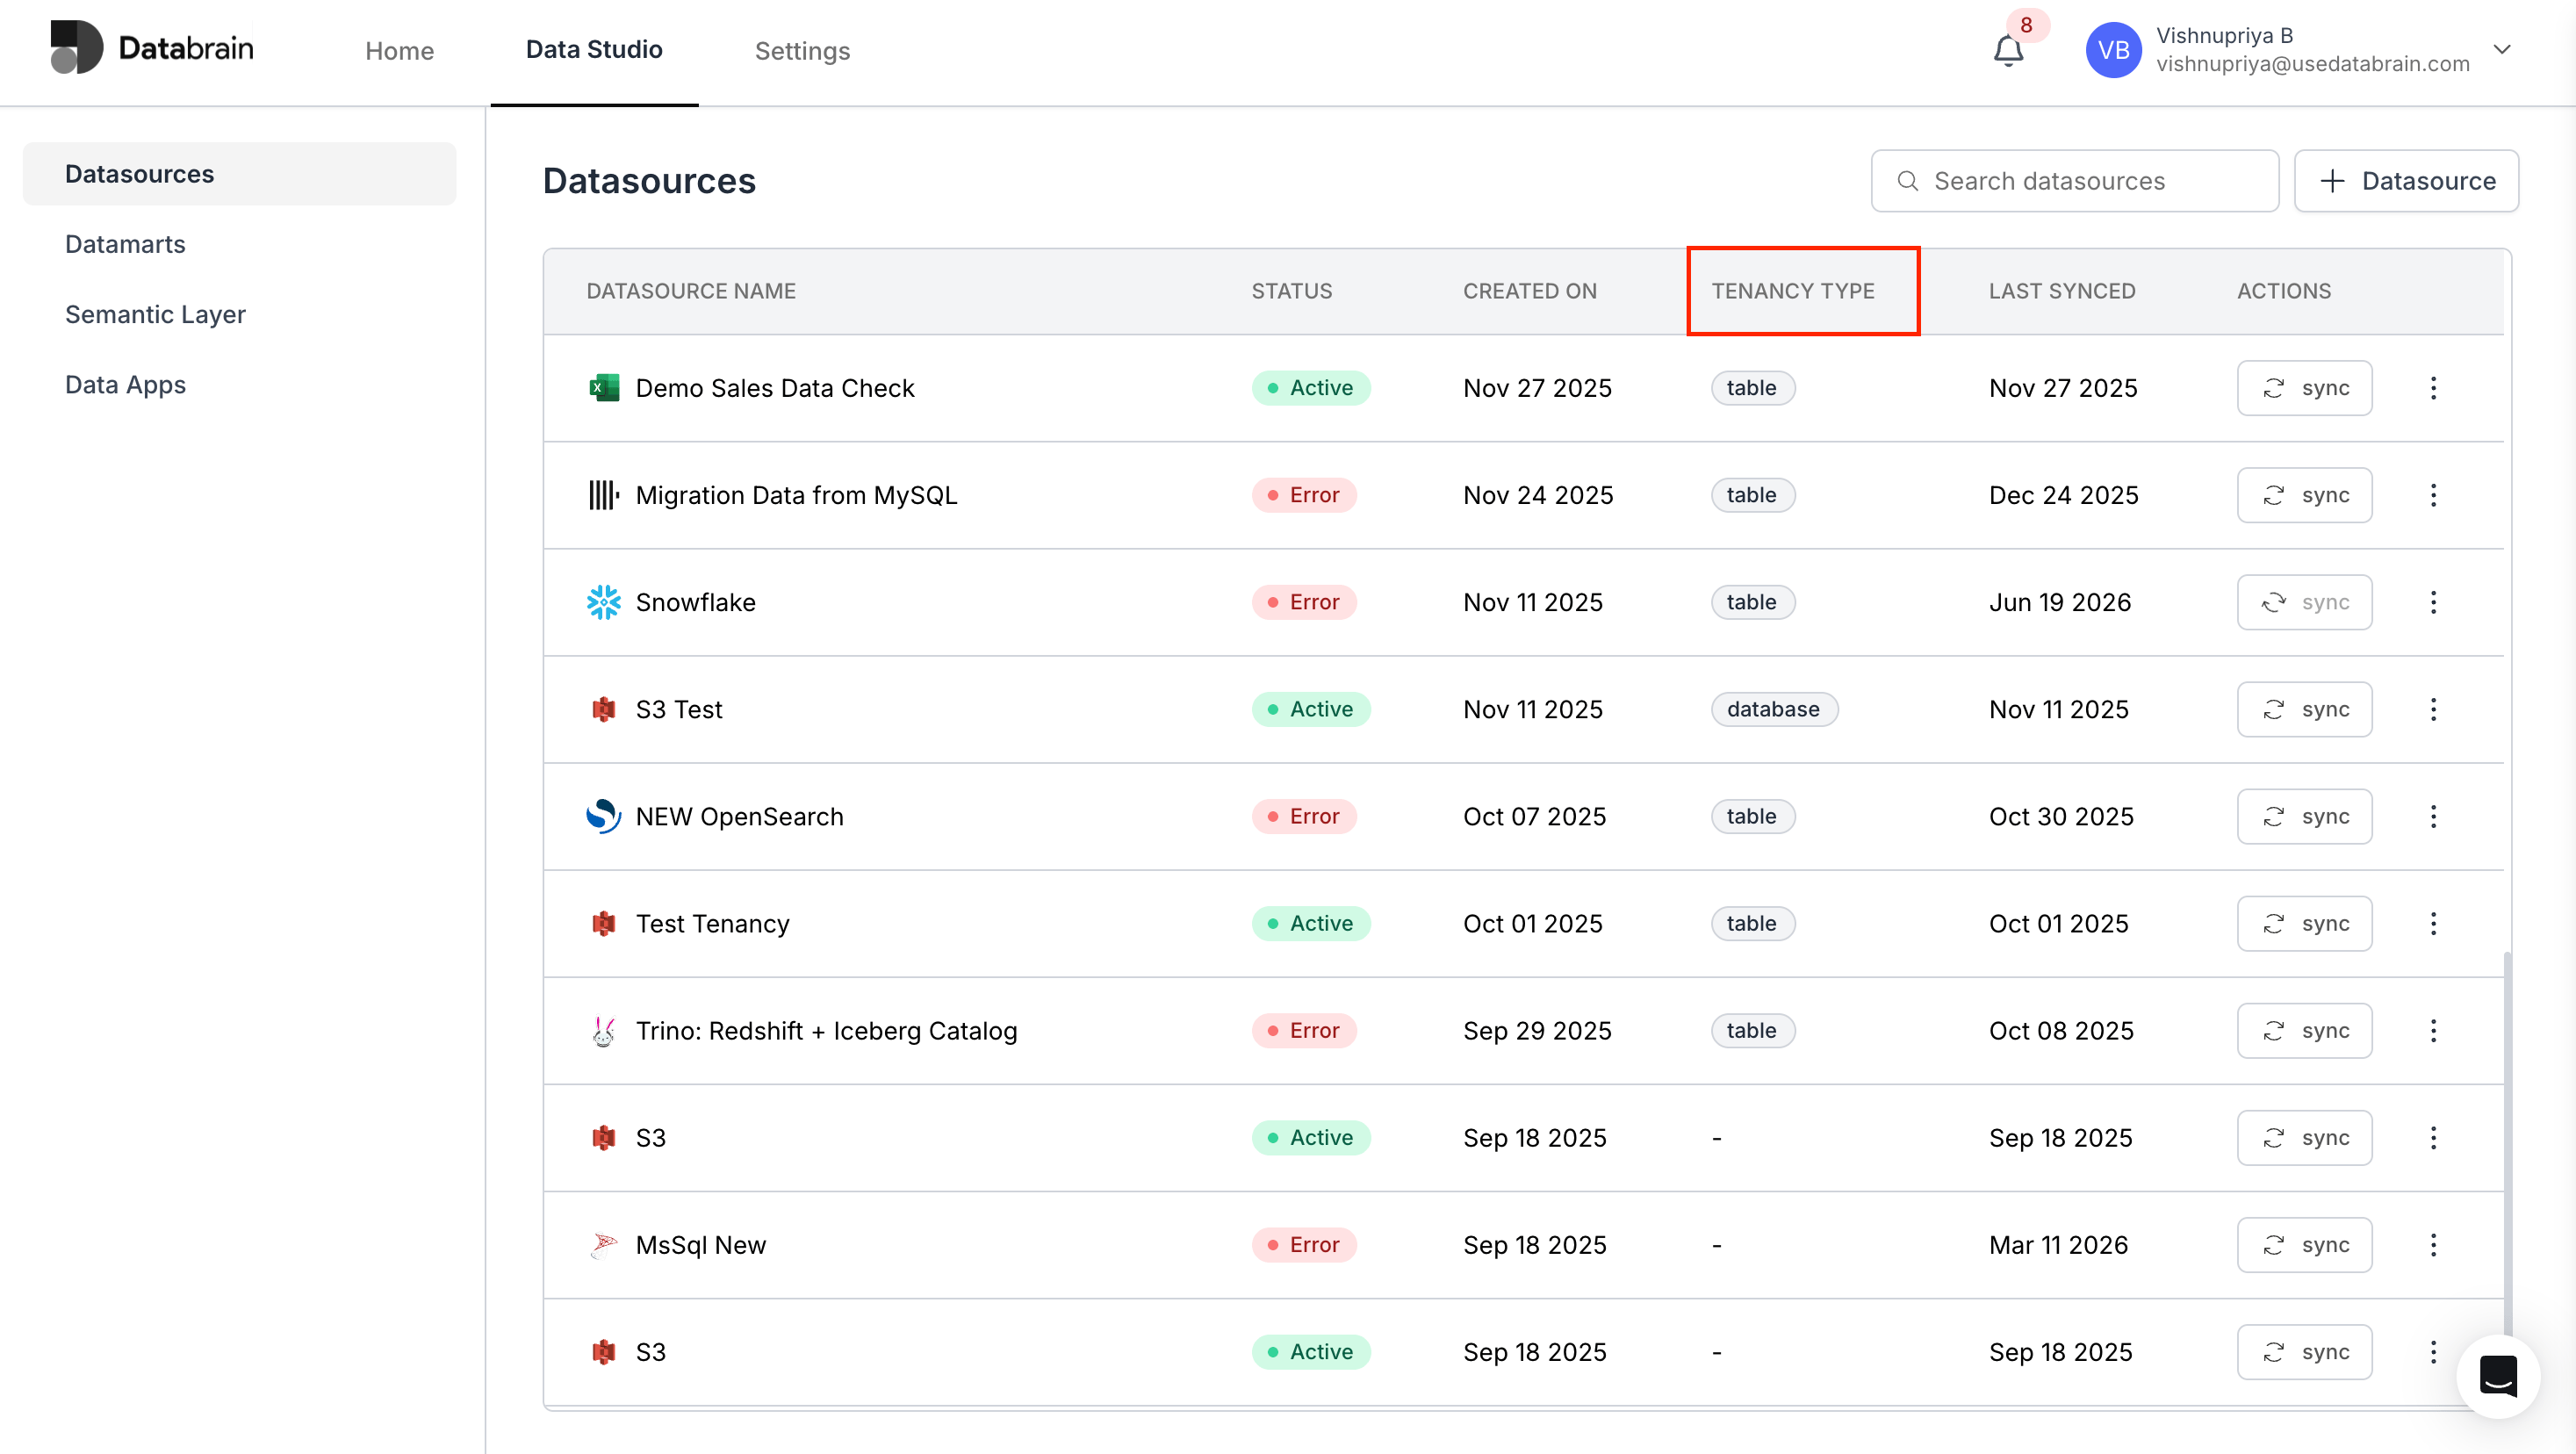
- Adding Tenancy Column to Datasource Page:
Added a Tenancy column on the Datasource page to display each datasource’s tenancy as a badge.
Fixes:
-
Pivot Table V3 Downloads:
Fixed an issue where Pivot Table V3 downloads did not include calculated measures from Pivot Settings. -
Athena Dashboard Metric Download:
Fixed an issue in the Athena dashboard metric download flow when a row limit was applied. -
Datamart Table Selection:
Fixed an issue in Datamart table selection where Select All Tables selected all datamart tables instead of only the filtered search results.
0.16.55May 28, 2026 Updates
May 28, 2026 Updates
Enhancements:
- Tooltip Dotted Data Point Line:
We have implemented the ability to manage dotted data point lines in chart settings.
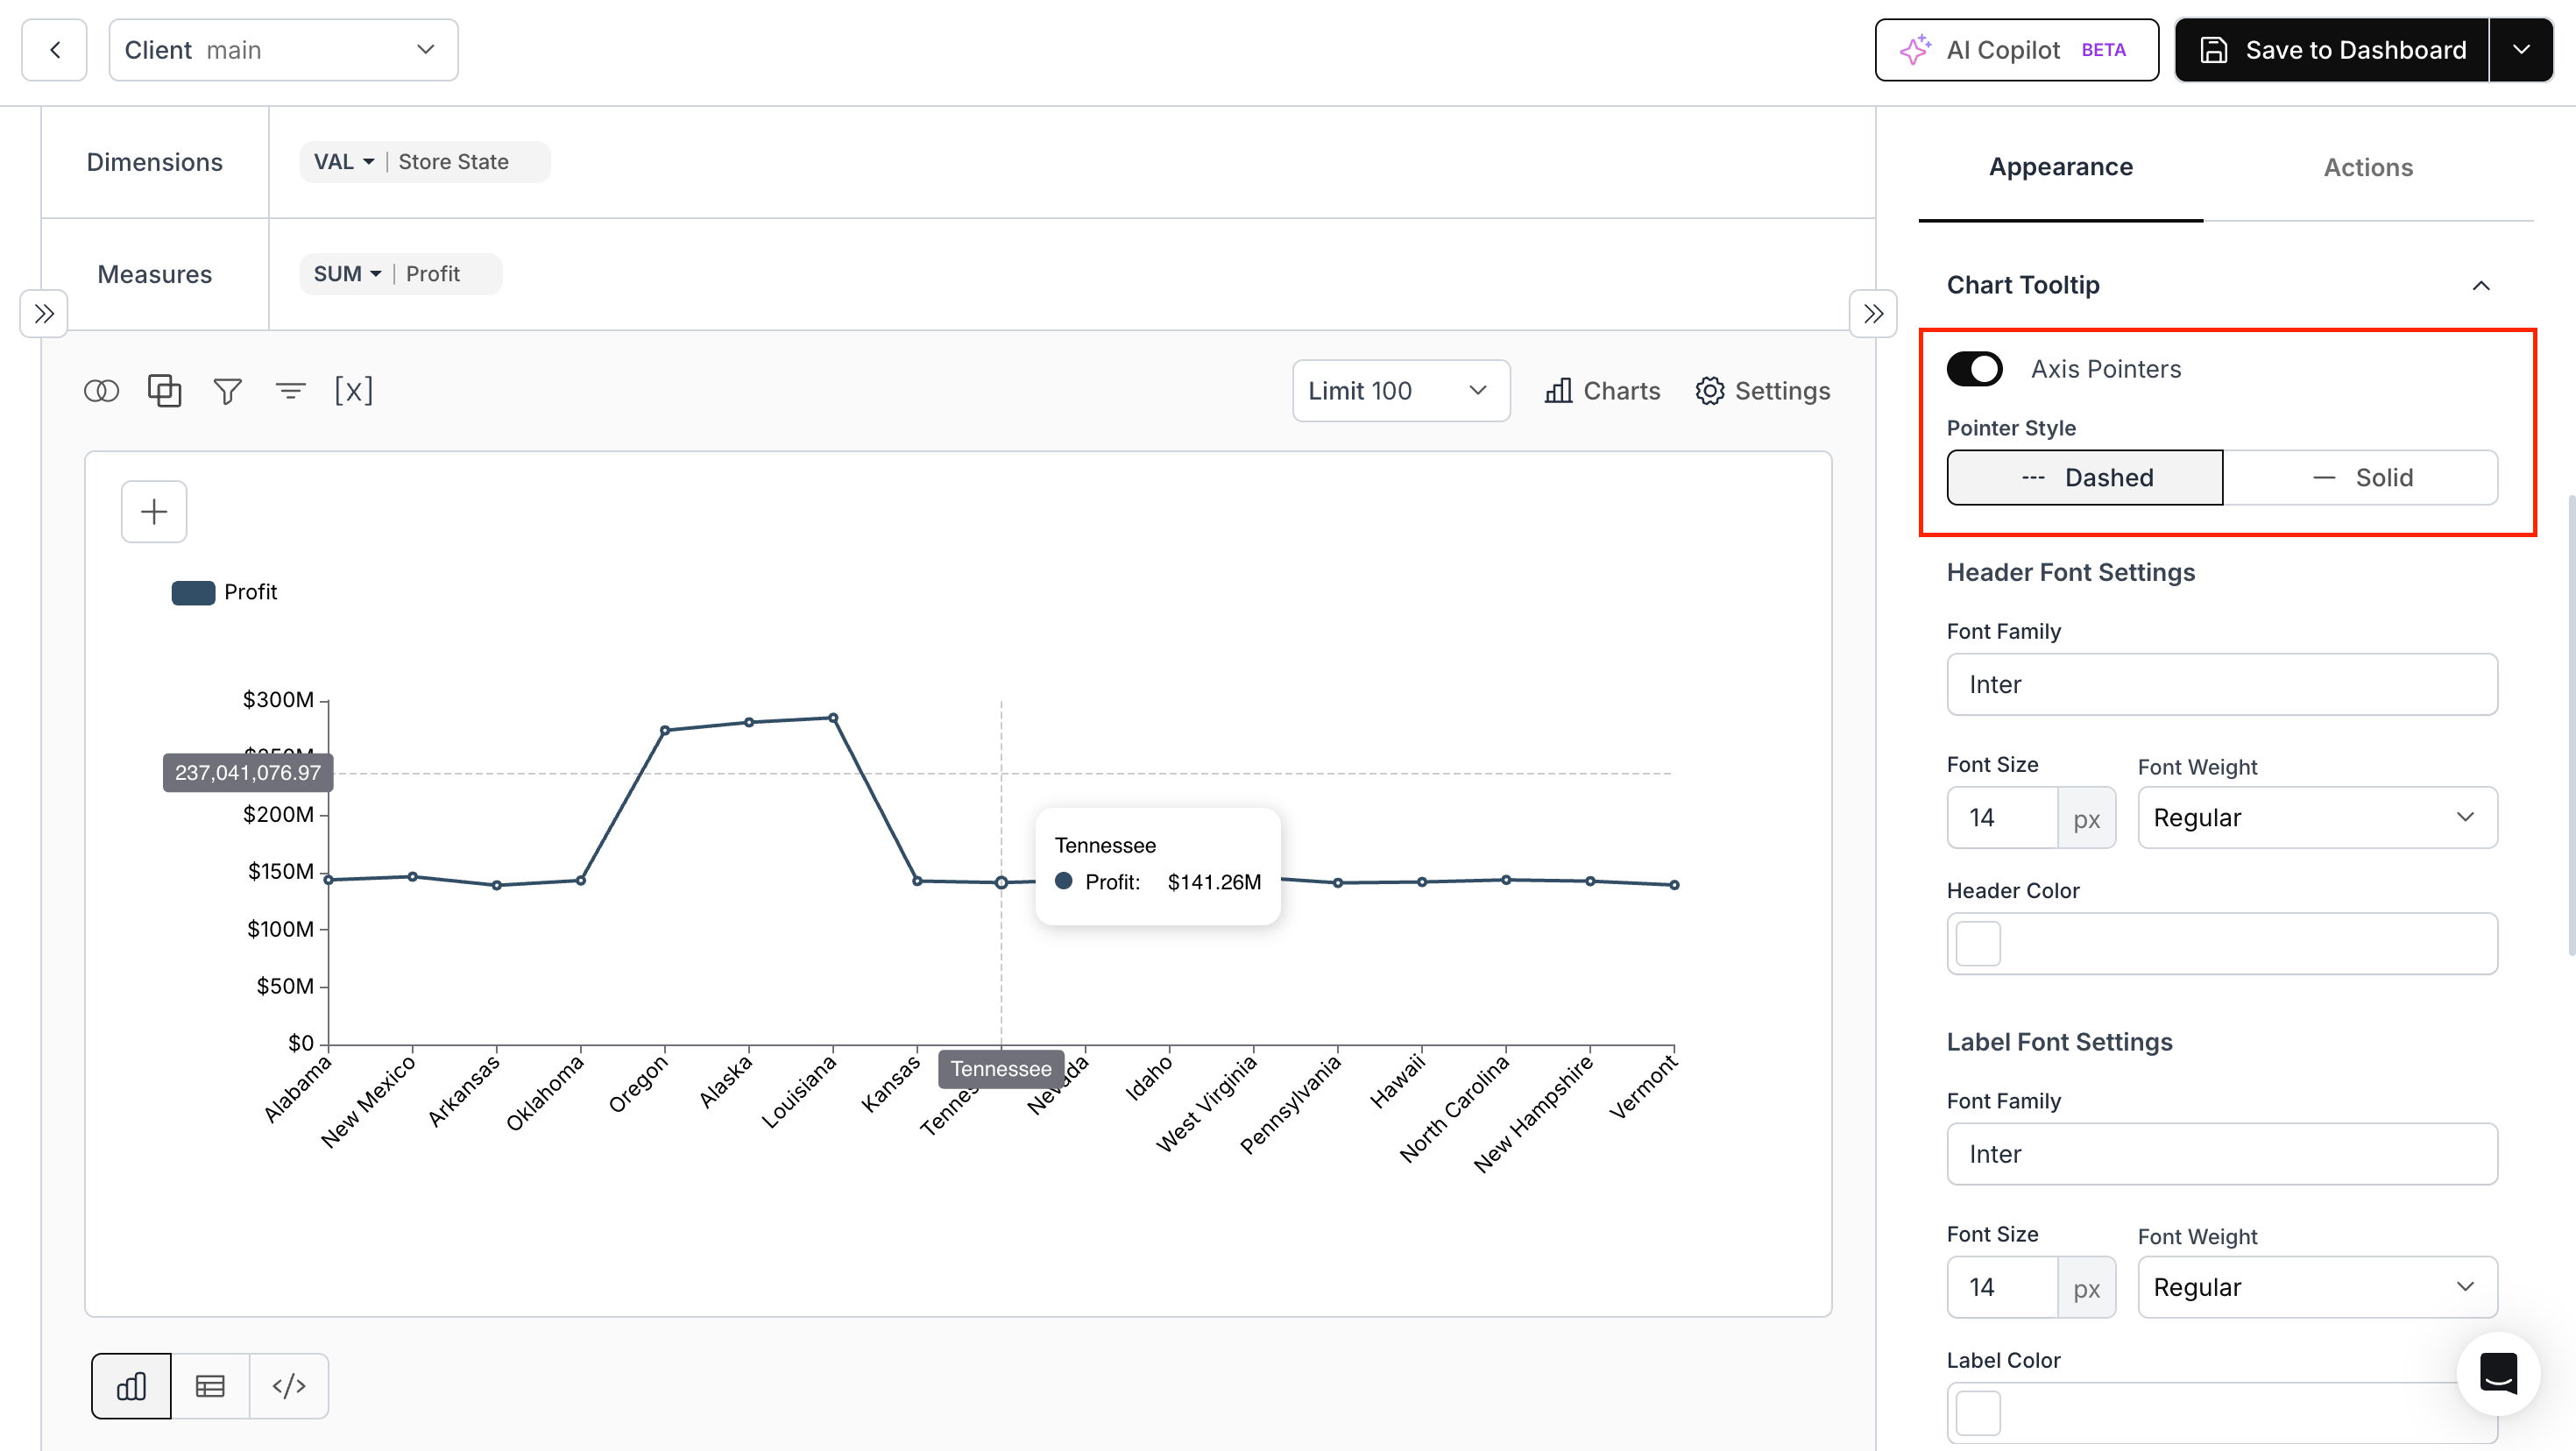
-
Styling the Tooltip Container:
We have added a prop to style the tooltip card, including padding, border radius, background color, and border color. -
Hide the Adjust Spacing Feature in Customize Layout:
We have included a prop to hide the Adjust Spacing feature in the Customize Layout section. -
Display All Chart Settings:
We have added a prop that bypasses the default chart settings and displays all possible settings, unless otherwise configured through custom-chart-settings. -
Customize Available Chart Types in End User Create Metric:
We have added a prop that allows users to customize the available chart types in the End User Create Metric feature. -
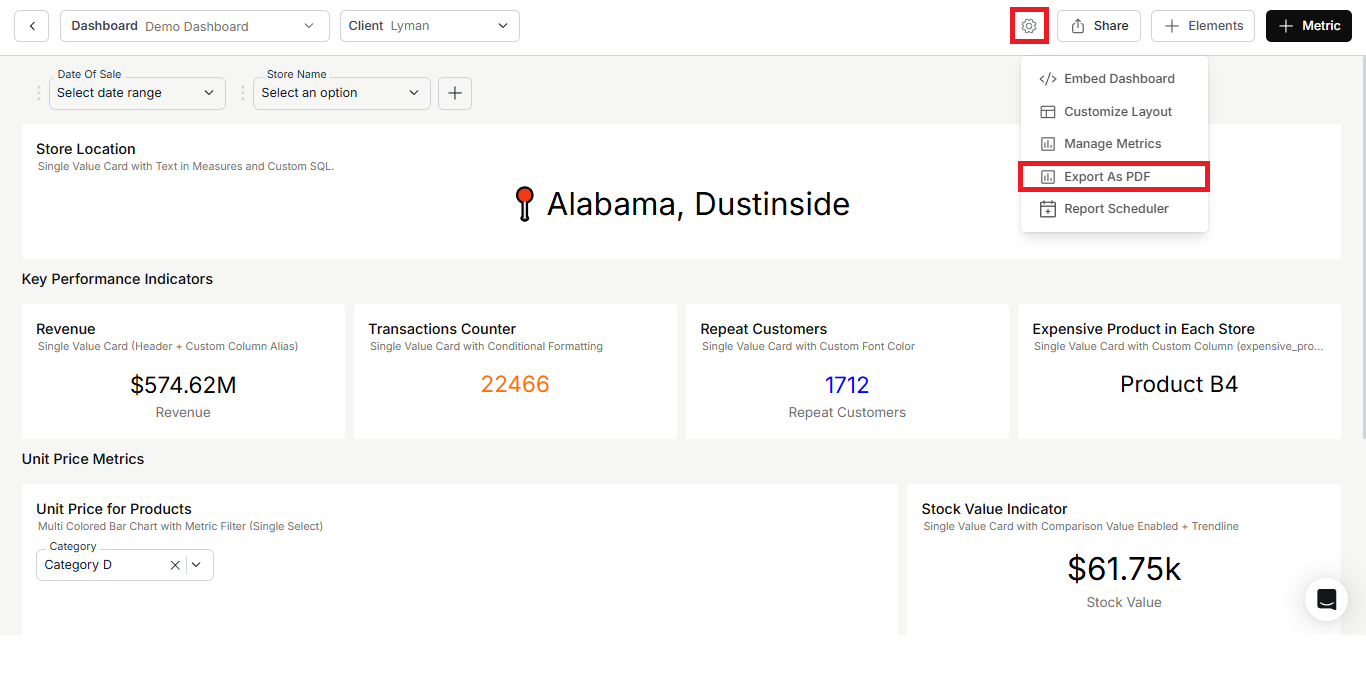
Export As PDF Server Events:
We have added server events to monitor the initiation and completion of the Export As PDF operation.
Fixes:
-
Hide Enabled Columns for Respective Roles in Datamart:
Columns can now be hidden for specific roles when the Hide To function is enabled. -
Update Dashboard API Error Message:
The API now returns a proper error message instead of a 500 error for an invalidworkspaceName. -
Pivot V3 Calculated Columns:
We have resolved an issue where exponent-type numeric data, such as1.91618e-11, was treated as-. -
Dashboard Workspace API Validation:
Passing an invalid filter name to the Dashboard Workspace API now returns an error response instead of a success response. -
Dynamic Properties Filtering:
We have fixed an issue where Dynamic Properties were not filtering correctly when Dashboard Filters changed. -
Board’s Metric Filter:
We have resolved an issue where a metric filter applied to a board was not removed after deselecting the board.
May 4, 2026 Updates
May 4, 2026 Updates
Features:
-
Update Dashboard Filter in Update Dashboard API:
Support has been added for updating dashboard filters via the Create Dashboard Embed API. -
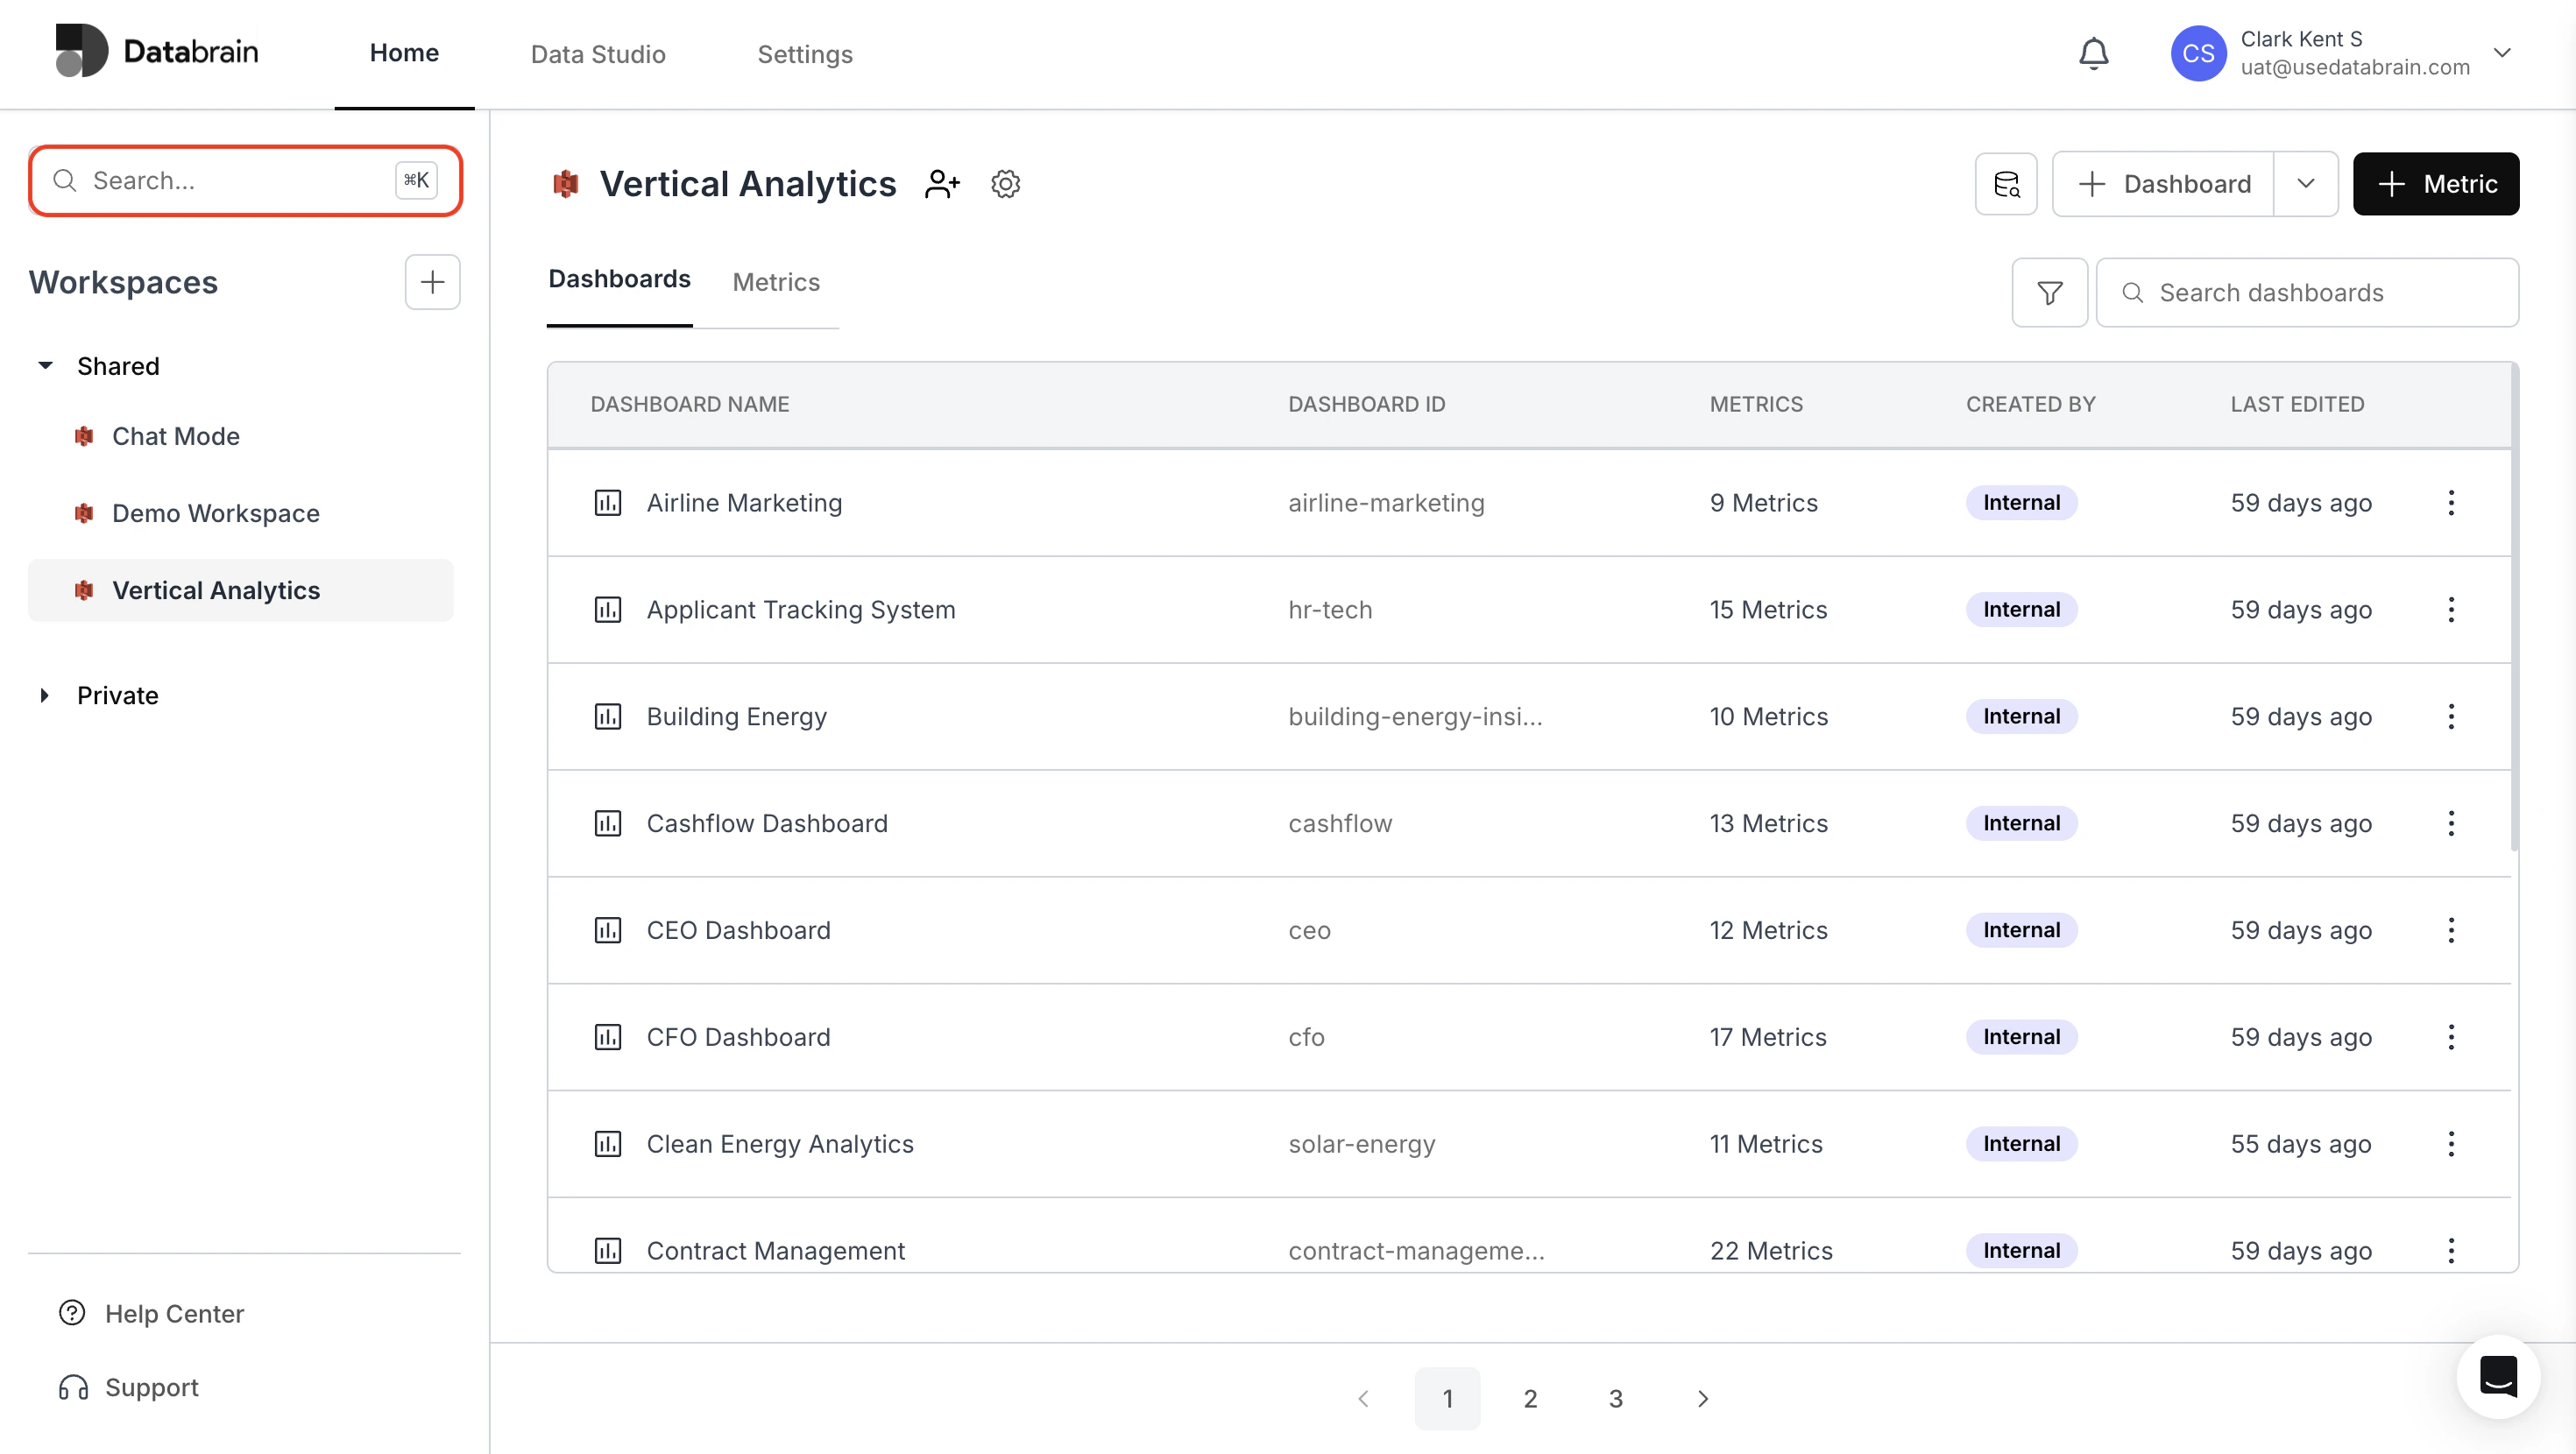
Global Search Feature:
You can now search for any workspace, dashboard, or metric within your account.
Enhancements:
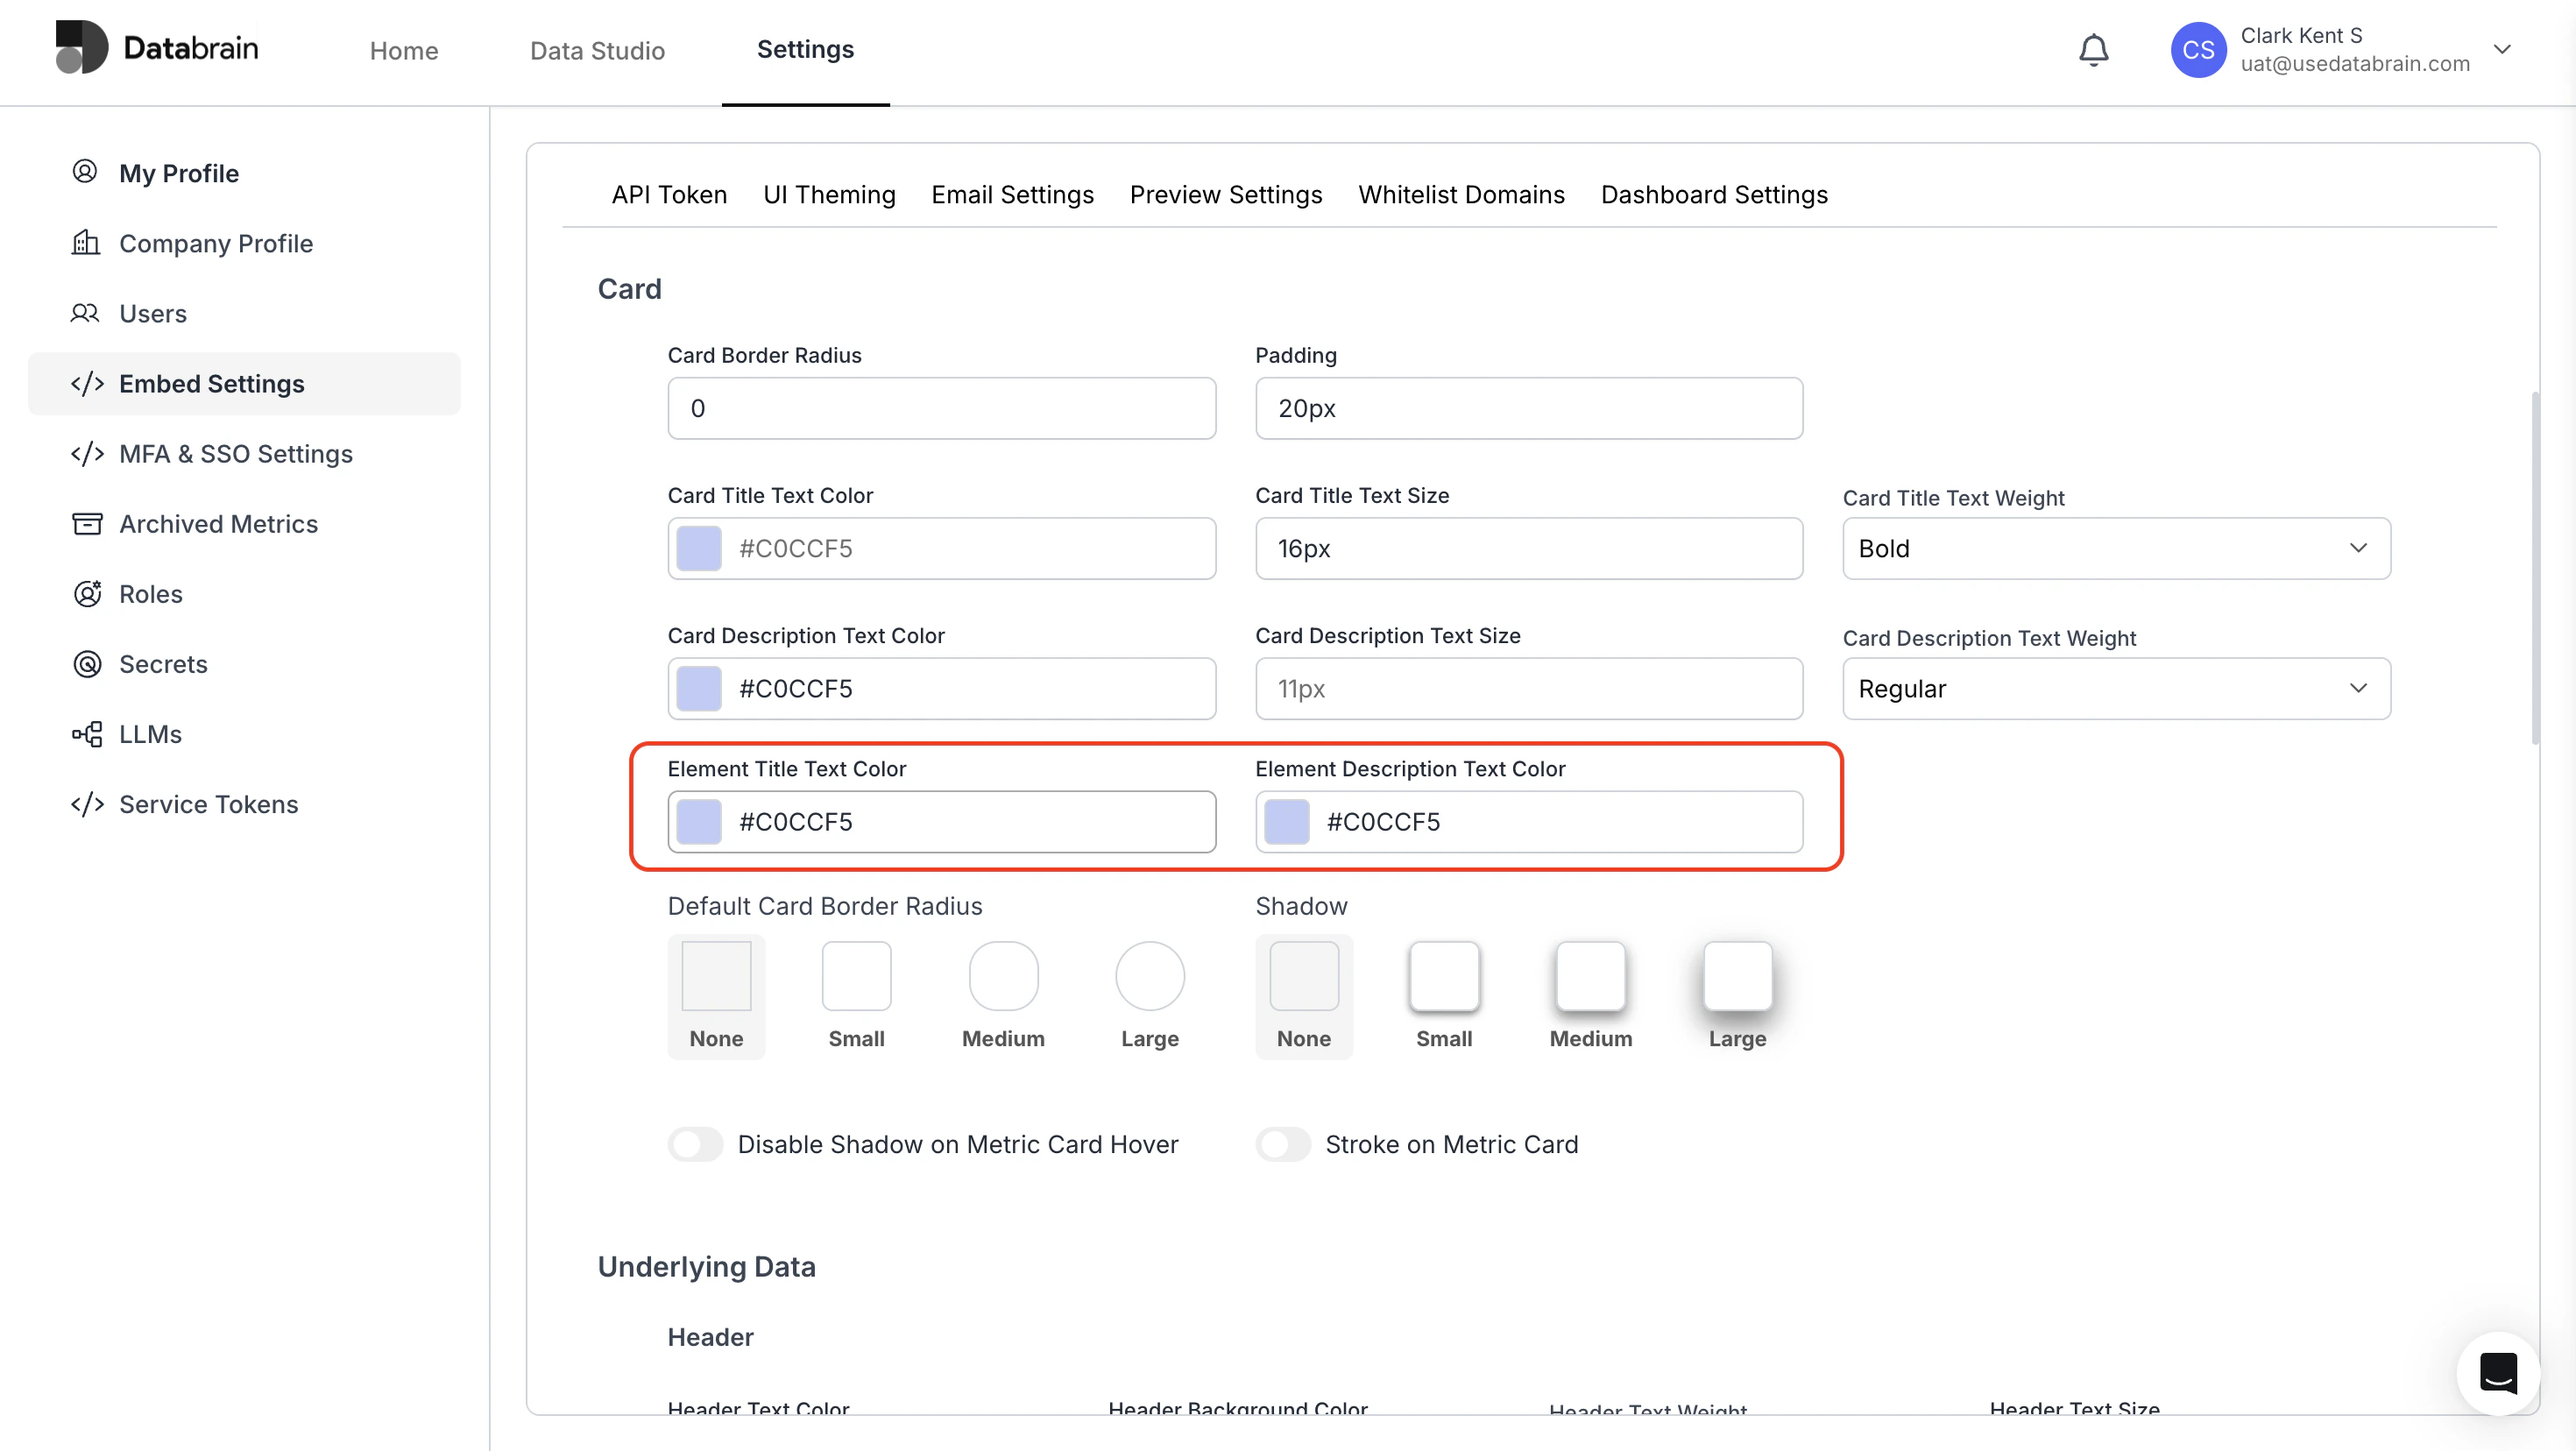
- Dashboard Element Font Color in UI Theming Page:
Added support for customizing dashboard element font color in the UI theming page.
-
Dashboard Component Customization:
Introduced props for:
Fixes:
-
Scheduling & Formatting
- Added support for scheduling reports in minutes.
- Resolved issues with duration-based conditional formatting.
-
Pivot Table Improvements (V2 & V3)
- Fixed rendering issues with multiple dimensions.
- Corrected incorrect (0) values in numerical dimensions.
-
Dashboard UI & Layout Fixes
- Fixed overlapping axis labels in horizontal bar charts (embed).
- Resolved alignment issues in single value cards.
- Fixed font size randomly reducing.
- Removed left padding in top-level filters.
-
Dropdown & Data Sync Issues
- Fixed client dropdown not reflecting updated primary key changes.
- Resolved missing dropdown options in dashboard view.
-
SQL Editor:
Fixed an issue where comments were removed during execution due to auto-formatting. -
Authentication & Data Integrity
- Fixed expired guest token issues in scheduled email reports.
- Resolved duplicate column issues in MSSQL metric creation.
-
Datamart & Metric Consistency:
Fixed an issue where deleted datamart columns continued to appear in the network tab, causing custom columns to show connection errors and invalid metrics to expose the fullscreen action.
April 22, 2026 Updates
April 22, 2026 Updates
Features:
- Alerts:
We have introduced a new feature, Alerts, which notifies users when there is an error in the data source connection or when a datamart is broken, making the dashboard unviewable.
Enhancements:
- Color Selection from Colors Tab:
Users can now drag and reorder colors directly from the Colors tab.
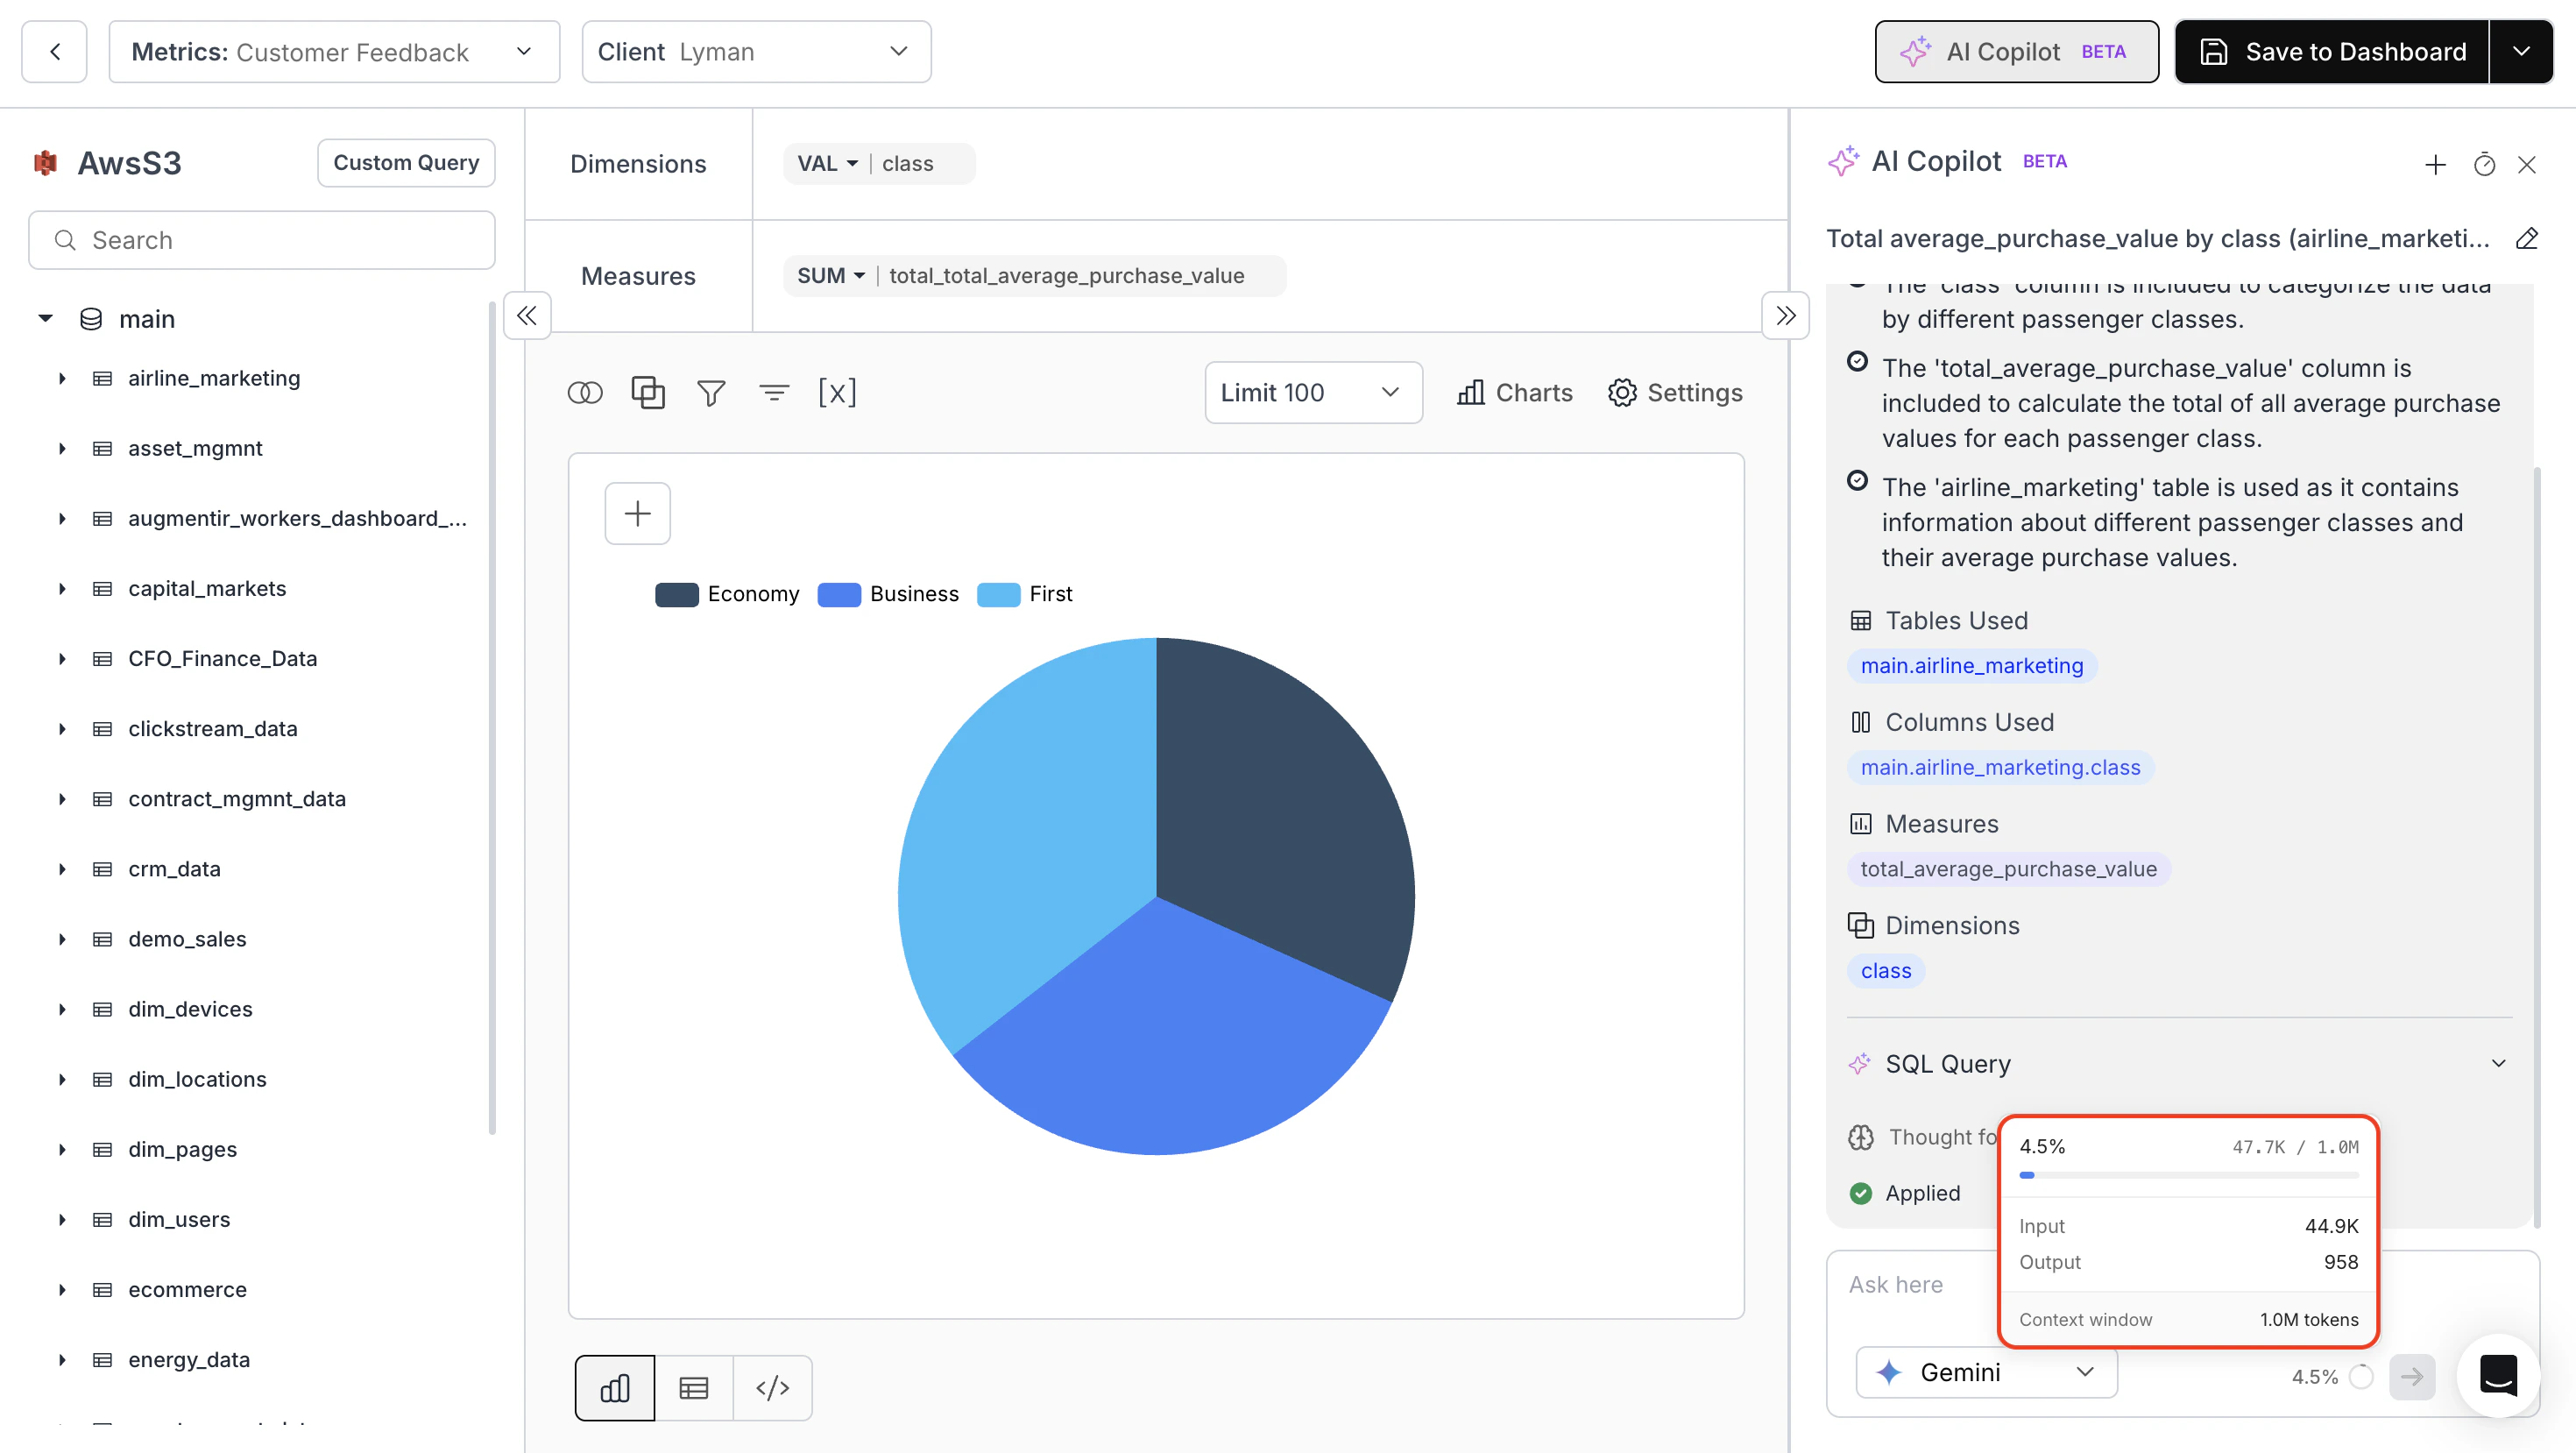
- Context Window Indicator in AI Copilot:
Displays token usage per session (input and output). The limit varies by LLM and determines how much conversation can be retained. Once reached, the chat cannot continue.
- Delete Datamart API:
Added validation and improved error messaging to prevent the deletion of datamarts that are connected to a workspace.
Fixes:
-
Pivot Table V3:
Fixed an issue where conditional formatting was not rendering when a suffix was applied. -
Horizontal Bar Chart:
Added support for the Group By functionality. -
Elasticsearch:
Fixed issues related to schema sync and index handling.
The DataBrain Team.
April 13, 2026 Updates
April 13, 2026 Updates
@databrainhq/mcp-server v0.2.0) — a new way to manage embedded analytics through your AI assistant.What is it?
The MCP server implements the Model Context Protocol, connecting AI assistants like Cursor, Claude Desktop, Claude Code, and Windsurf directly to the Databrain API. Describe what you want in natural language and the assistant handles the rest.Key Features:
- Embed Setup via Conversation: Discover data apps, select dashboards, create embeds, and generate framework-specific frontend code — all through your AI assistant.
- Natural Language Data Querying: Ask questions about your data in plain English. The AI converts them to SQL, executes the query, and returns results with chart suggestions.
- 24 Tools: Full embed lifecycle management — creation, theming, filters, localization, permissions, guest tokens, and code generation.
- 10 Guided Prompts: Pre-built workflows for common tasks like embedding dashboards, multi-tenant setup, branding, and semantic layer management.
- Semantic Layer Management: Populate and maintain table/column descriptions, synonyms, and example questions entirely through MCP tools.
-
Multi-Tenant Support: Create per-client embeds with row-level security using
clientId.
Getting Started:
Set up in 2 minutes — get your service token, add the config to your AI client, and start talking.MCP Server Documentation
April 8, 2026 Updates
April 8, 2026 Updates
Features:
-
Multiple Datamart Connection Support:
Introduced multi-datamart support, allowing users to select and manage multiple datamarts. -
CRUD API Support for Semantic Layer:
Users can now create, rename and update, and delete the Semantic Layer via APIs. -
Delete Workspace API:
Introduced a new DELETE endpoint to enable workspace deletion via API.
Enhancements:
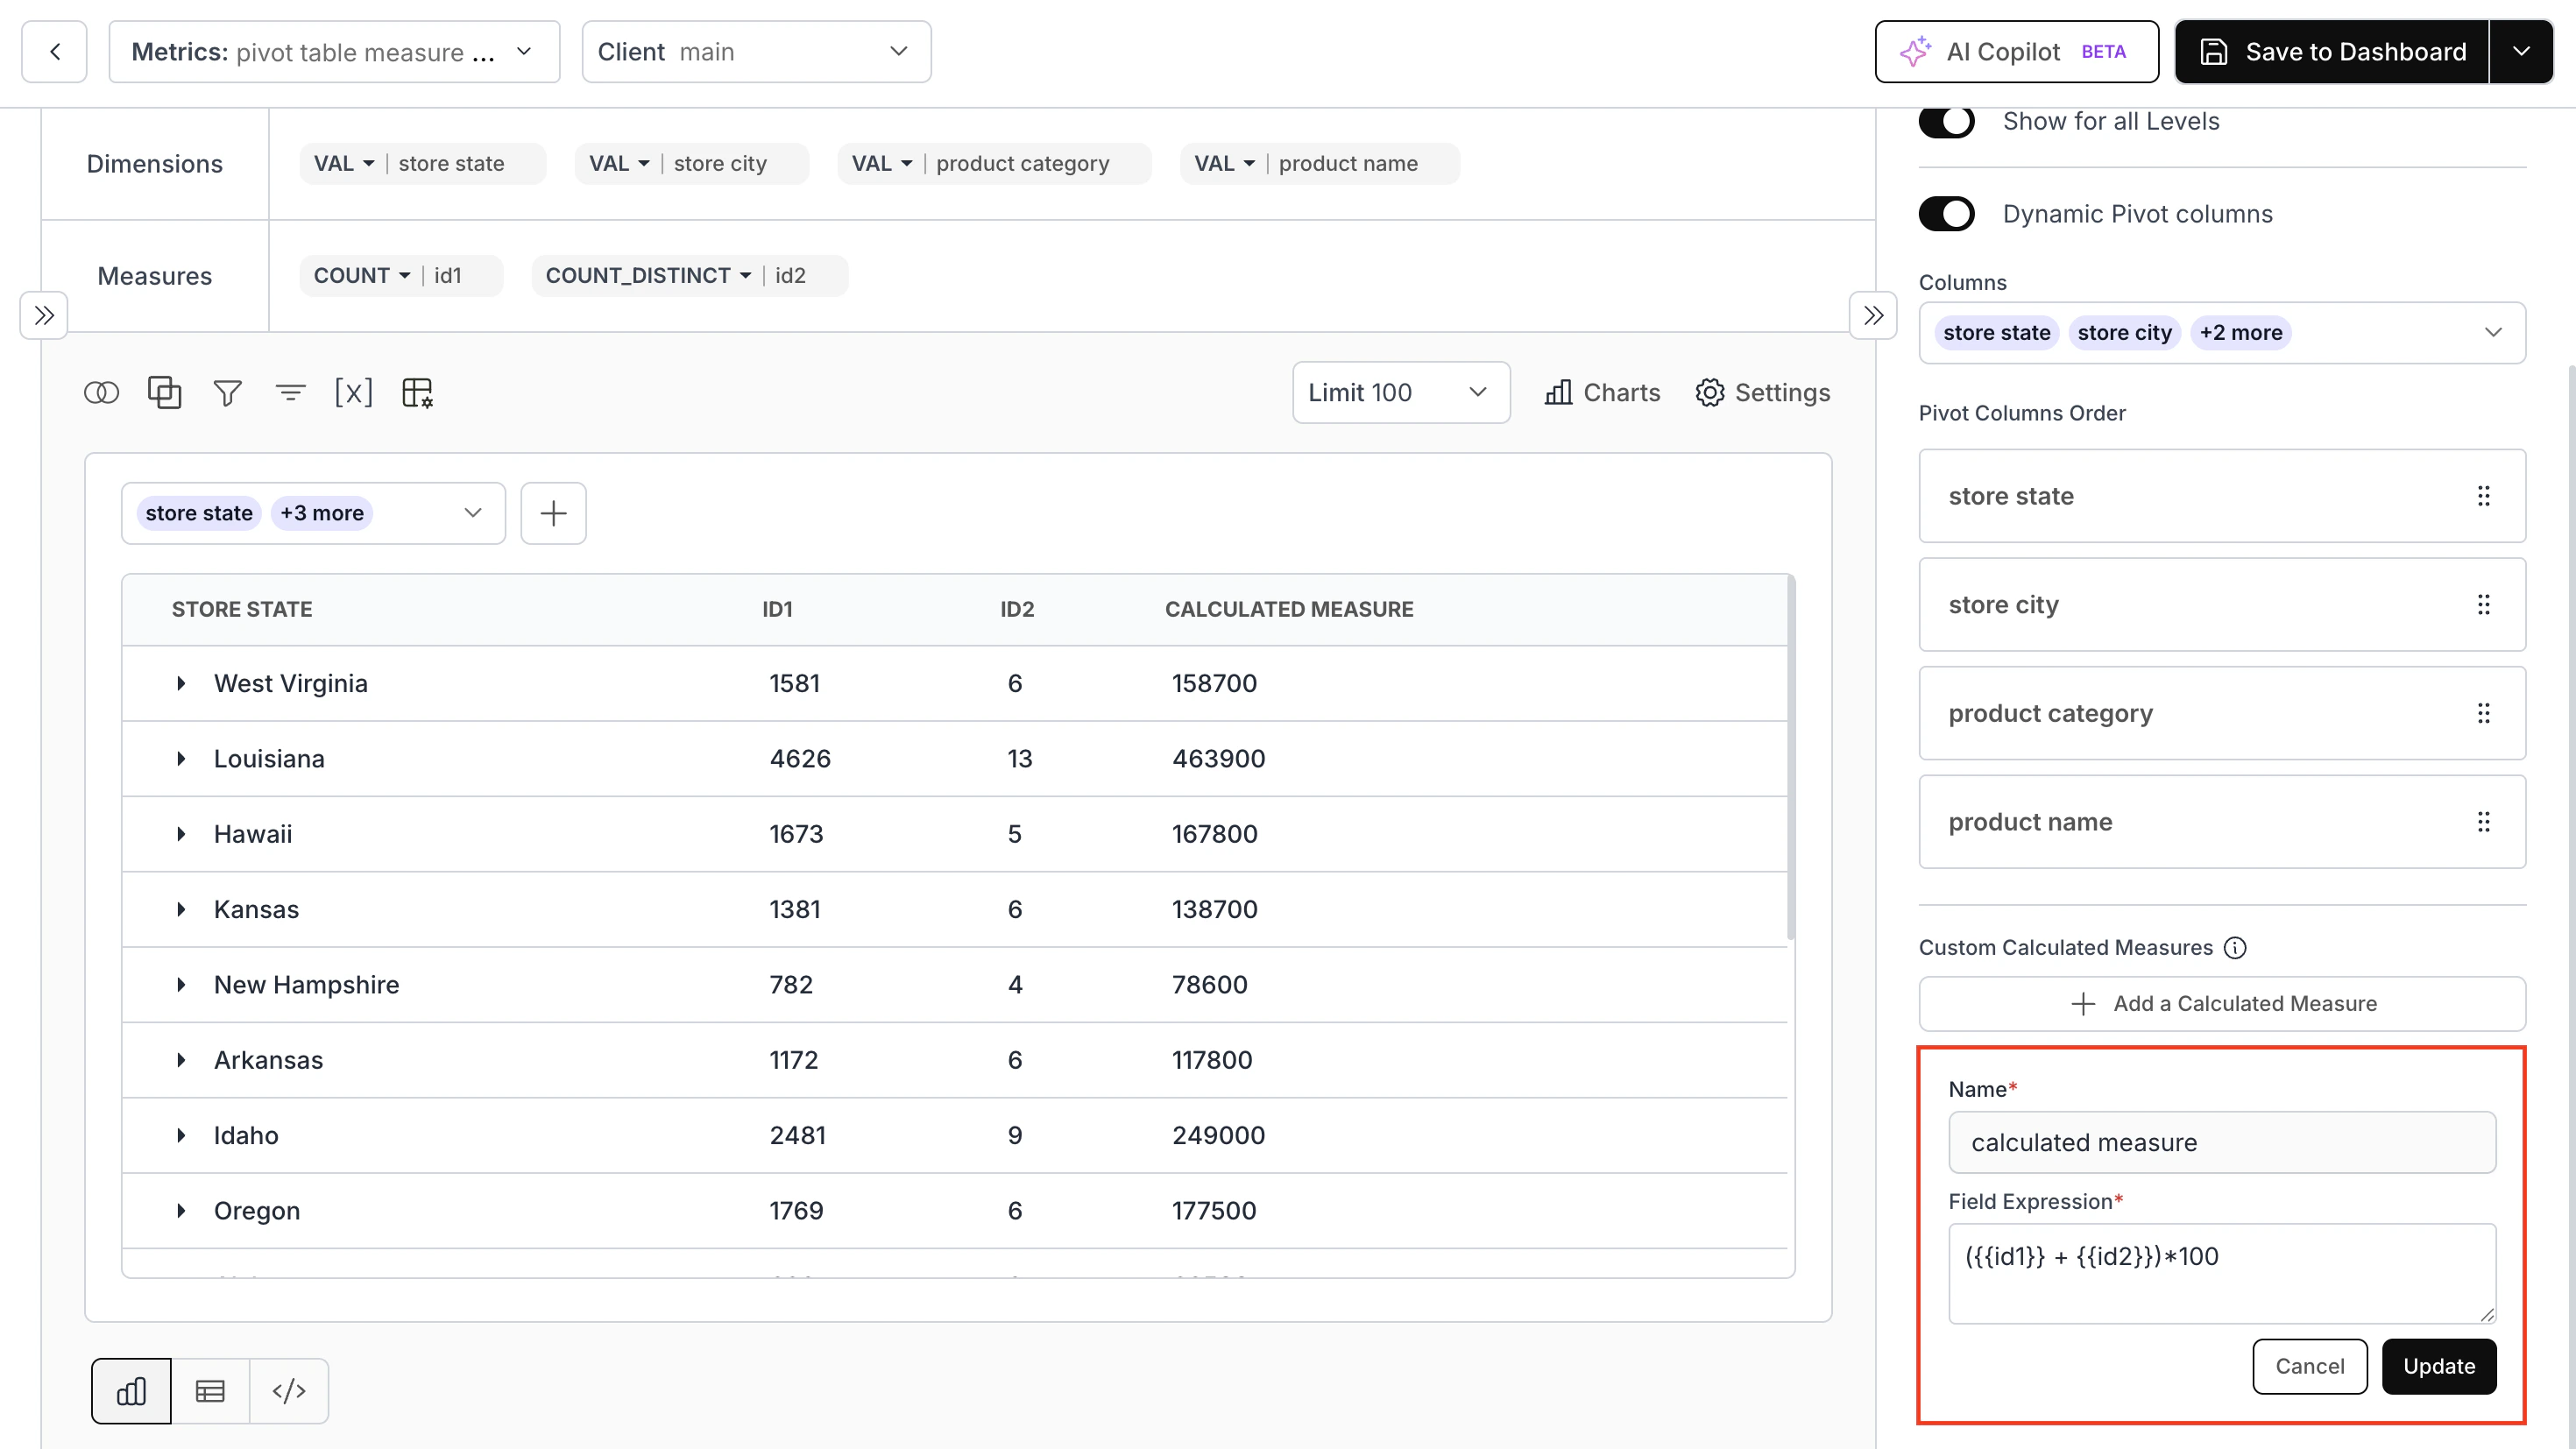
- Pivot Table Chart V3 Calculated Fields:
Added support for custom calculated measures, allowing users to create and edit calculated columns.
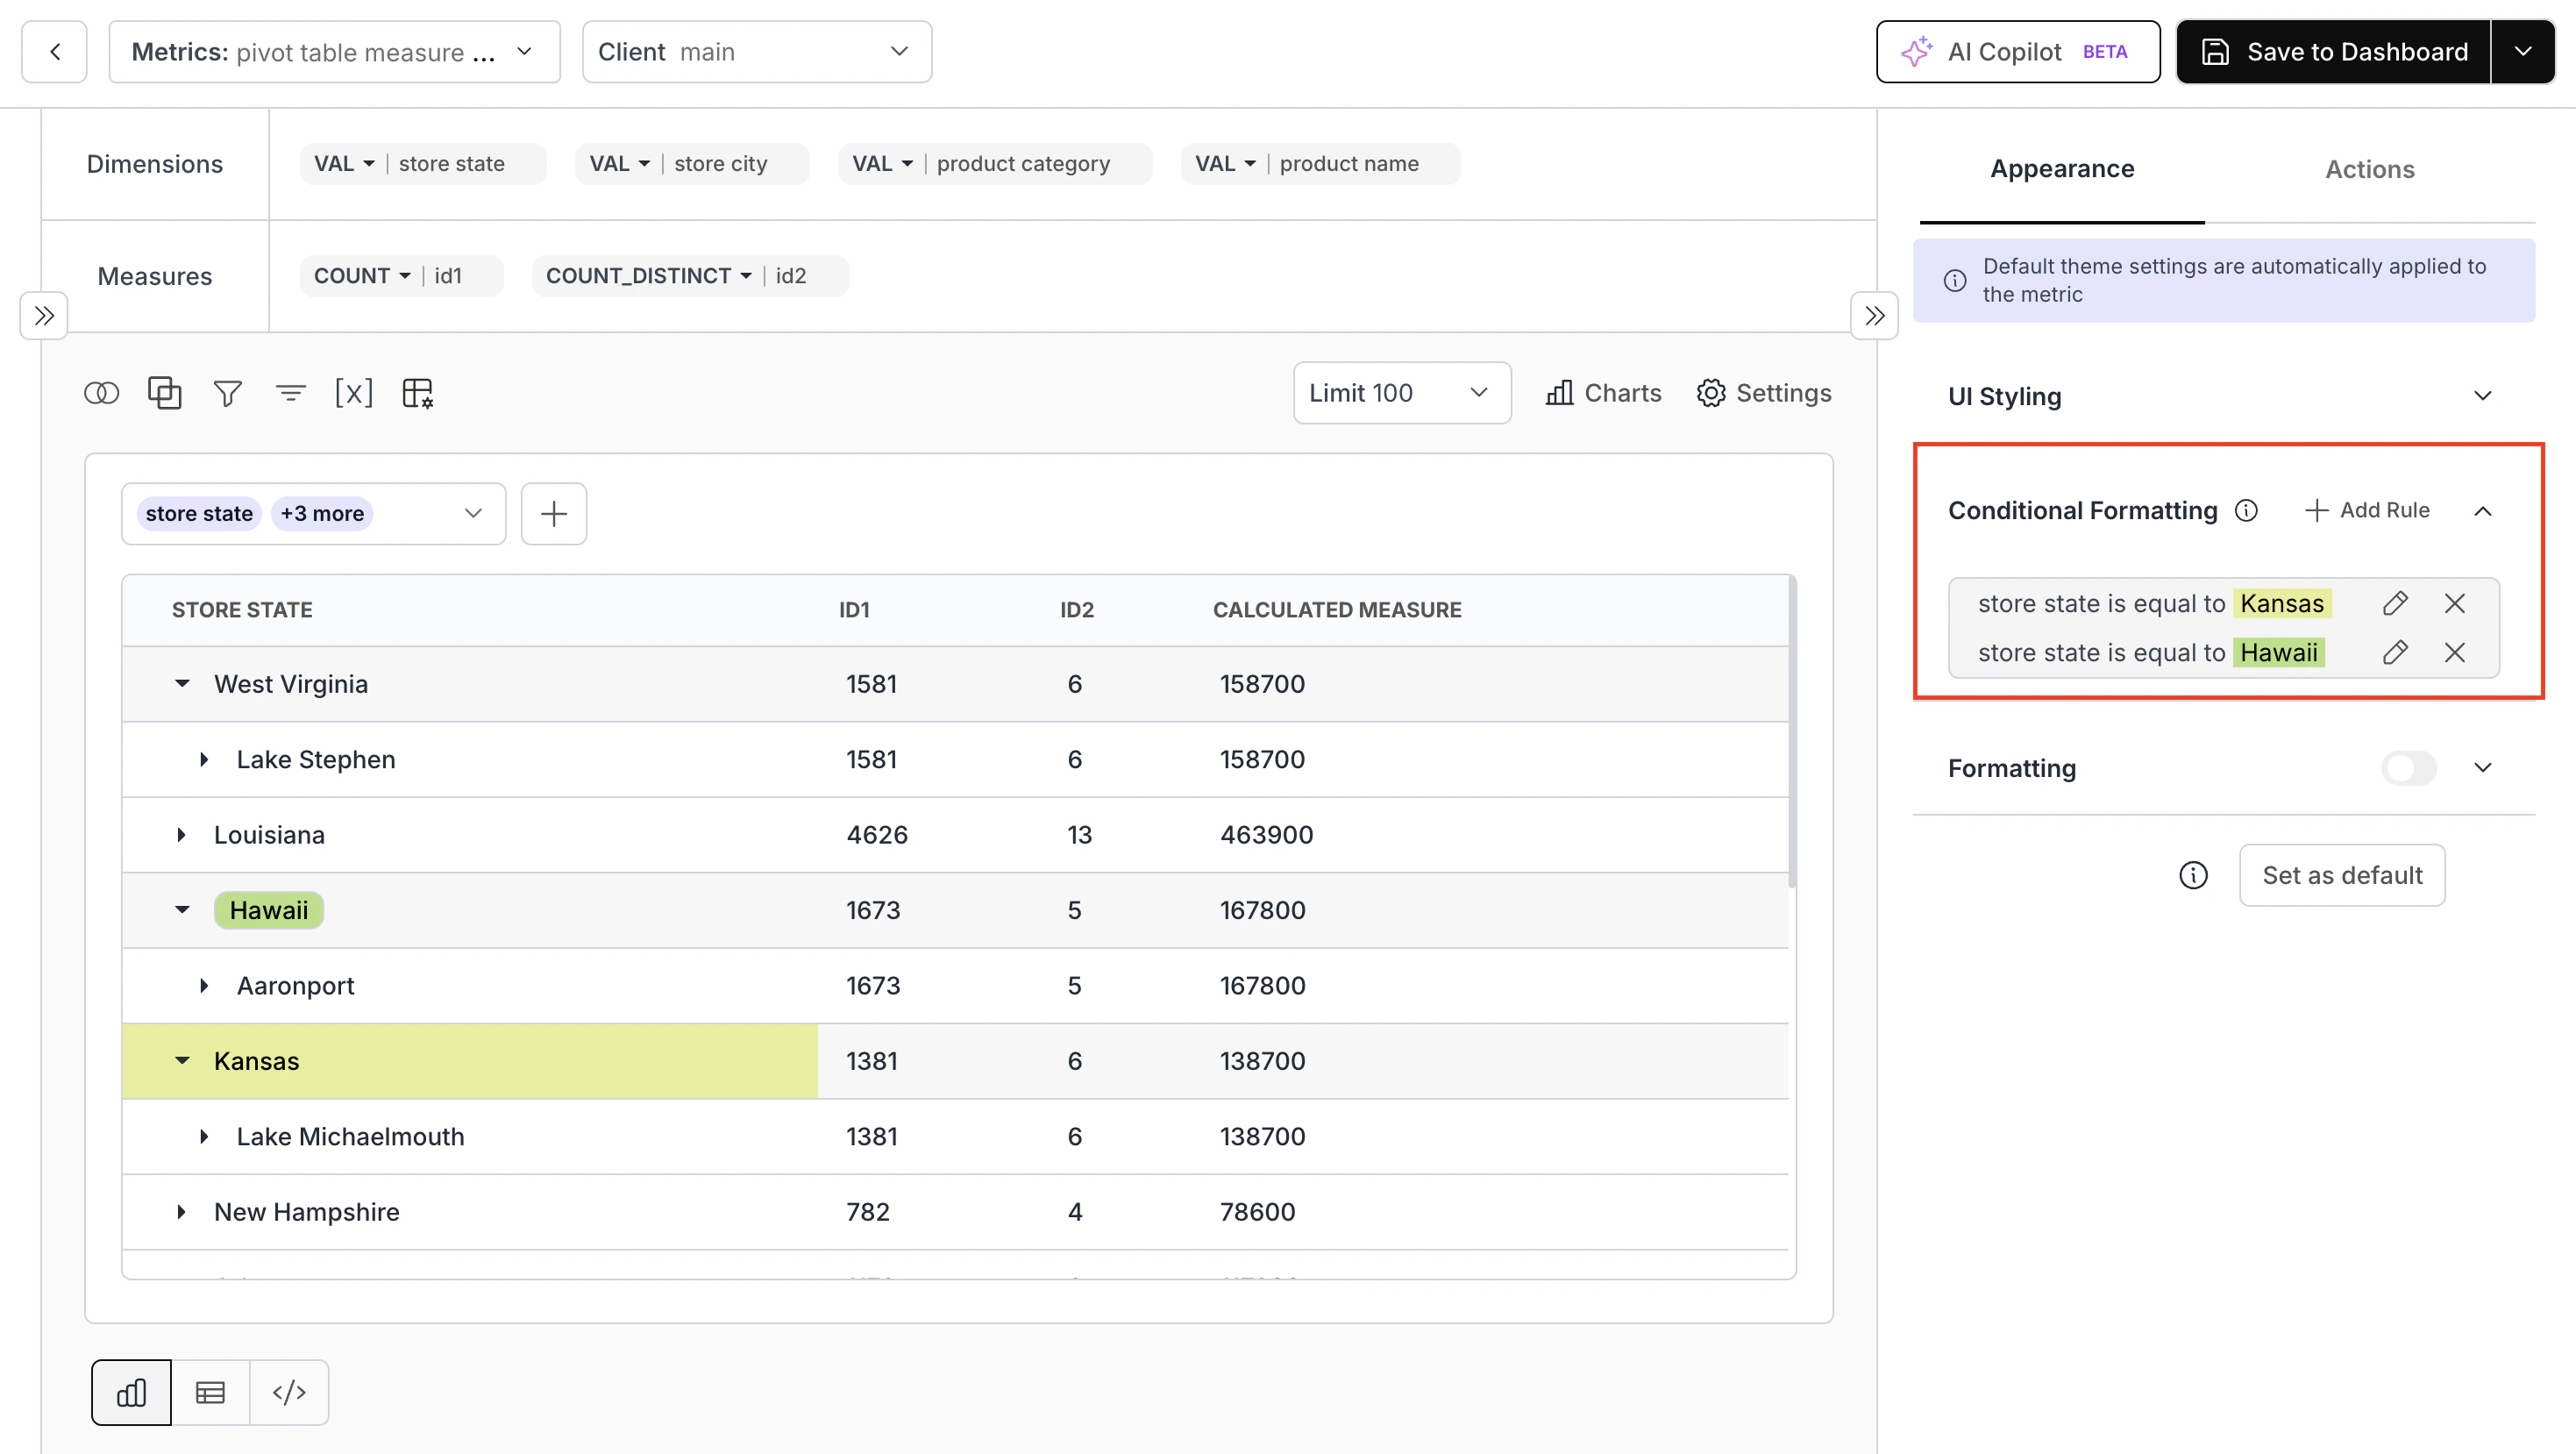
- Add Conditional Formatting Support to Pivot Table V3:
Introduced conditional styling with dynamic badge colors and background styles.
- Refinement of List Datamart API:
We have introduced an
expandDetailsoption to the Datamart List API, enabling users to control the inclusion of detailed properties in responses.
Fixes:
-
Pagination Sync Issue in Table Charts:
Fixed an issue where the default row size option was not in sync with the pagination value for server-side pagination-enabled table charts. -
Plugin Manage Metrics: Messaging & Settings Access:
When all metrics are hidden, an appropriate message will now be displayed. The settings/manage metrics button remains accessible even when all metrics are hidden. -
Addition of Server Events in Embed:
Added server-side event tracking for key user actions, including metric creation/editing, data exploration (search, table selection, drag-and-drop, aggregation), chart changes, dashboard interactions (filters, manage metrics, layout), and exports/downloads. -
Retaining Primary Database Selection in Update Datamart:
Ensured that the primary database selection is preserved during the Update Datamart operation.
The DataBrain Team.
March 30, 2026 Updates
March 30, 2026 Updates
Features:
-
Chart Appearance and Chart Actions Props for End Users:
We have added properties to thedbn-dashboardcomponent that set default values for certain chart settings when a user creates a metric. Additionally, we have introduced properties for each of these settings that can lock the values, making them non-configurable for end users. -
Wildcard Support for OpenSearch:
We have introduced wildcard syntax support for datamart tables, allowing users to specify flexible patterns when creating or updating tables. -
Workspace LLM Configuration via API:
We have introduced optional LLM integration in workspace creation and update processes, allowing users to specify an LLM by name. -
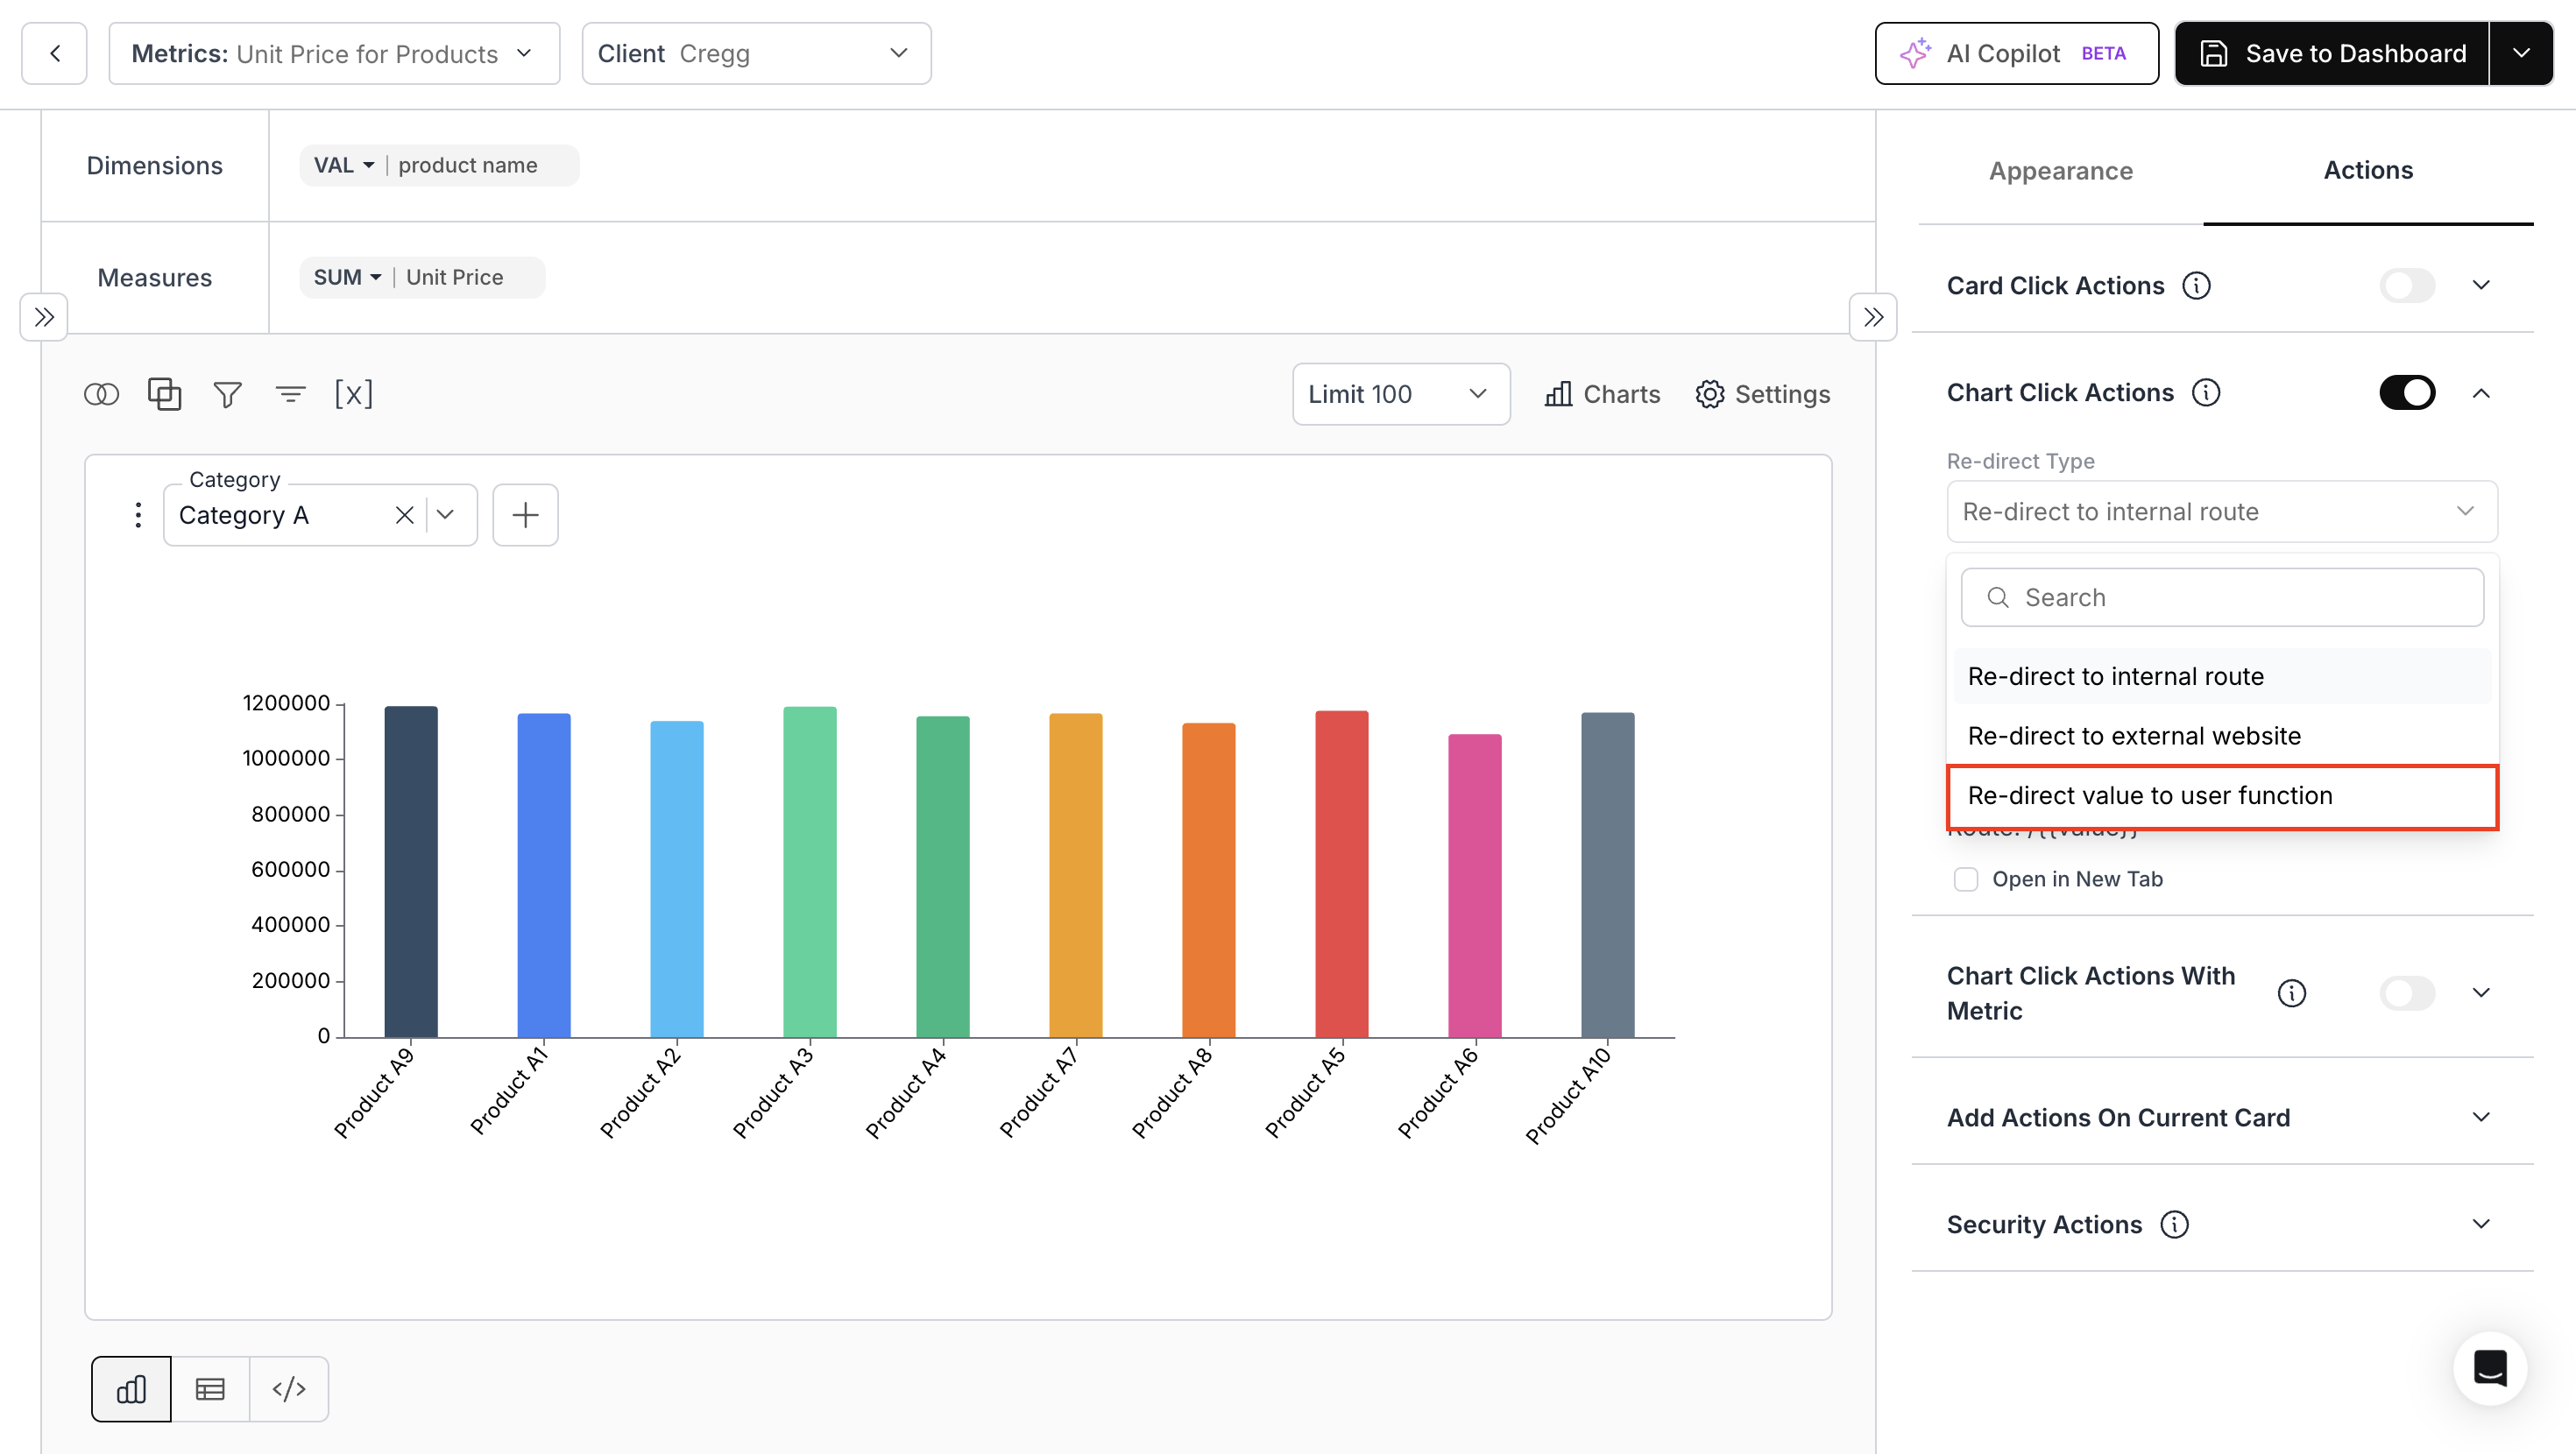
User-Defined Click Action on Charts:
We have introduced achartClickFunctionprop to enable custom click actions on charts. The Pass Complete Data to Function option allows you to pass the entire row data to the function, enabling dynamic customization of the panel content through the prop.
Enhancements:
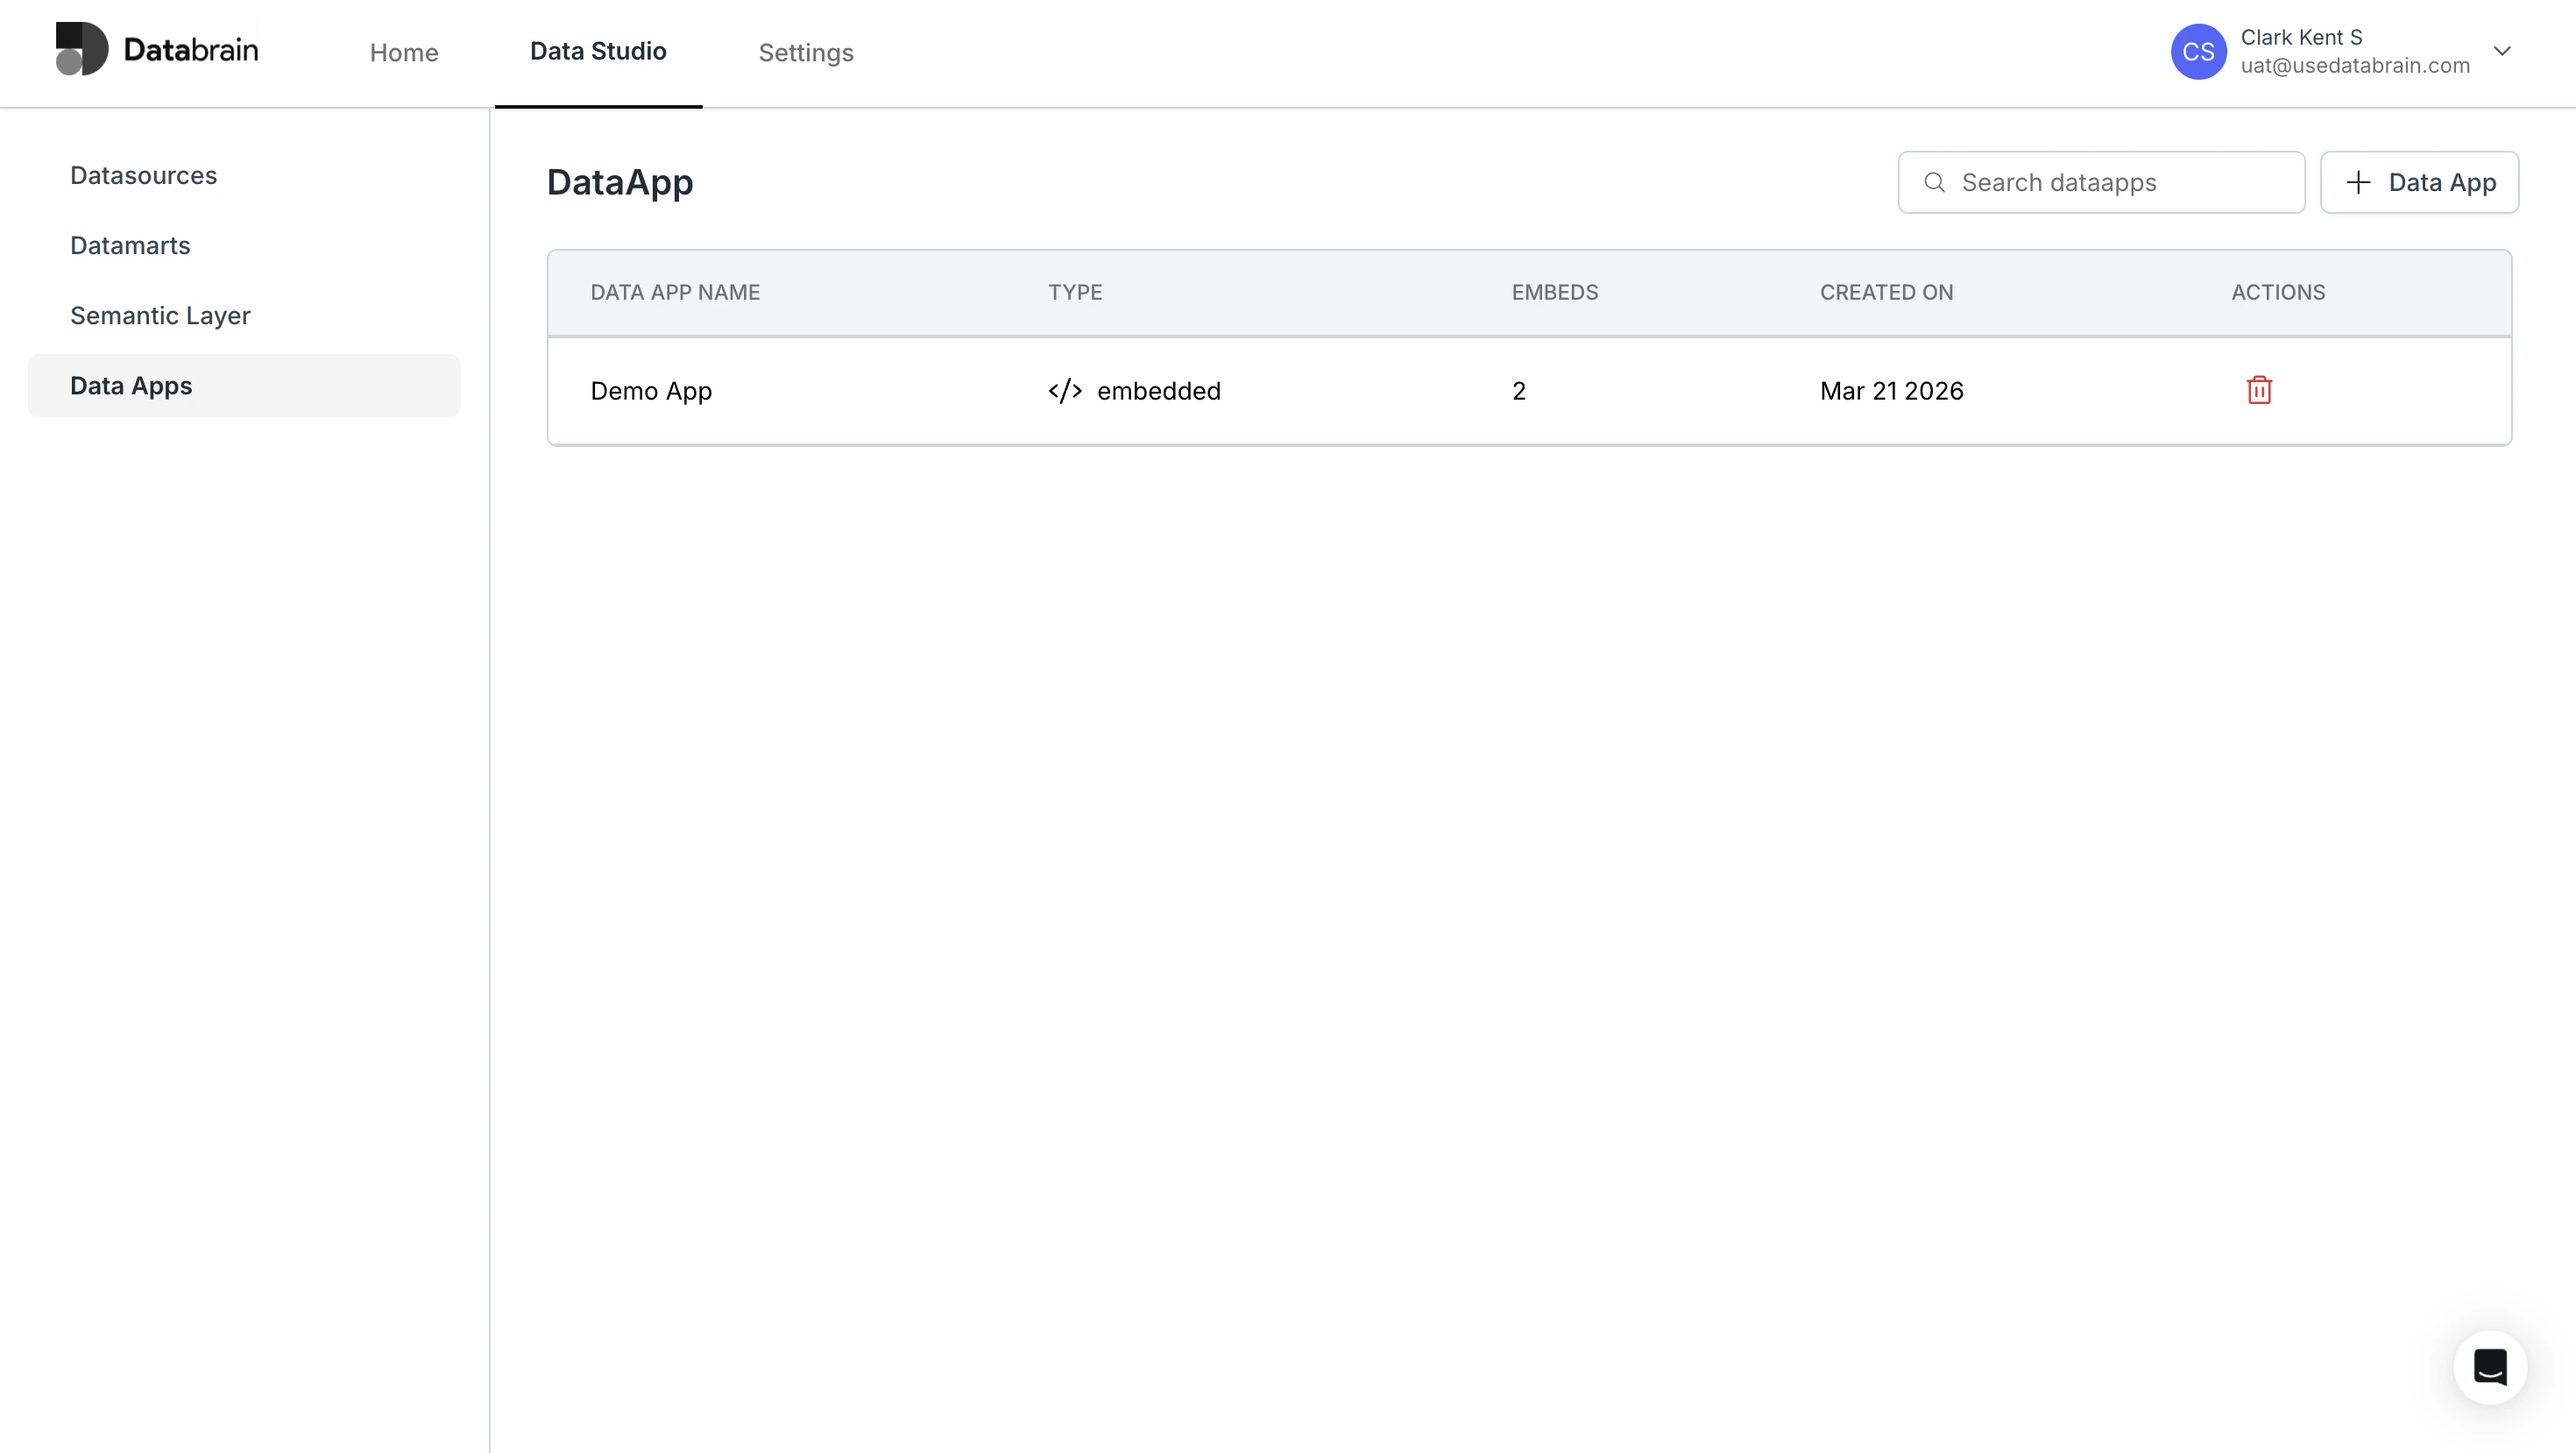
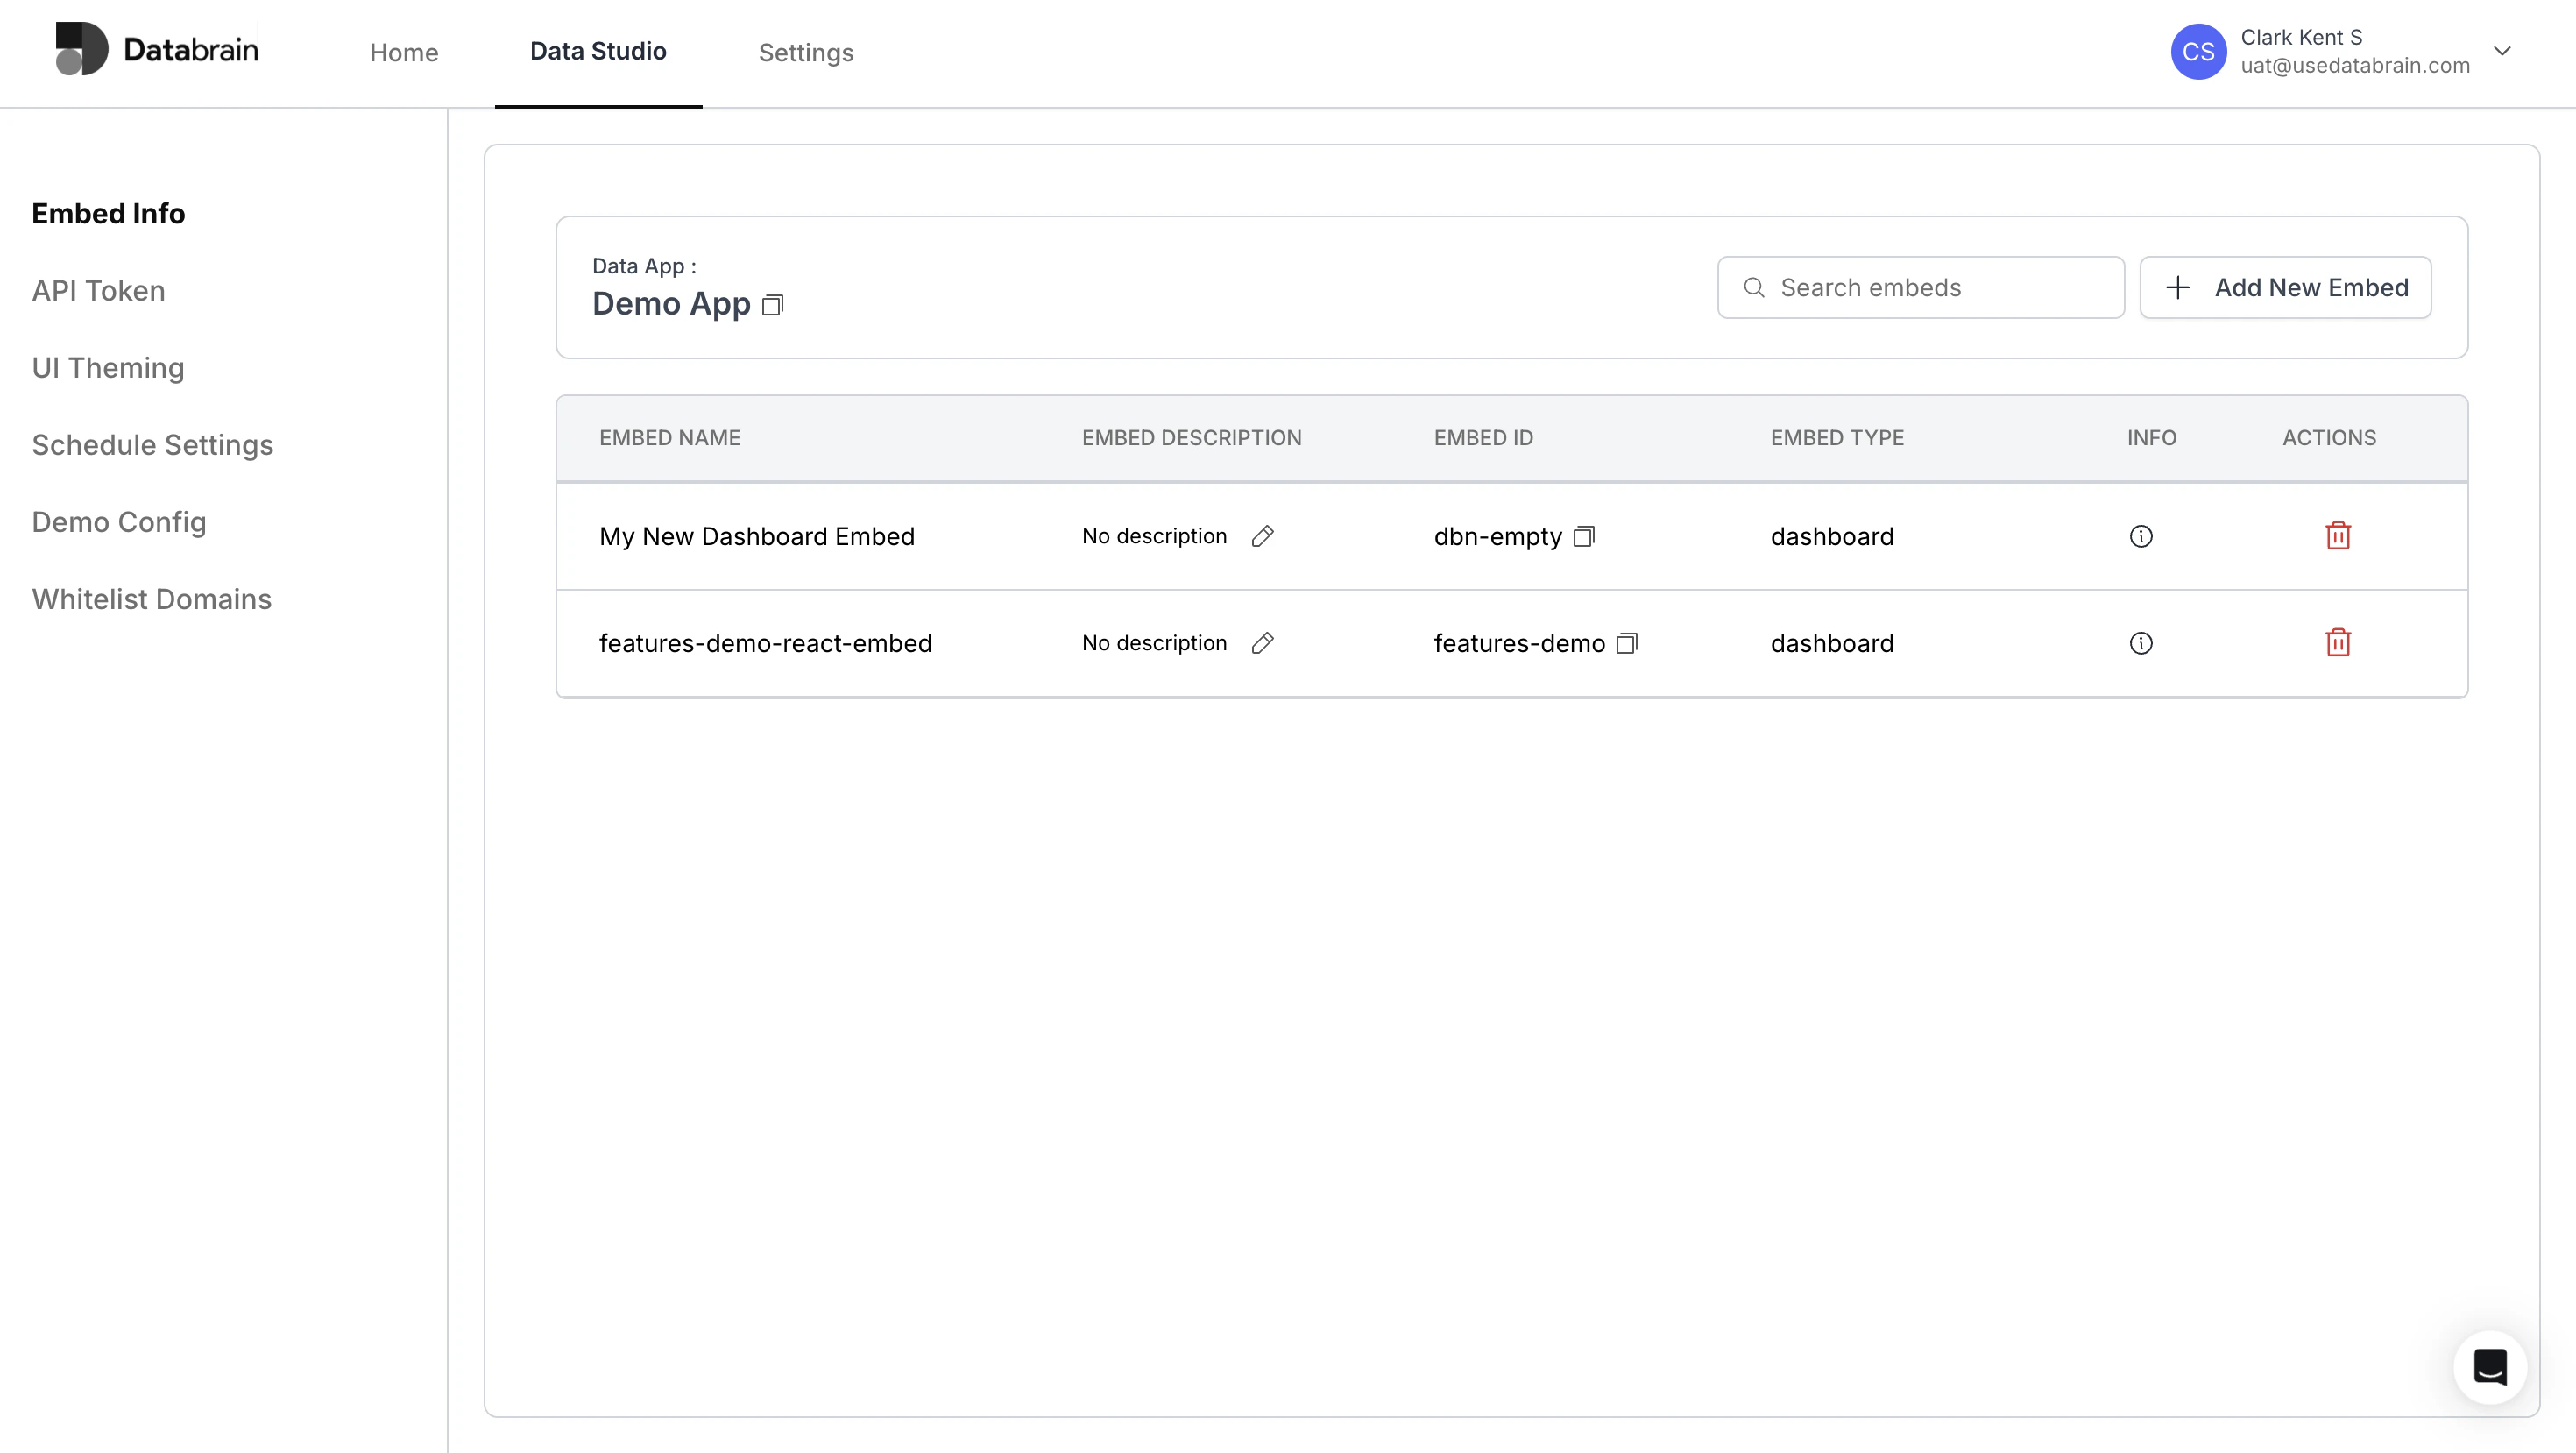
- Admin users can now delete data apps and embeds directly from the UI.
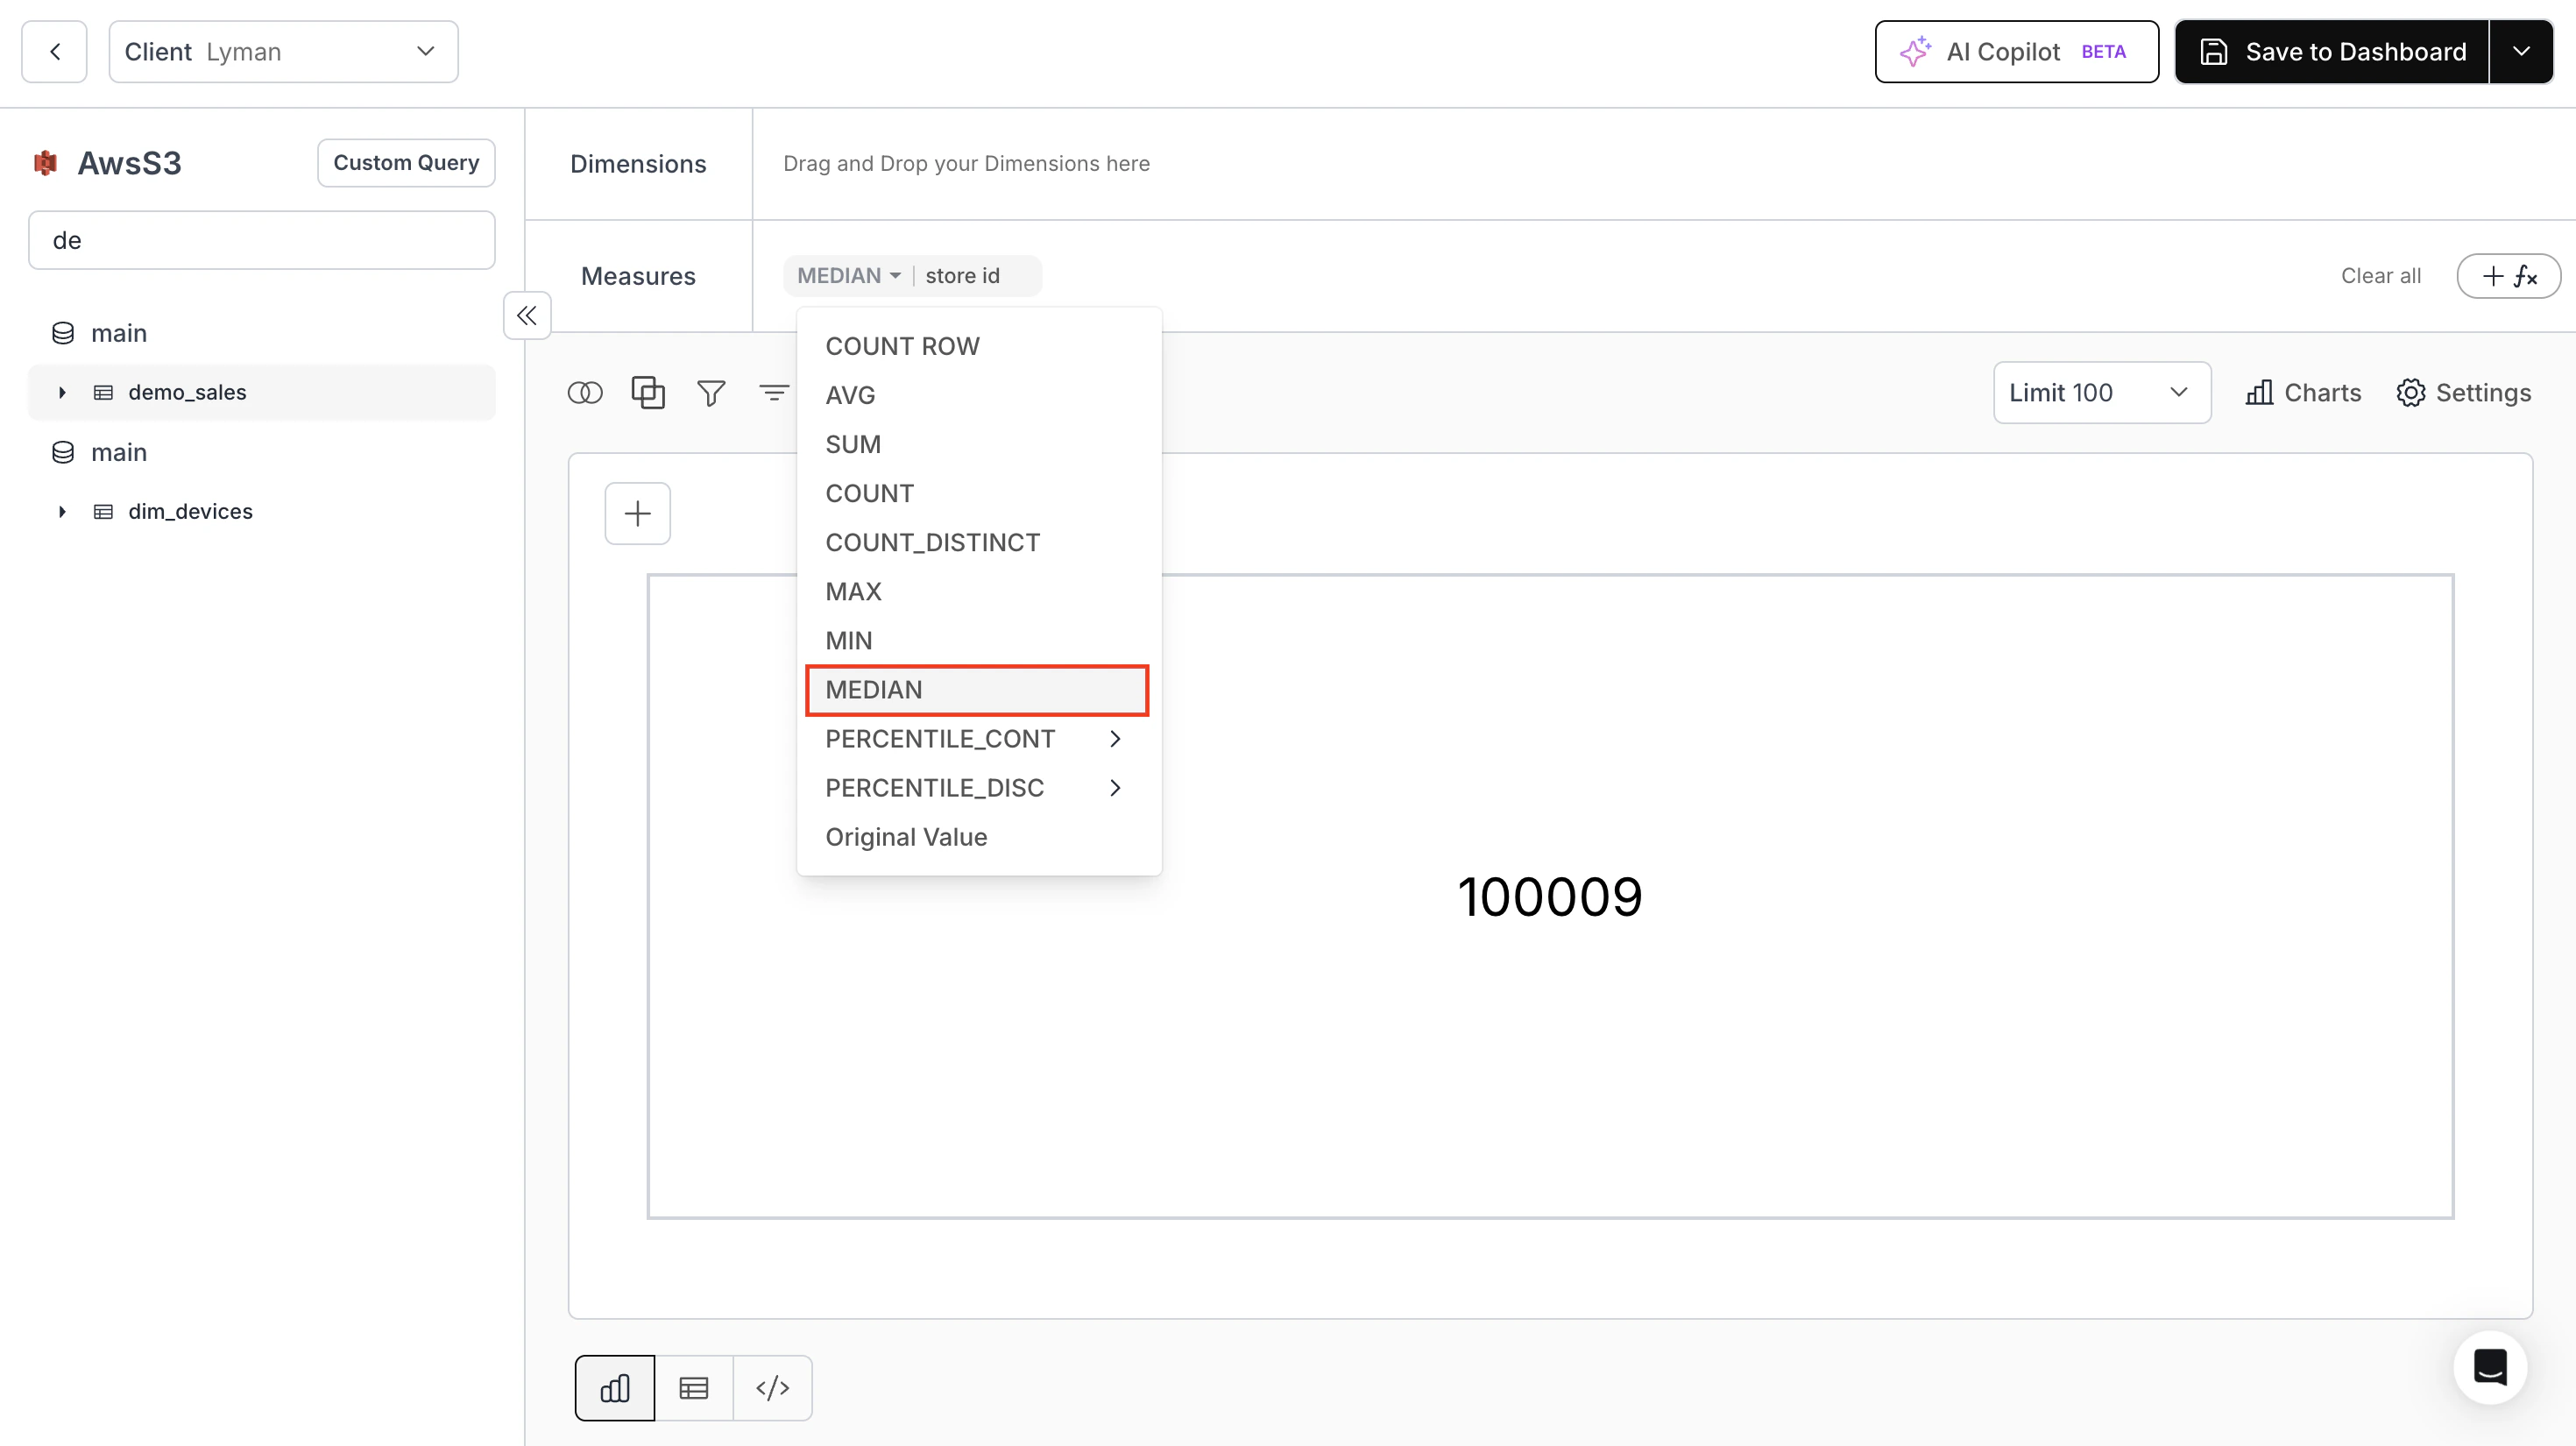
- Median as an Aggregate Function:
We have introduced support for theMEDIANaggregate function for measures. Users can now useMEDIANfor numeric column aggregation, enhancing data analysis capabilities.
- Newly created or added embeds now appear at the top of the list under Data Apps.
- Extended timezone functionality to dashboard and metric filters for ClickHouse, Trino, Redshift, CockroachDB, PostgreSQL, and MSSQL data sources.
-
End User Chart Click Function Enhancement:
Added support to send the entire clicked row data instead of just a specific value:- When all data is passed:
- For Table and Single Val:
{ columnName: value, }e.g.{"product name": "Product A1", "price": 4.444} - For Tree Map and Sankey:
{ name: xVal, value: yVal } - For others:
{ name: xVal, value: yVal, columnName: colName }
- For Table and Single Val:
- When all data is passed:
- Added support to import data files in the dashboard embedding API.
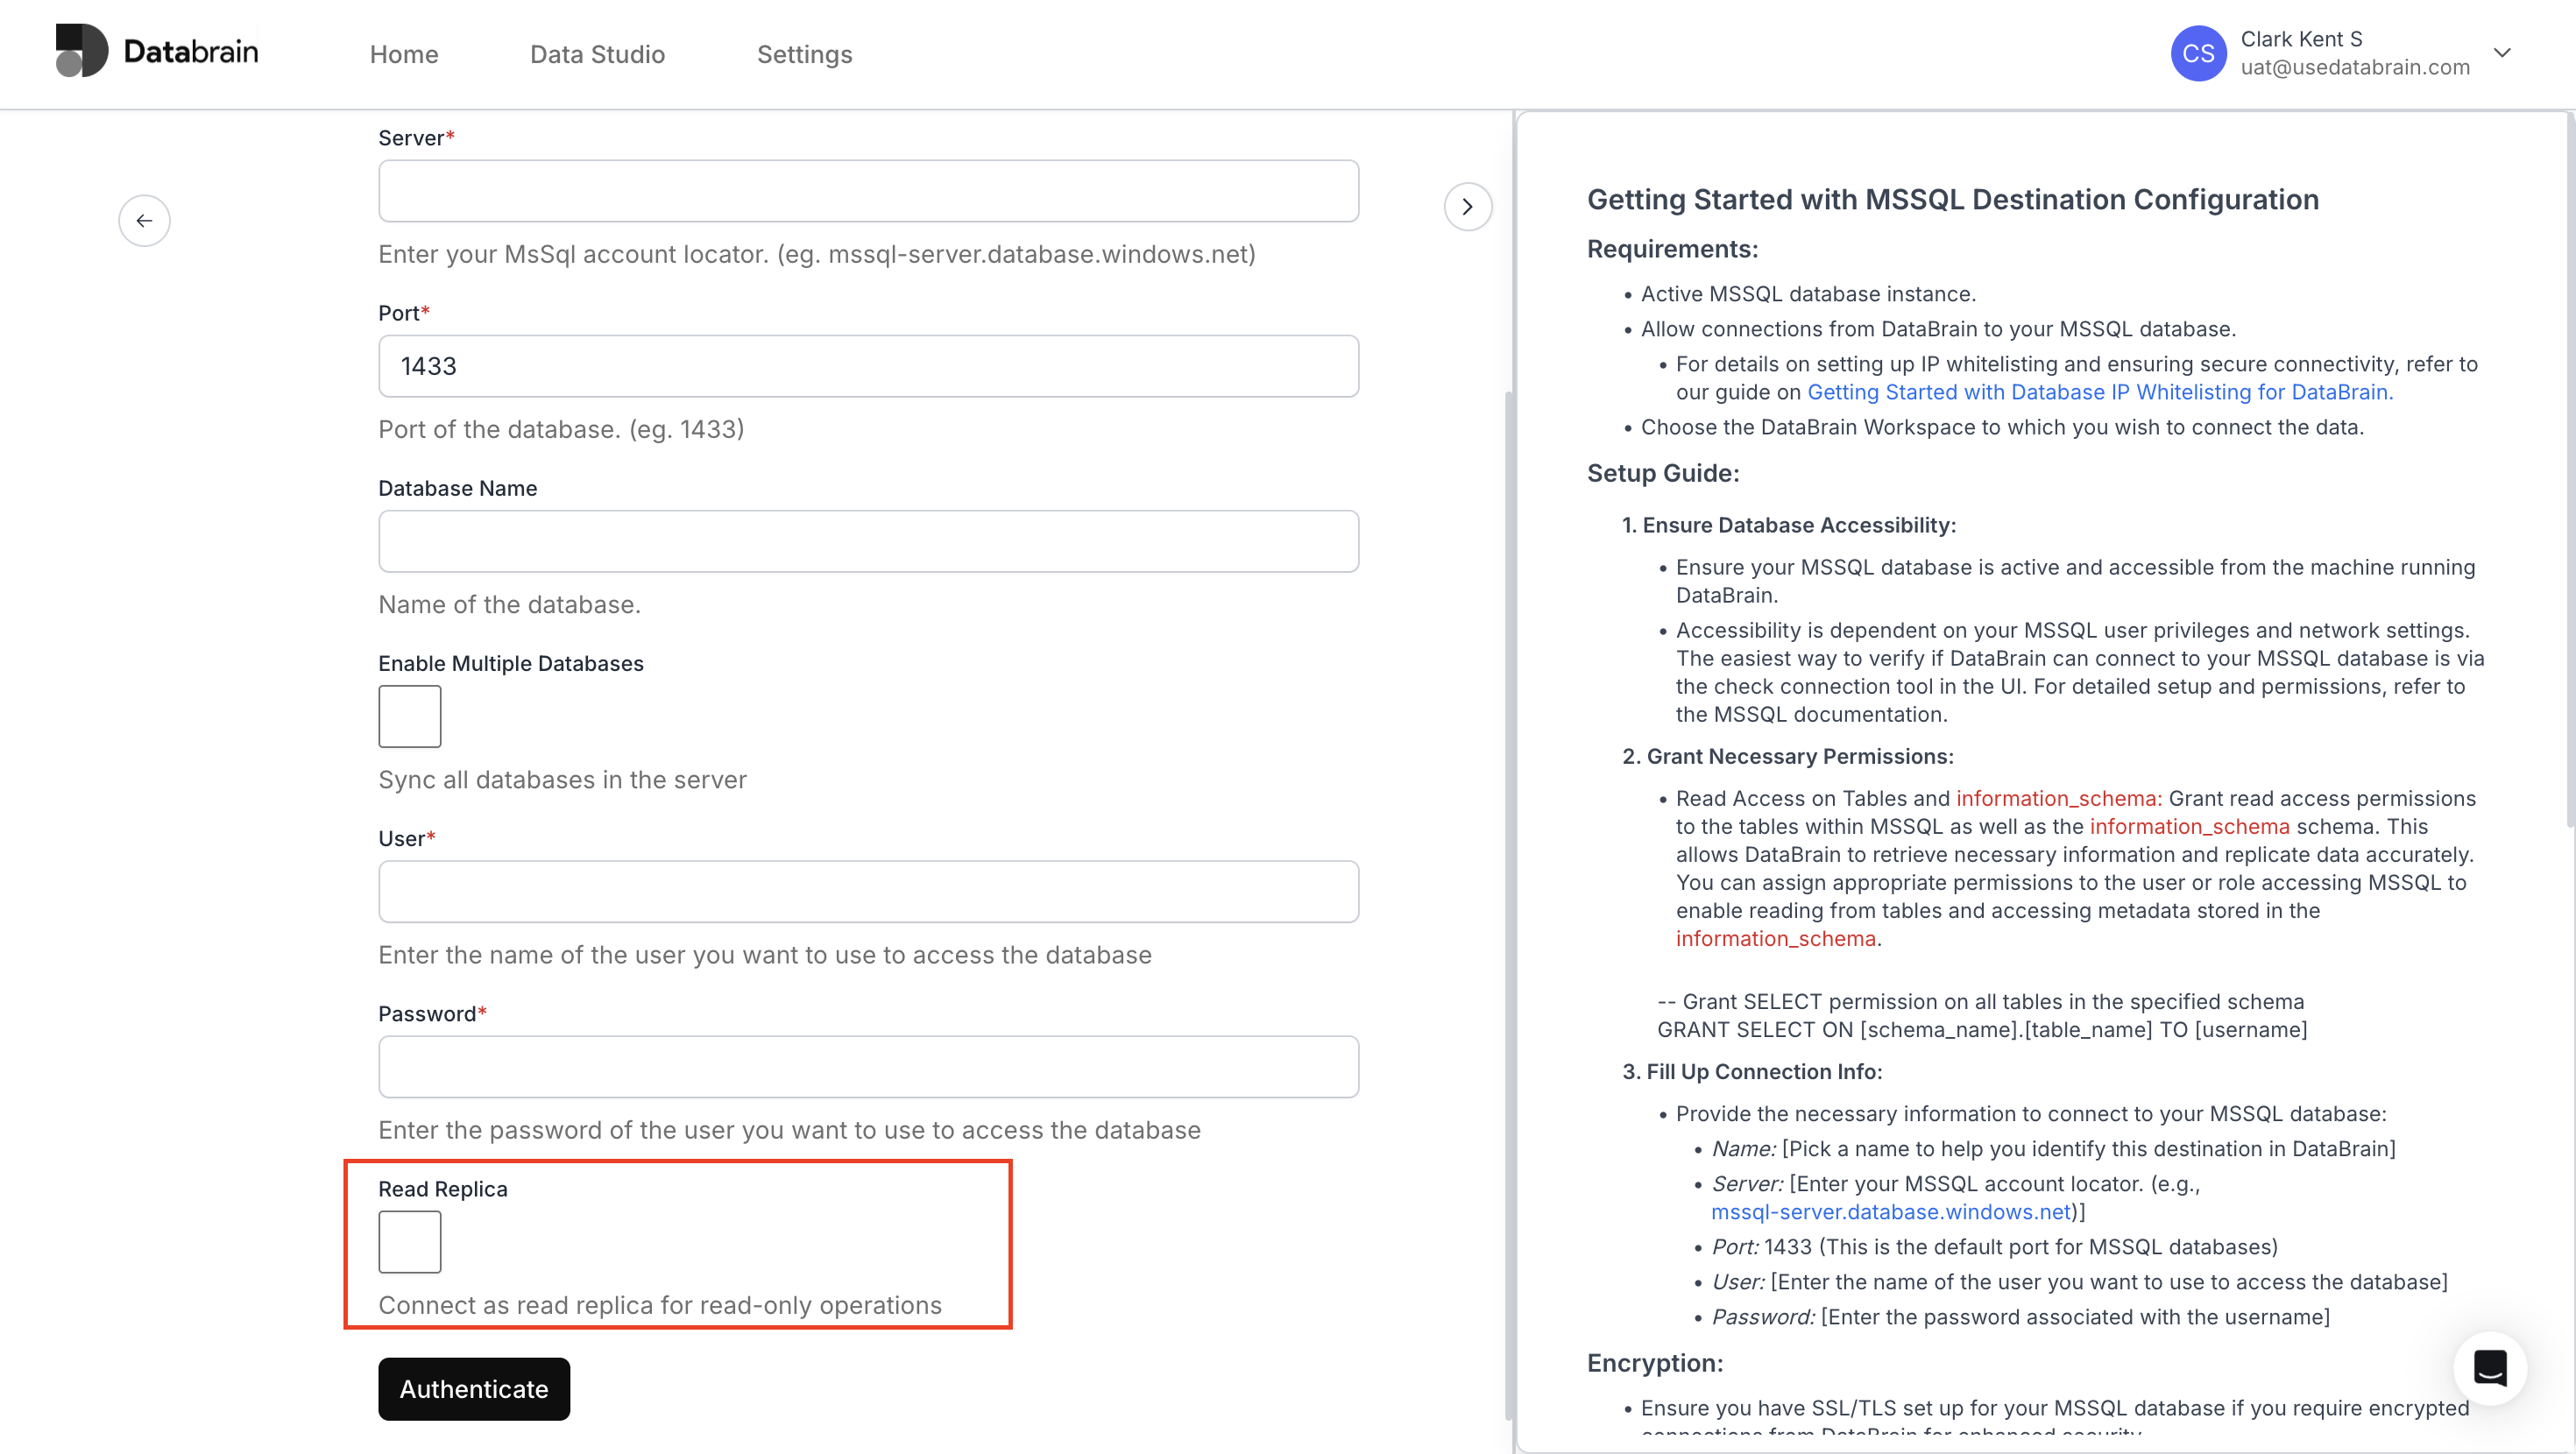
-
Adding Flag in Connection Form for MSSQL Read Replica:
We have introduced areadOnlyIntentcheckbox option in the MSSQL integration configuration, allowing users to connect as a read replica for read-only operations.
Fixes:
- Fixed datetime issues in Trino.
-
Fixed an issue with chart reset in in-app and plugin views:
When updating already applied popup filters, charts in the dashboard were resetting before clicking Apply. - Fixed issues with using the percentile function for measures in embeds.
- Fixed connection errors with metrics that include custom SQL queries or calculated fields.
- Fixed an issue with the OpenSearch alias for end-user metric creation.
March 16, 2026 Updates
March 16, 2026 Updates
Features:
-
Create Empty Dashboard Embed API:
We have introduced a prop that allows users to pass data from the Export API response when creating an empty dashboard embed. -
Export Embedded Dashboard API:
We have introduced an endpoint to export embed data, enhancing data retrieval capabilities for users.
Enhancements:
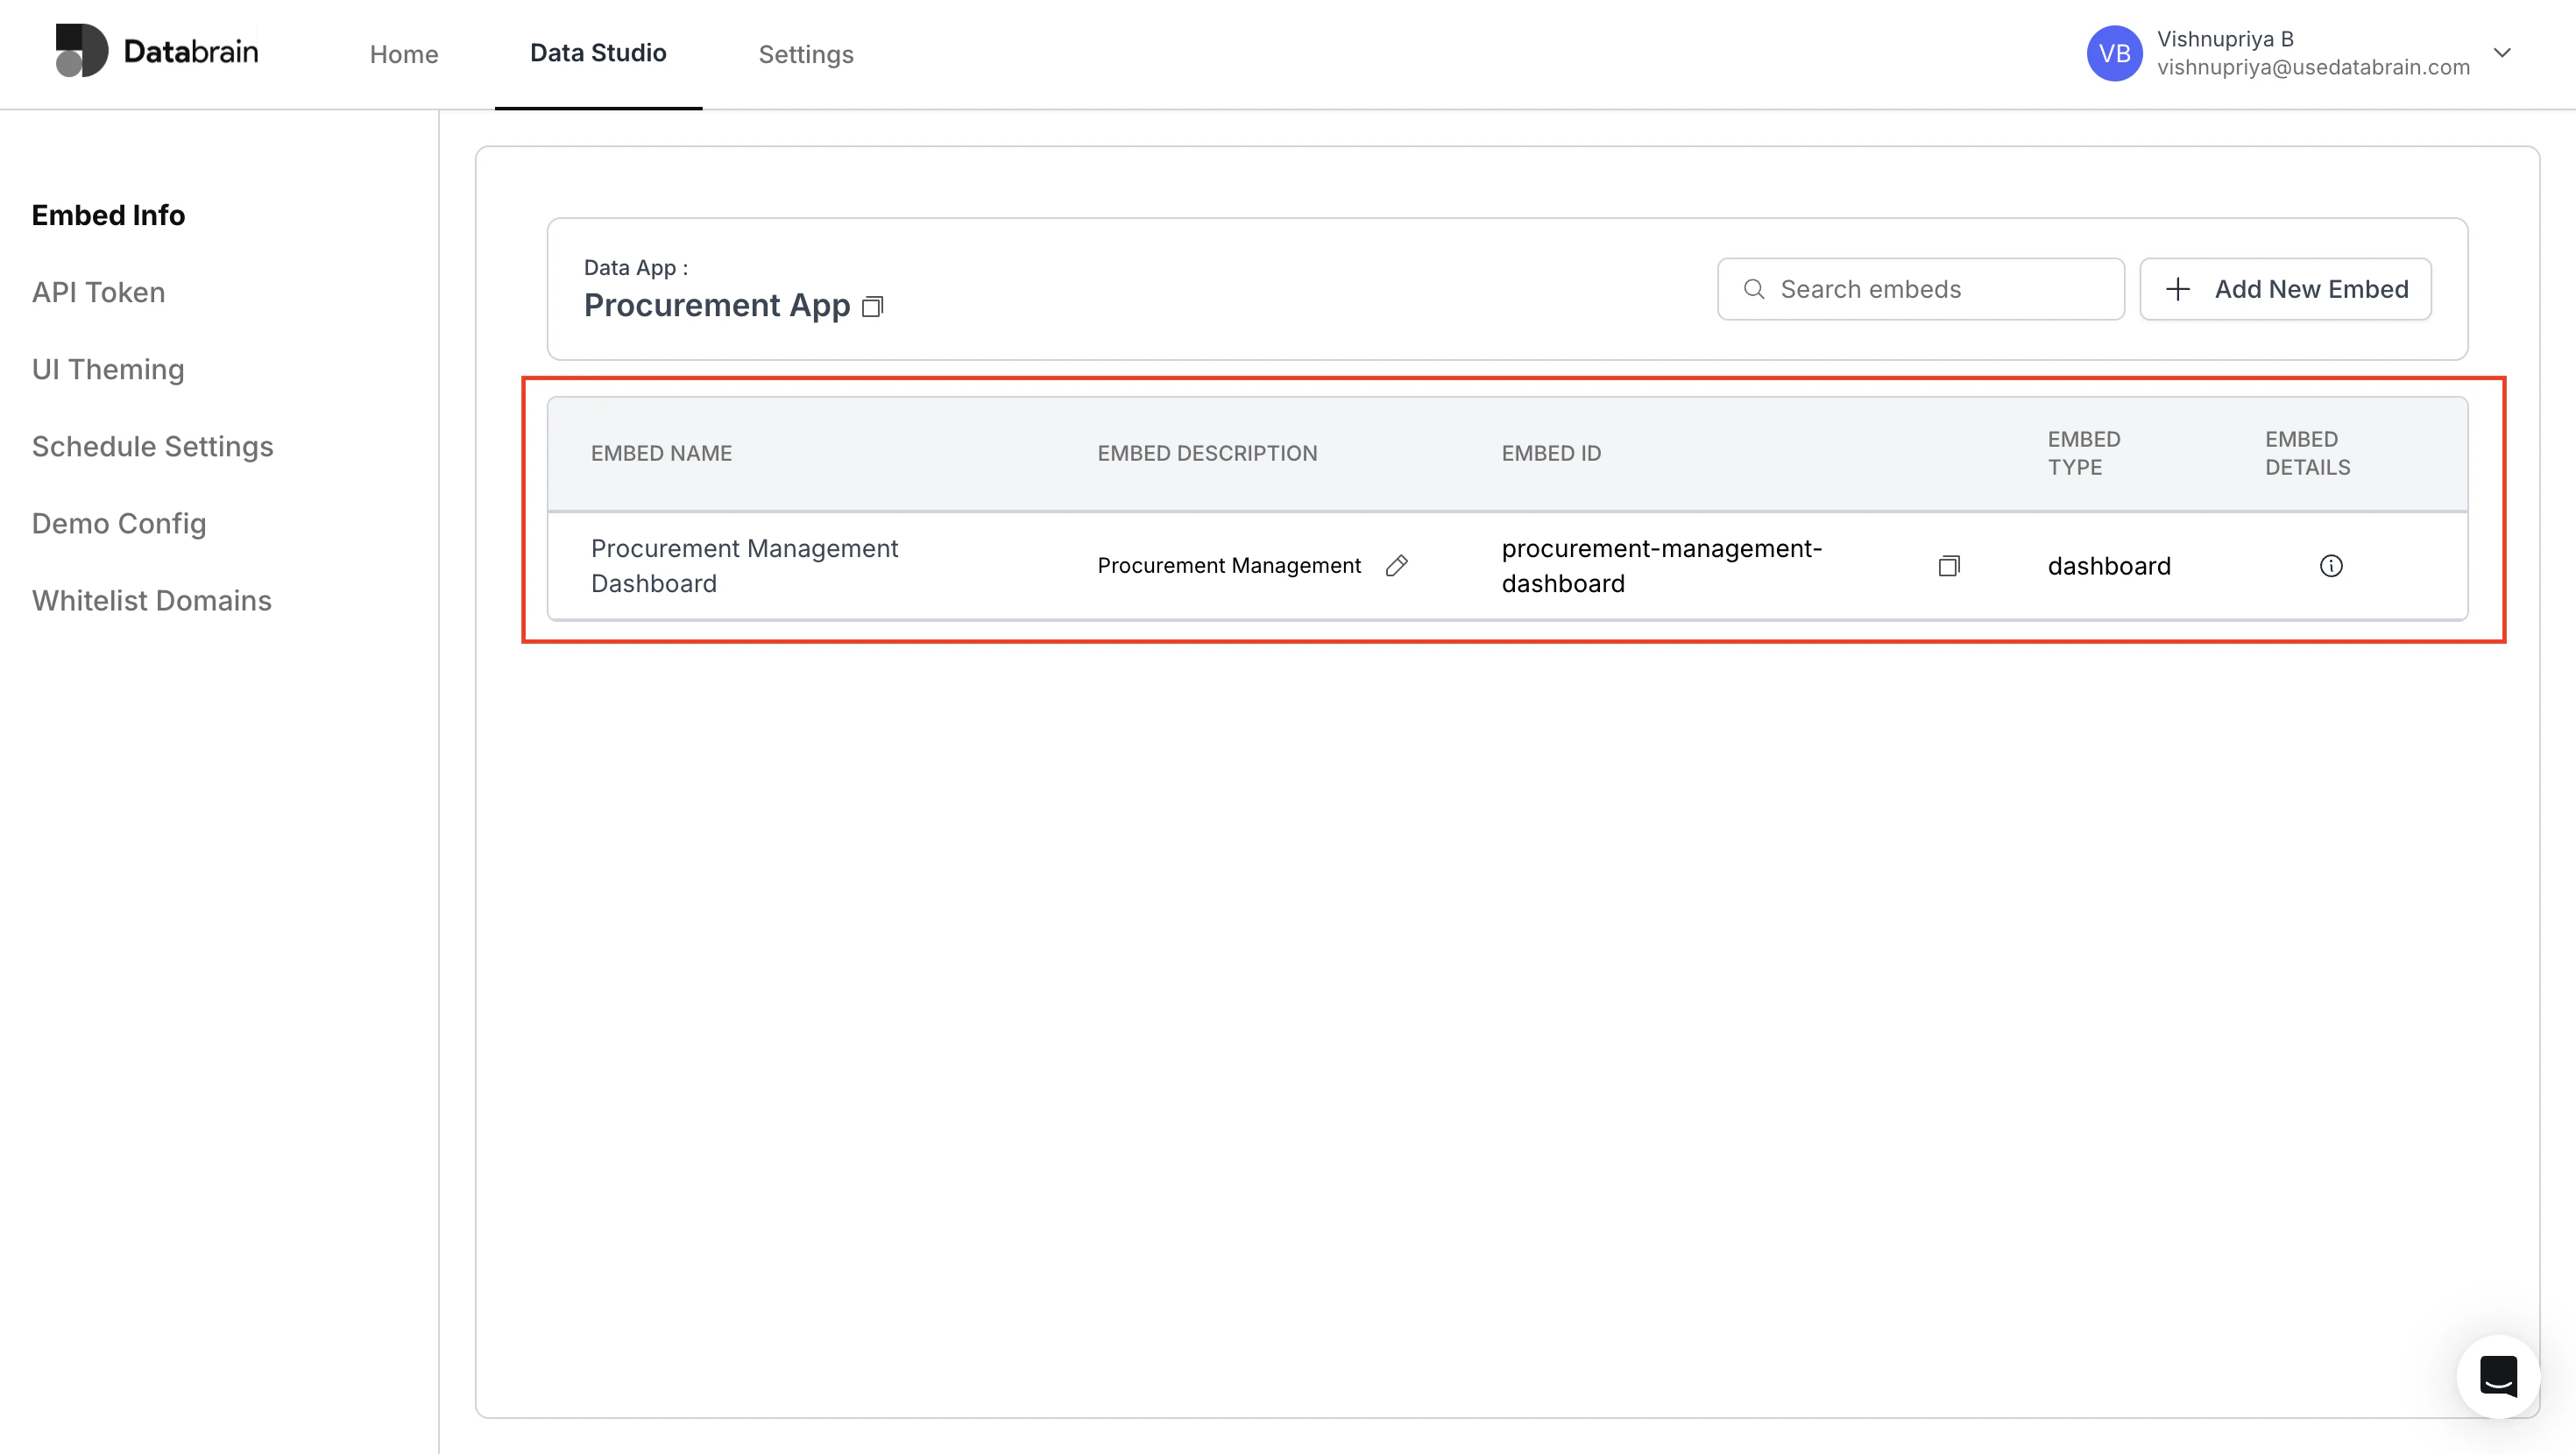
- Description and Details for Embeds:
We have added Description and Details fields for embeds.
Fixes:
- We have optimized the bundle size of the plugin.
March 9, 2026 Updates
March 9, 2026 Updates
Features:
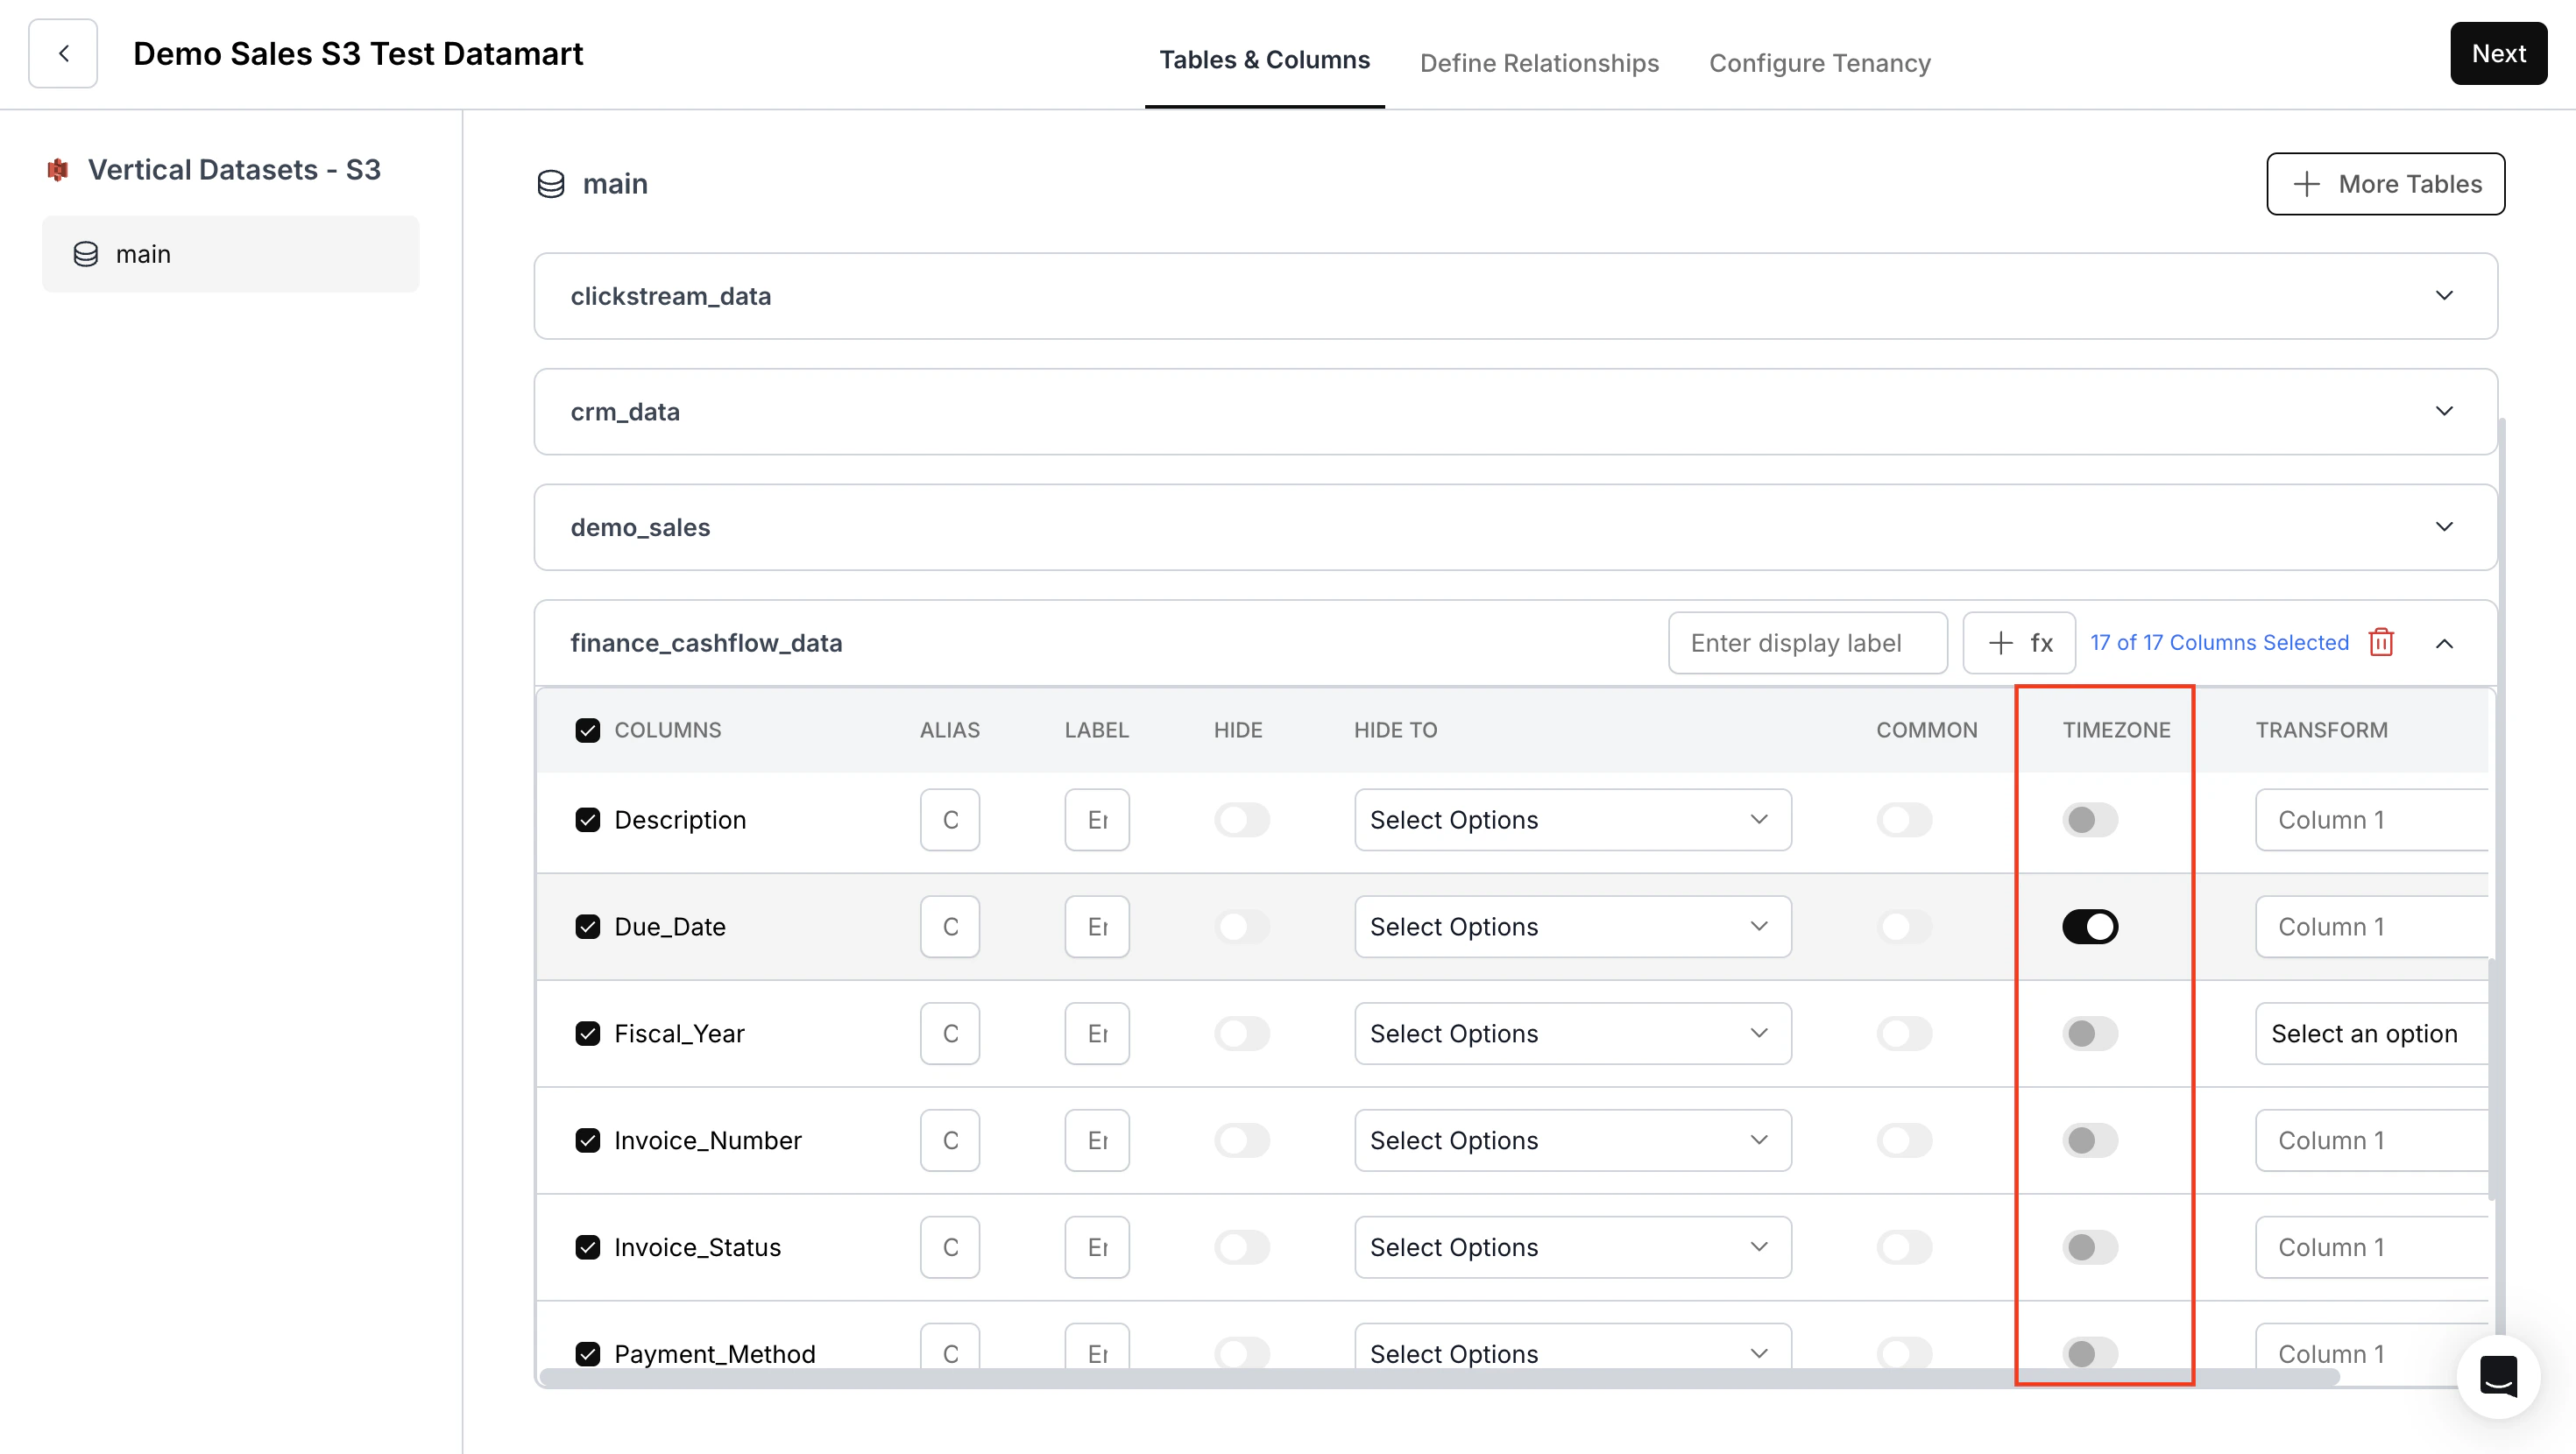
- Cast or Convert Datetime Columns Based on Guest Token Timezone:
Introduced timezone application functionality for datamart and end-user metric creation. Users can now toggle timezone adjustments for date-time columns via a new switch component in Datamart.
- CRUD on CockroachDB Datasource with API:
Added API support to create, read, update, and delete CockroachDB datasource configurations programmatically.
Enhancements:
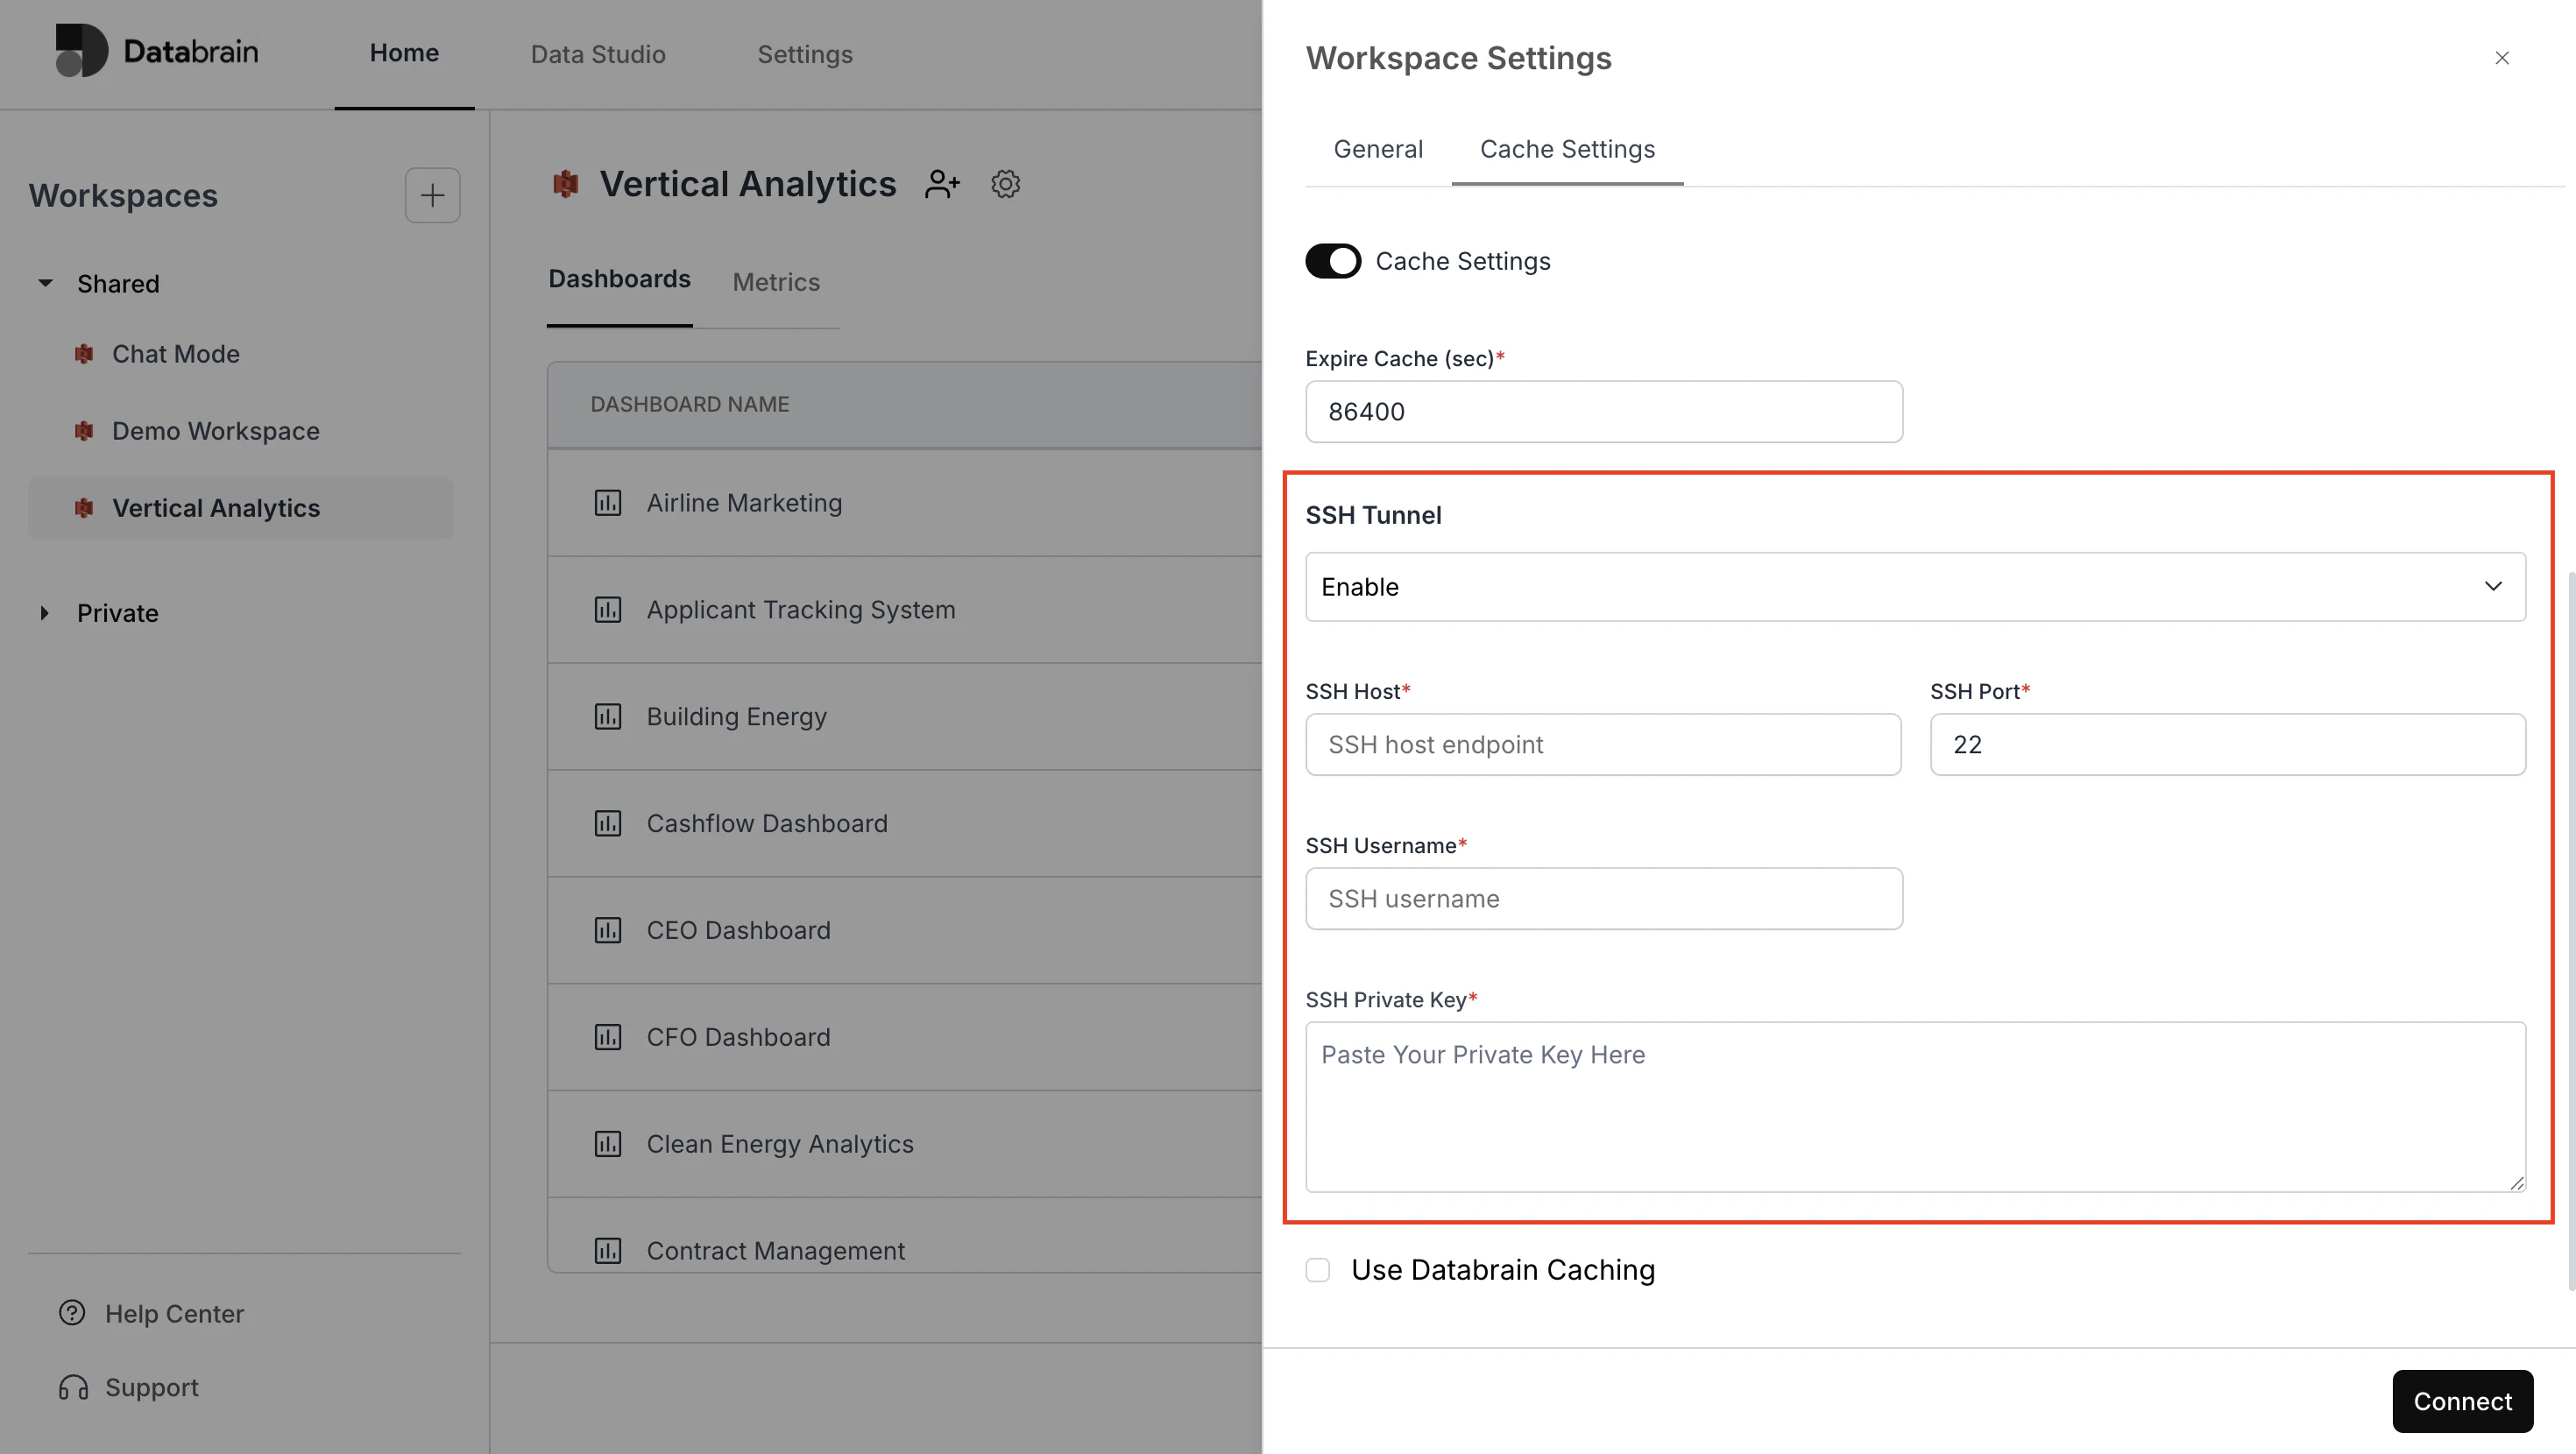
- SSH Tunneling Support for Redis:
Introduced SSH tunneling support for Redis connections, enhancing configuration options when creating company Redis instances.
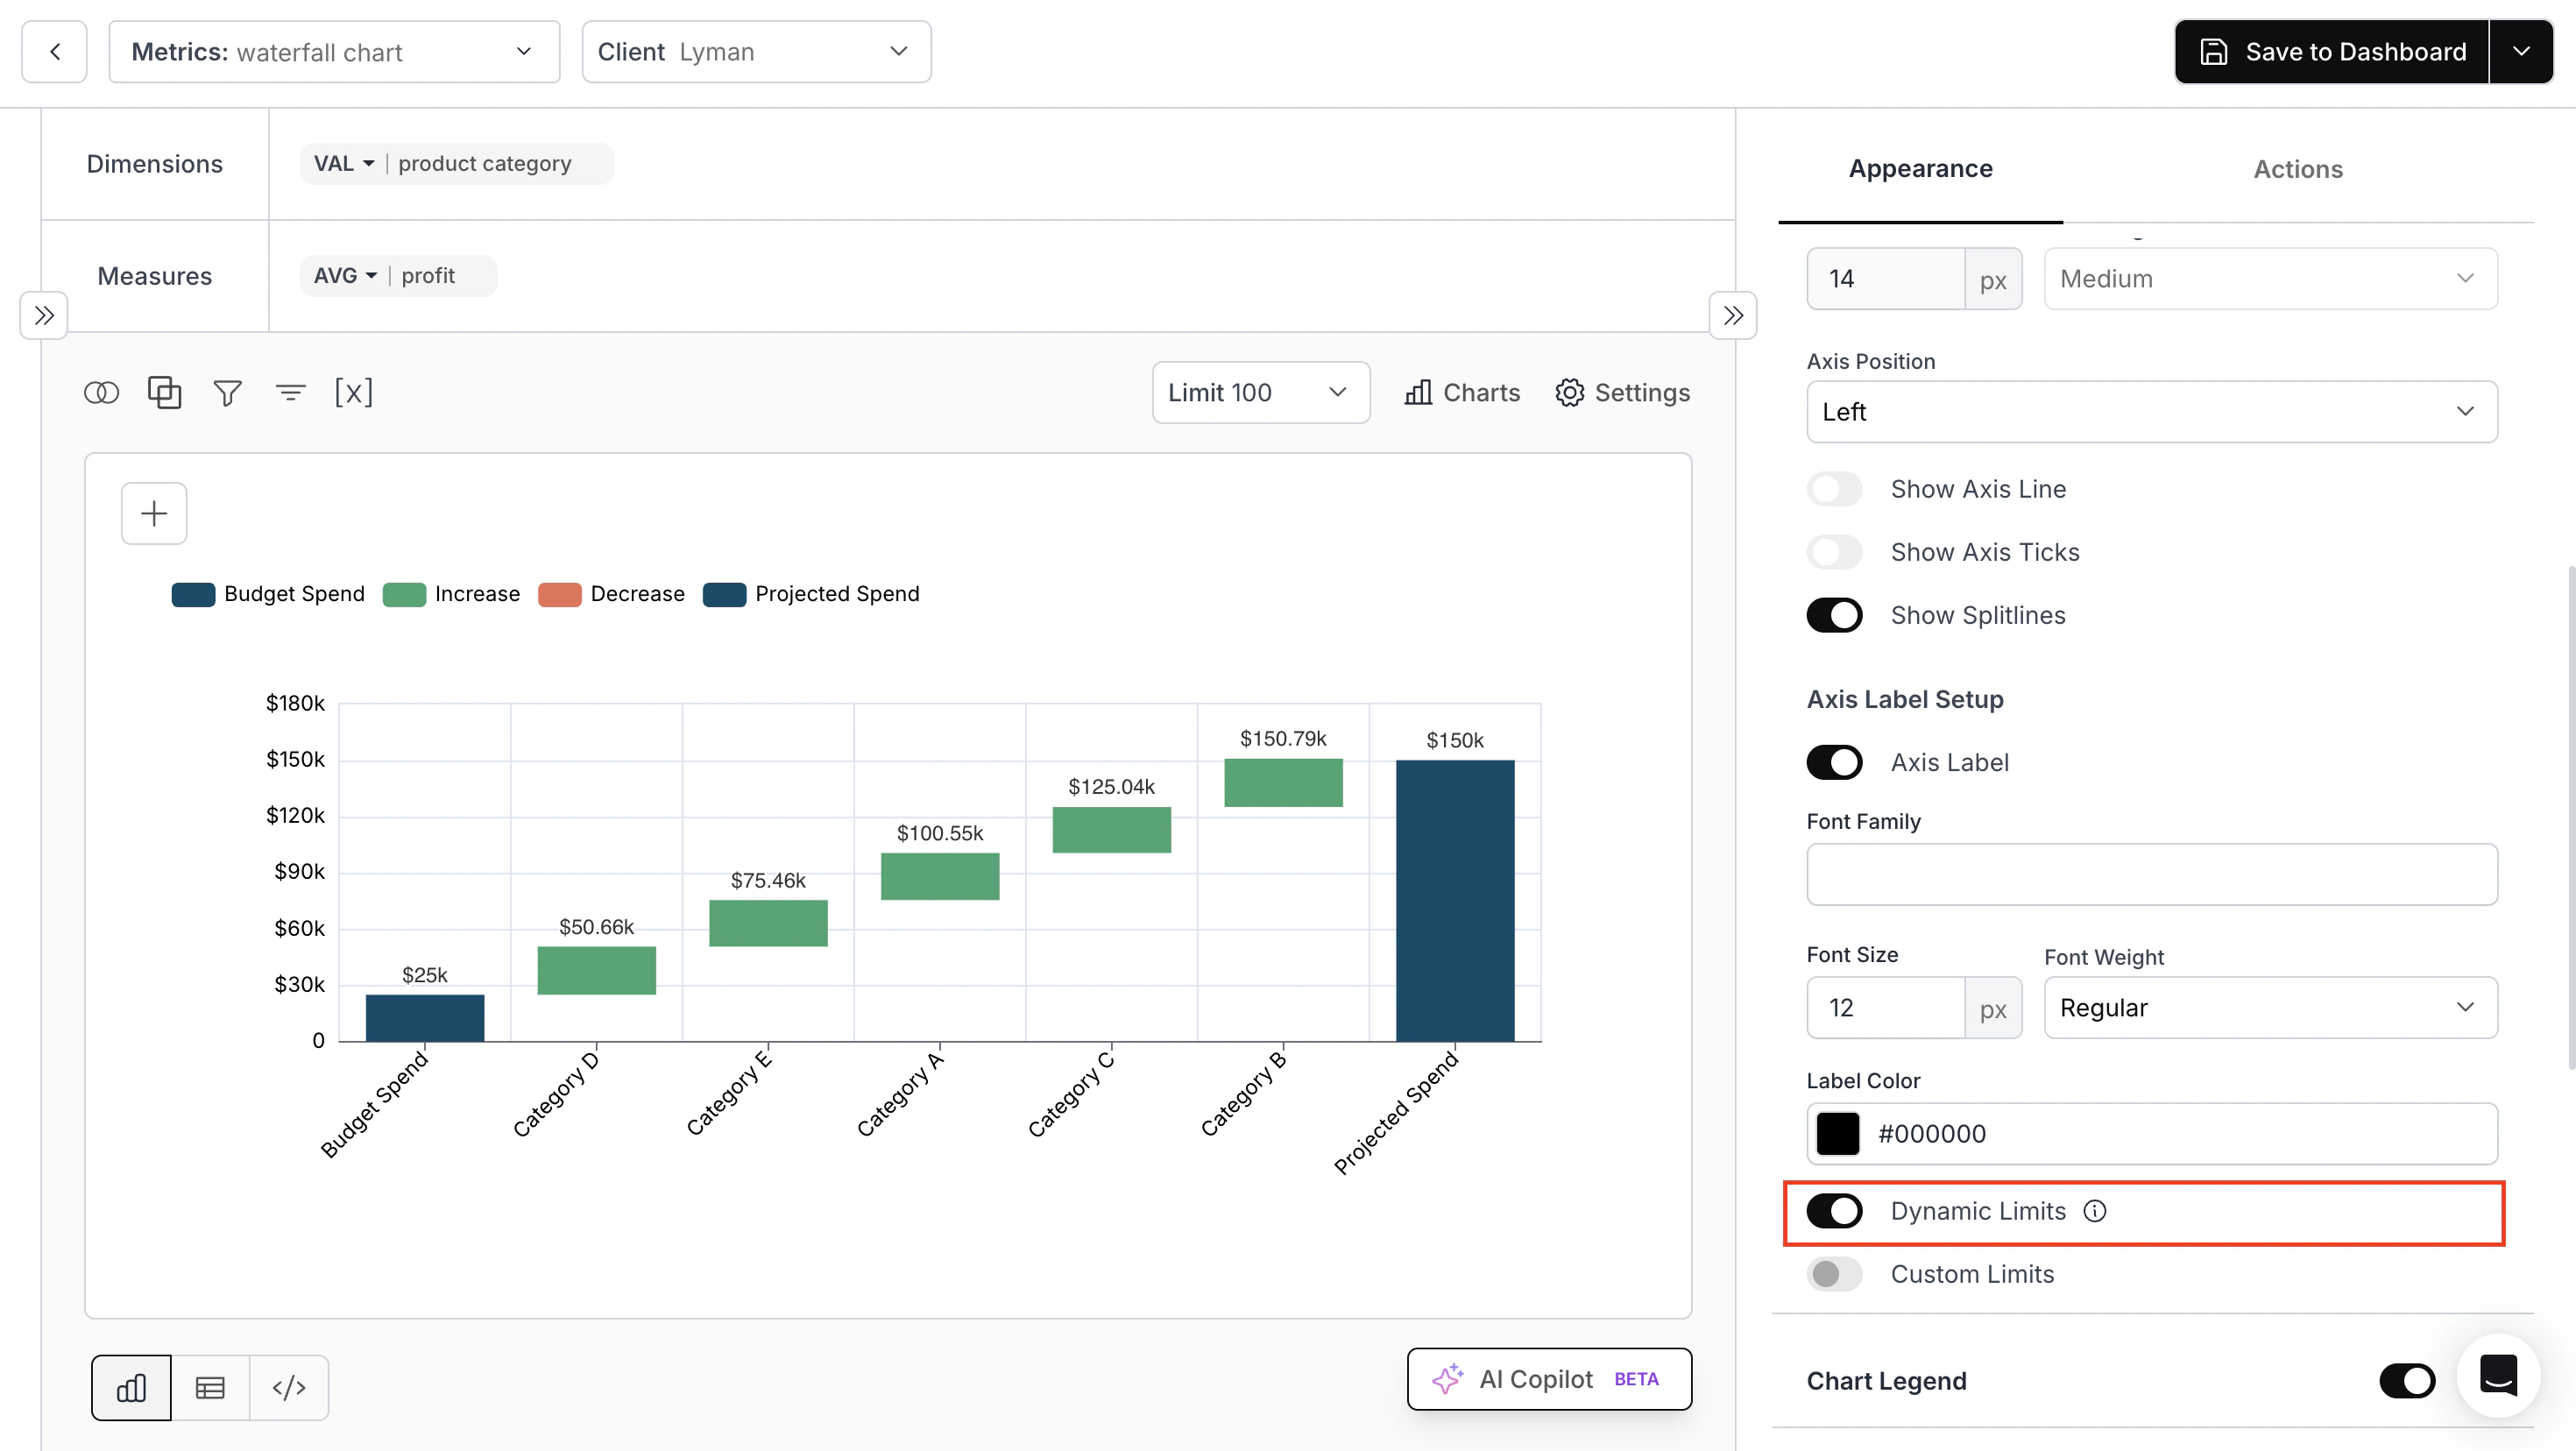
- Dynamic Adjustment of Axis Limits in Charts:
Users can now dynamically adjust the lower and upper limits of the vertical axis in all charts with axes.
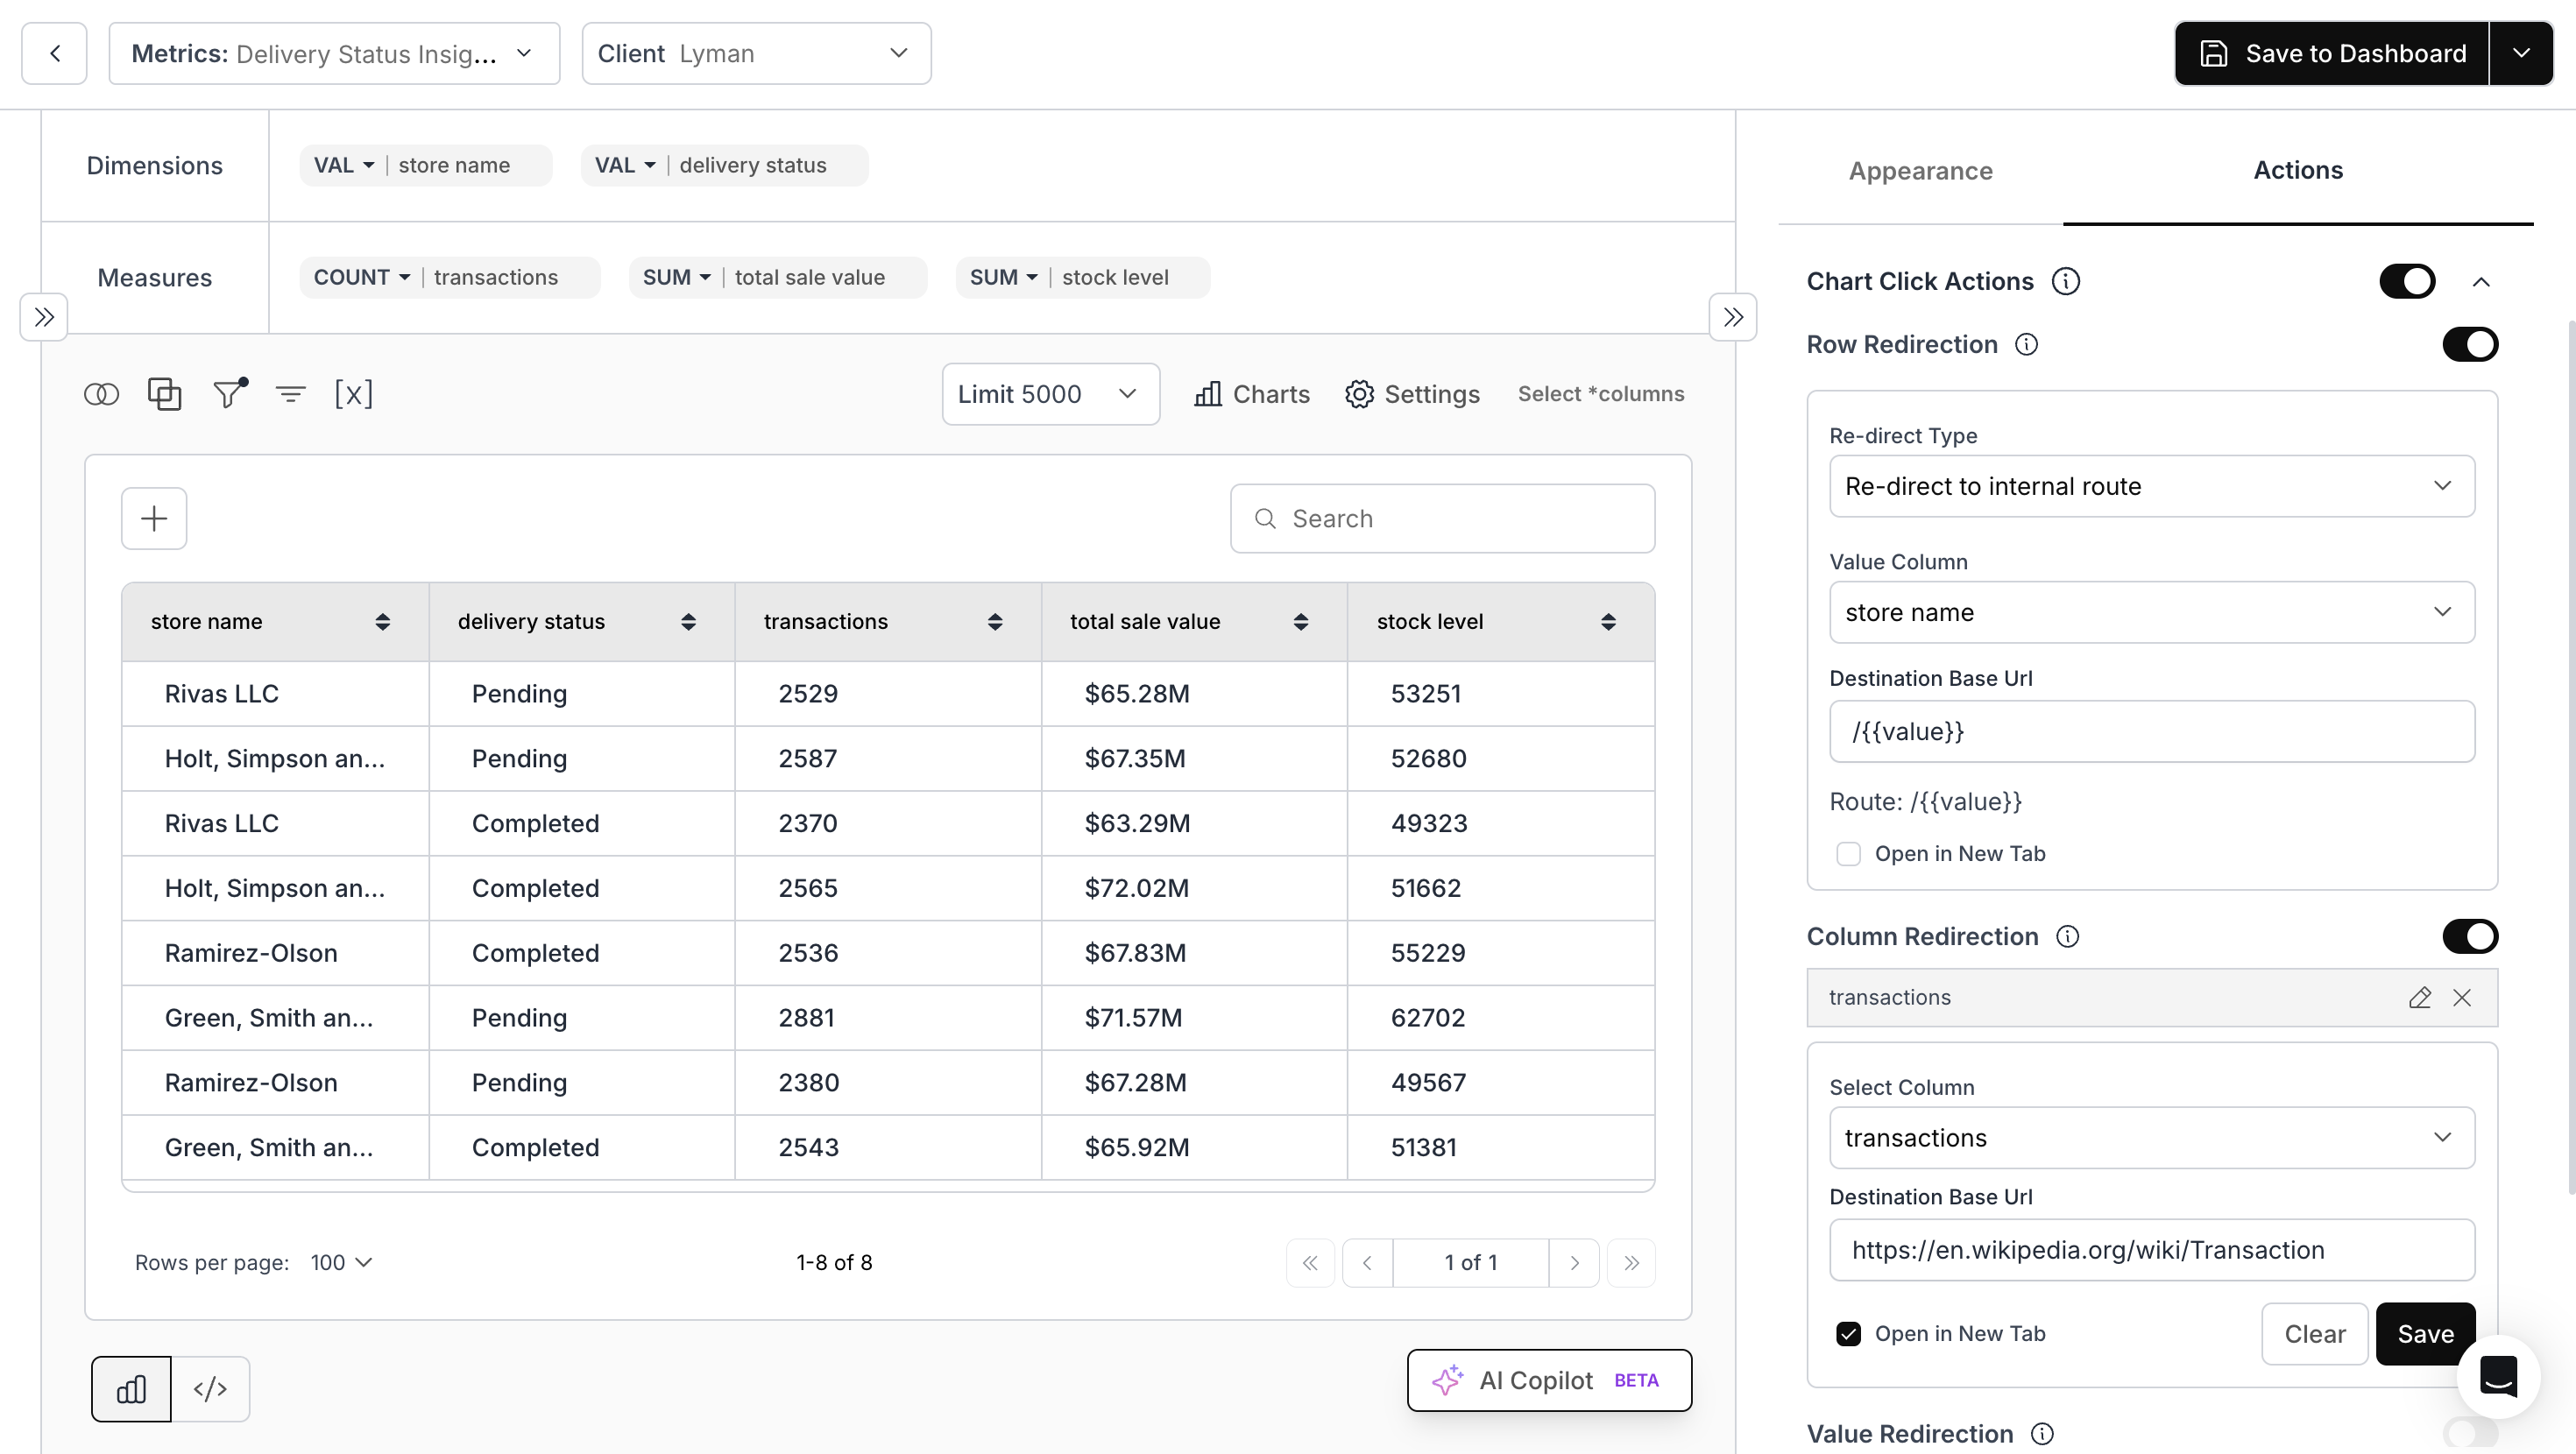
- Chart Actions Enhancement for Table Chart:
Added row redirection and column redirection options for table charts.
-
Enhancement of Import Dashboard API:
IntroduceddashboardIdanddashboardNameas parameters in the API. -
Support for Reflecting Embed Name While Creating an Empty Dashboard Embed:
Added an optionalisRenameDashboardparameter to the dashboard creation functions, allowing users to conditionally rename dashboards during the creation process.
Fixes:
-
Export as PDF Download Speed:
Improved performance for exporting dashboards as PDF. -
Alias Mismatch After Editing Metrics in Imported Dashboards:
Resolved an issue where aliases did not match properly when users edited metrics by adding filters or sorting. -
Export Dashboard API Error Handling:
Enhanced error handling by introducing a specific error message for invalid dashboard IDs or workspace names, improving API response clarity. -
Boolean Dashboard Filter in Postgres:
Fixed issues with boolean filters in Postgres-backed dashboards. -
OpenSearch Connection Issue:
Fixed a connection issue affecting OpenSearch.
February 27, 2026 Updates
February 27, 2026 Updates
Features:
-
API to Whitelist Domains:
We have introduced a new API endpointwhitelist-domainsto manage whitelisted domains associated with a company. -
API for SMTP Settings:
We have introduced a new API endpointsmtp-settingsto save and update company SMTP settings, improving email configuration management.
Enhancements:
-
Rotate Data App API using Self Auth:
Updated the authentication method for Data App API key rotation from the master token to the current API key. -
Customization of “Exporting Dashboard” Prompt Position:
Added a property in the dashboard component to customize the position of the Exporting Dashboard prompt:
exportMsgPosition: "bottom" | "bottom-left" | "bottom-right" | "center" | "top" | "top-left" | "top-right".
Fixes:
-
Cockroach DB:
Resolved SSL certificate verification and date filter issues. -
BigQuery:
Fixed an issue with underlying data in the time-series chart. -
OpenSearch:
Fixed a connection issue. -
Datamart:
Added unique name constraints in app and APIs. -
Data App API Keys:
Updated to acceptexpiryTimeas a string instead of a number.
February 20, 2026 Updates
February 20, 2026 Updates
Features:
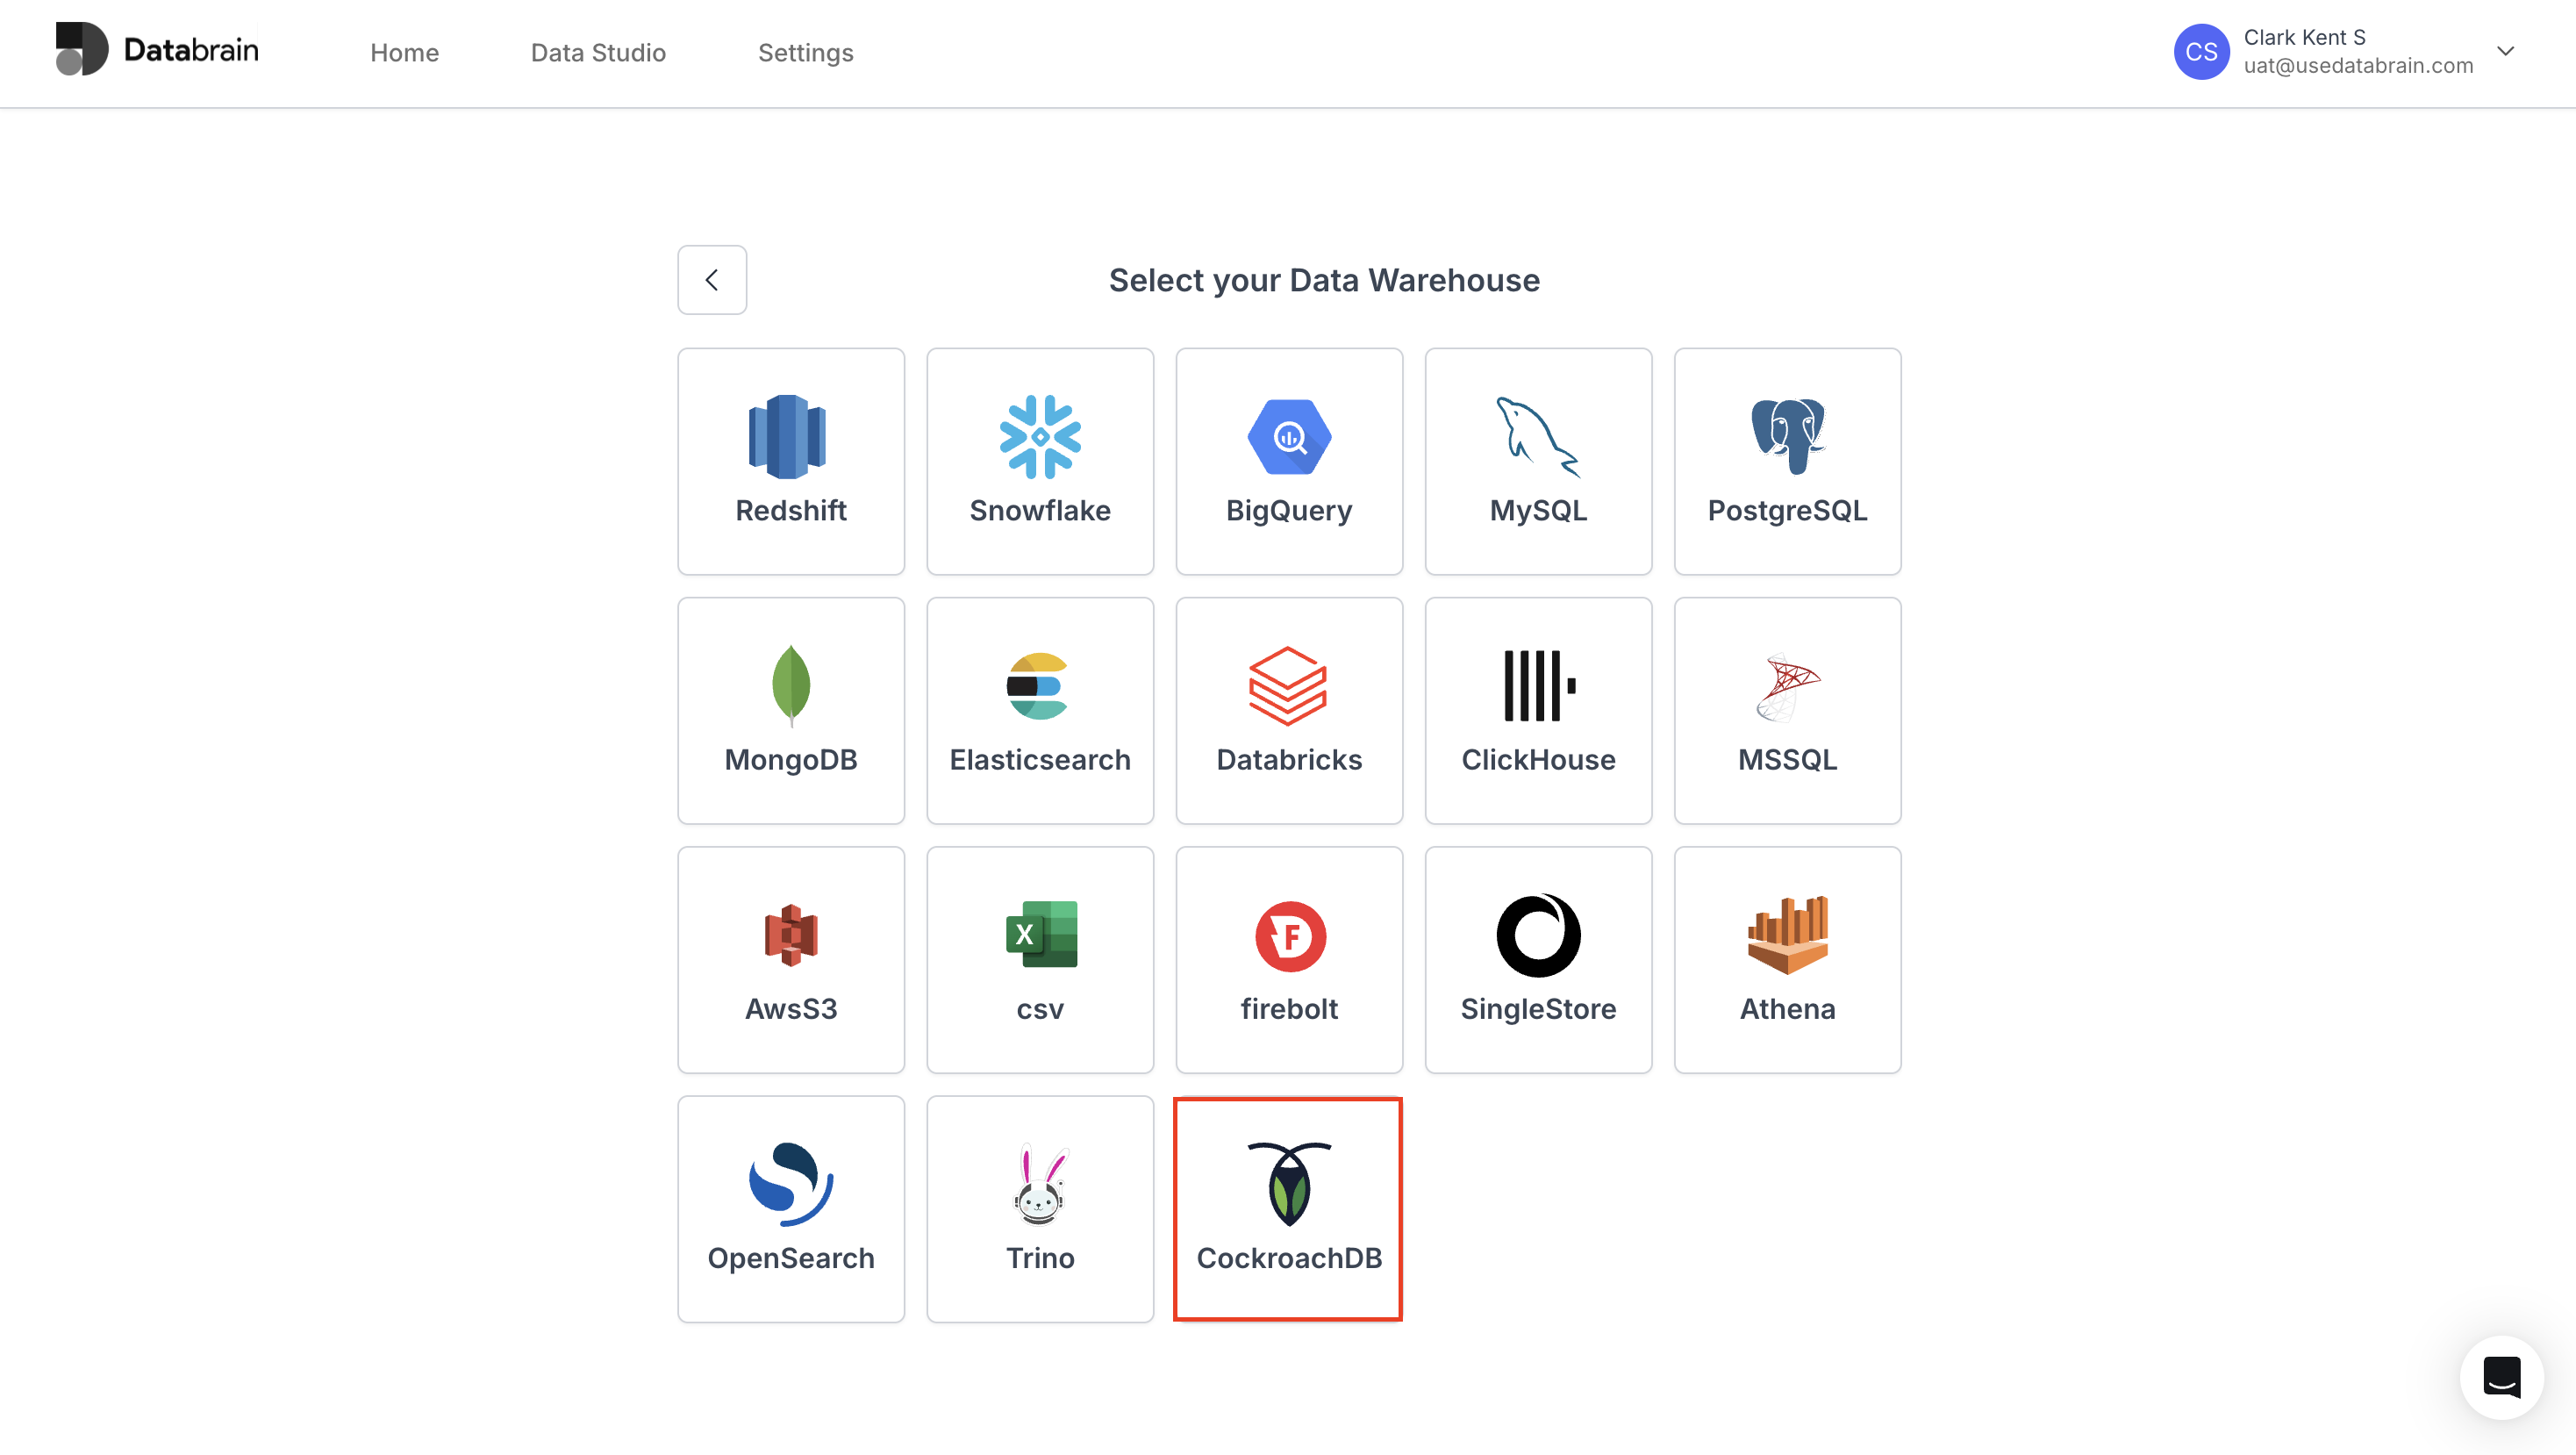
- New Data Source - Cockroach DB:
Support has been added for Cockroach DB as a new data source.
-
Import & Export Dashboard API:
API support has been added for exporting and importing dashboards. -
Include Metrics in Template Dashboard:
Metrics have been included in the template dashboard for the create dashboard embed API.
Enhancements:
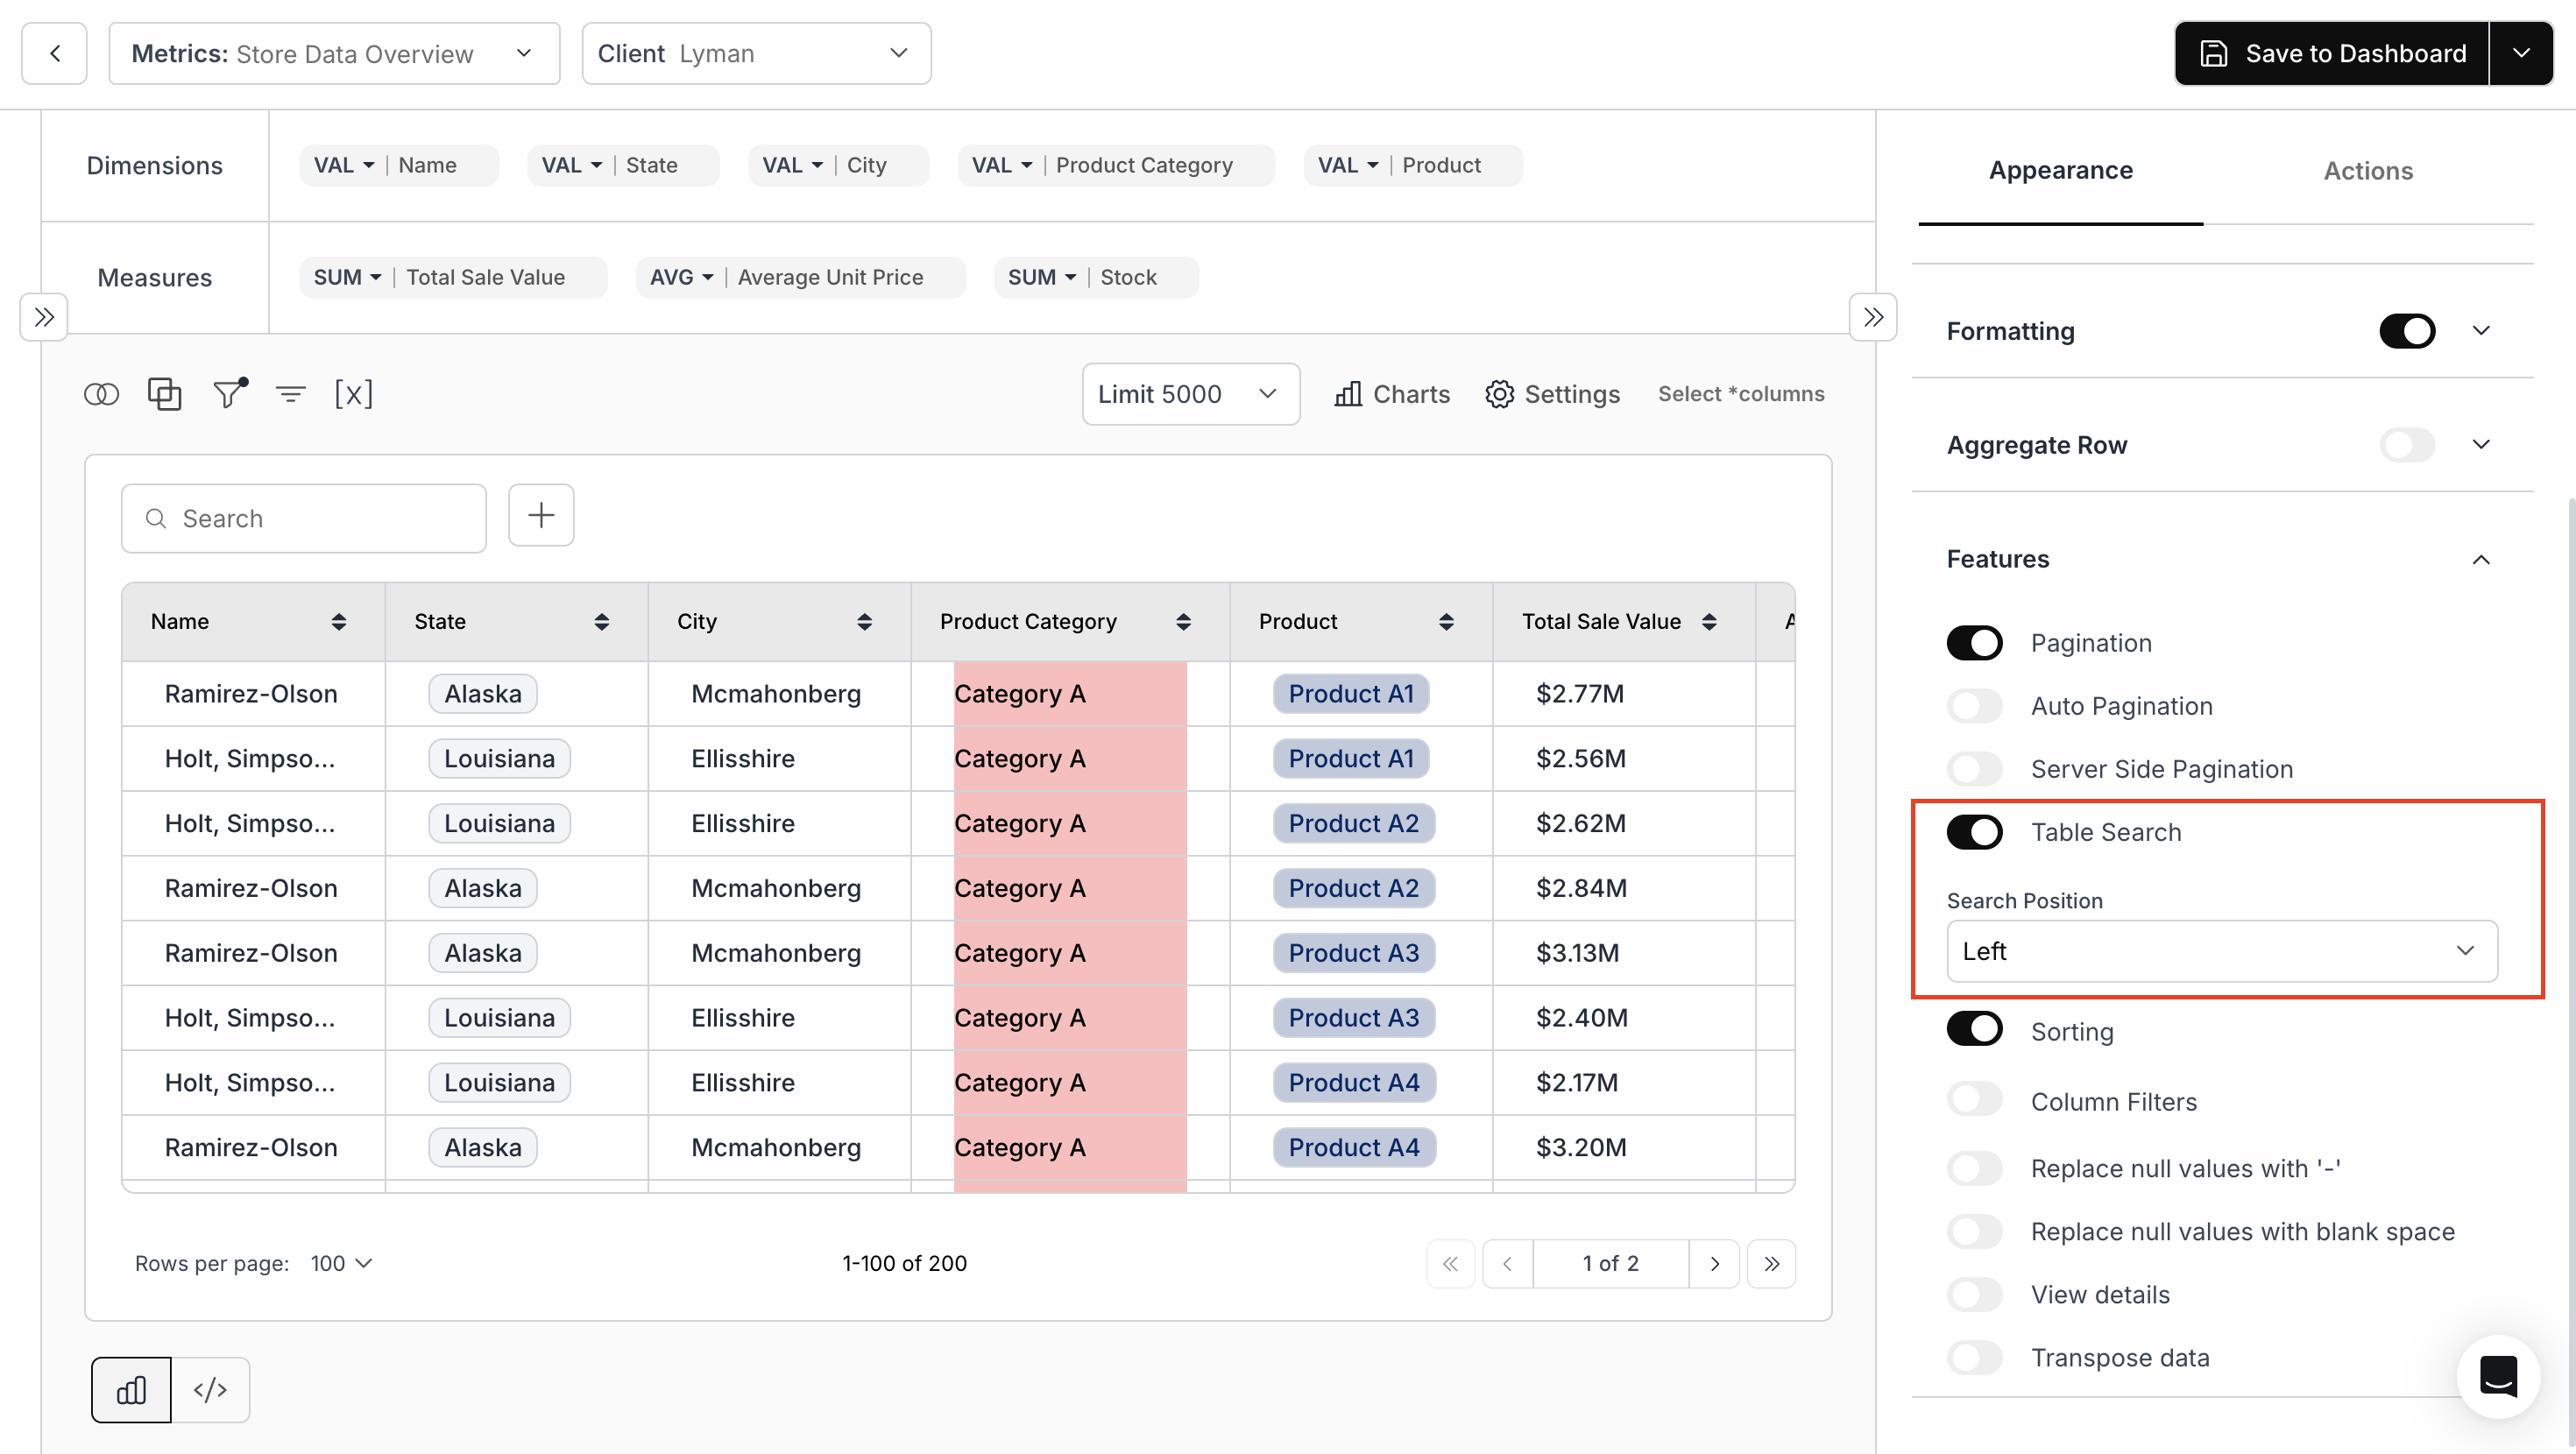
- Table Search Position Options:
Configurable search positioning has been introduced for table charts and components.
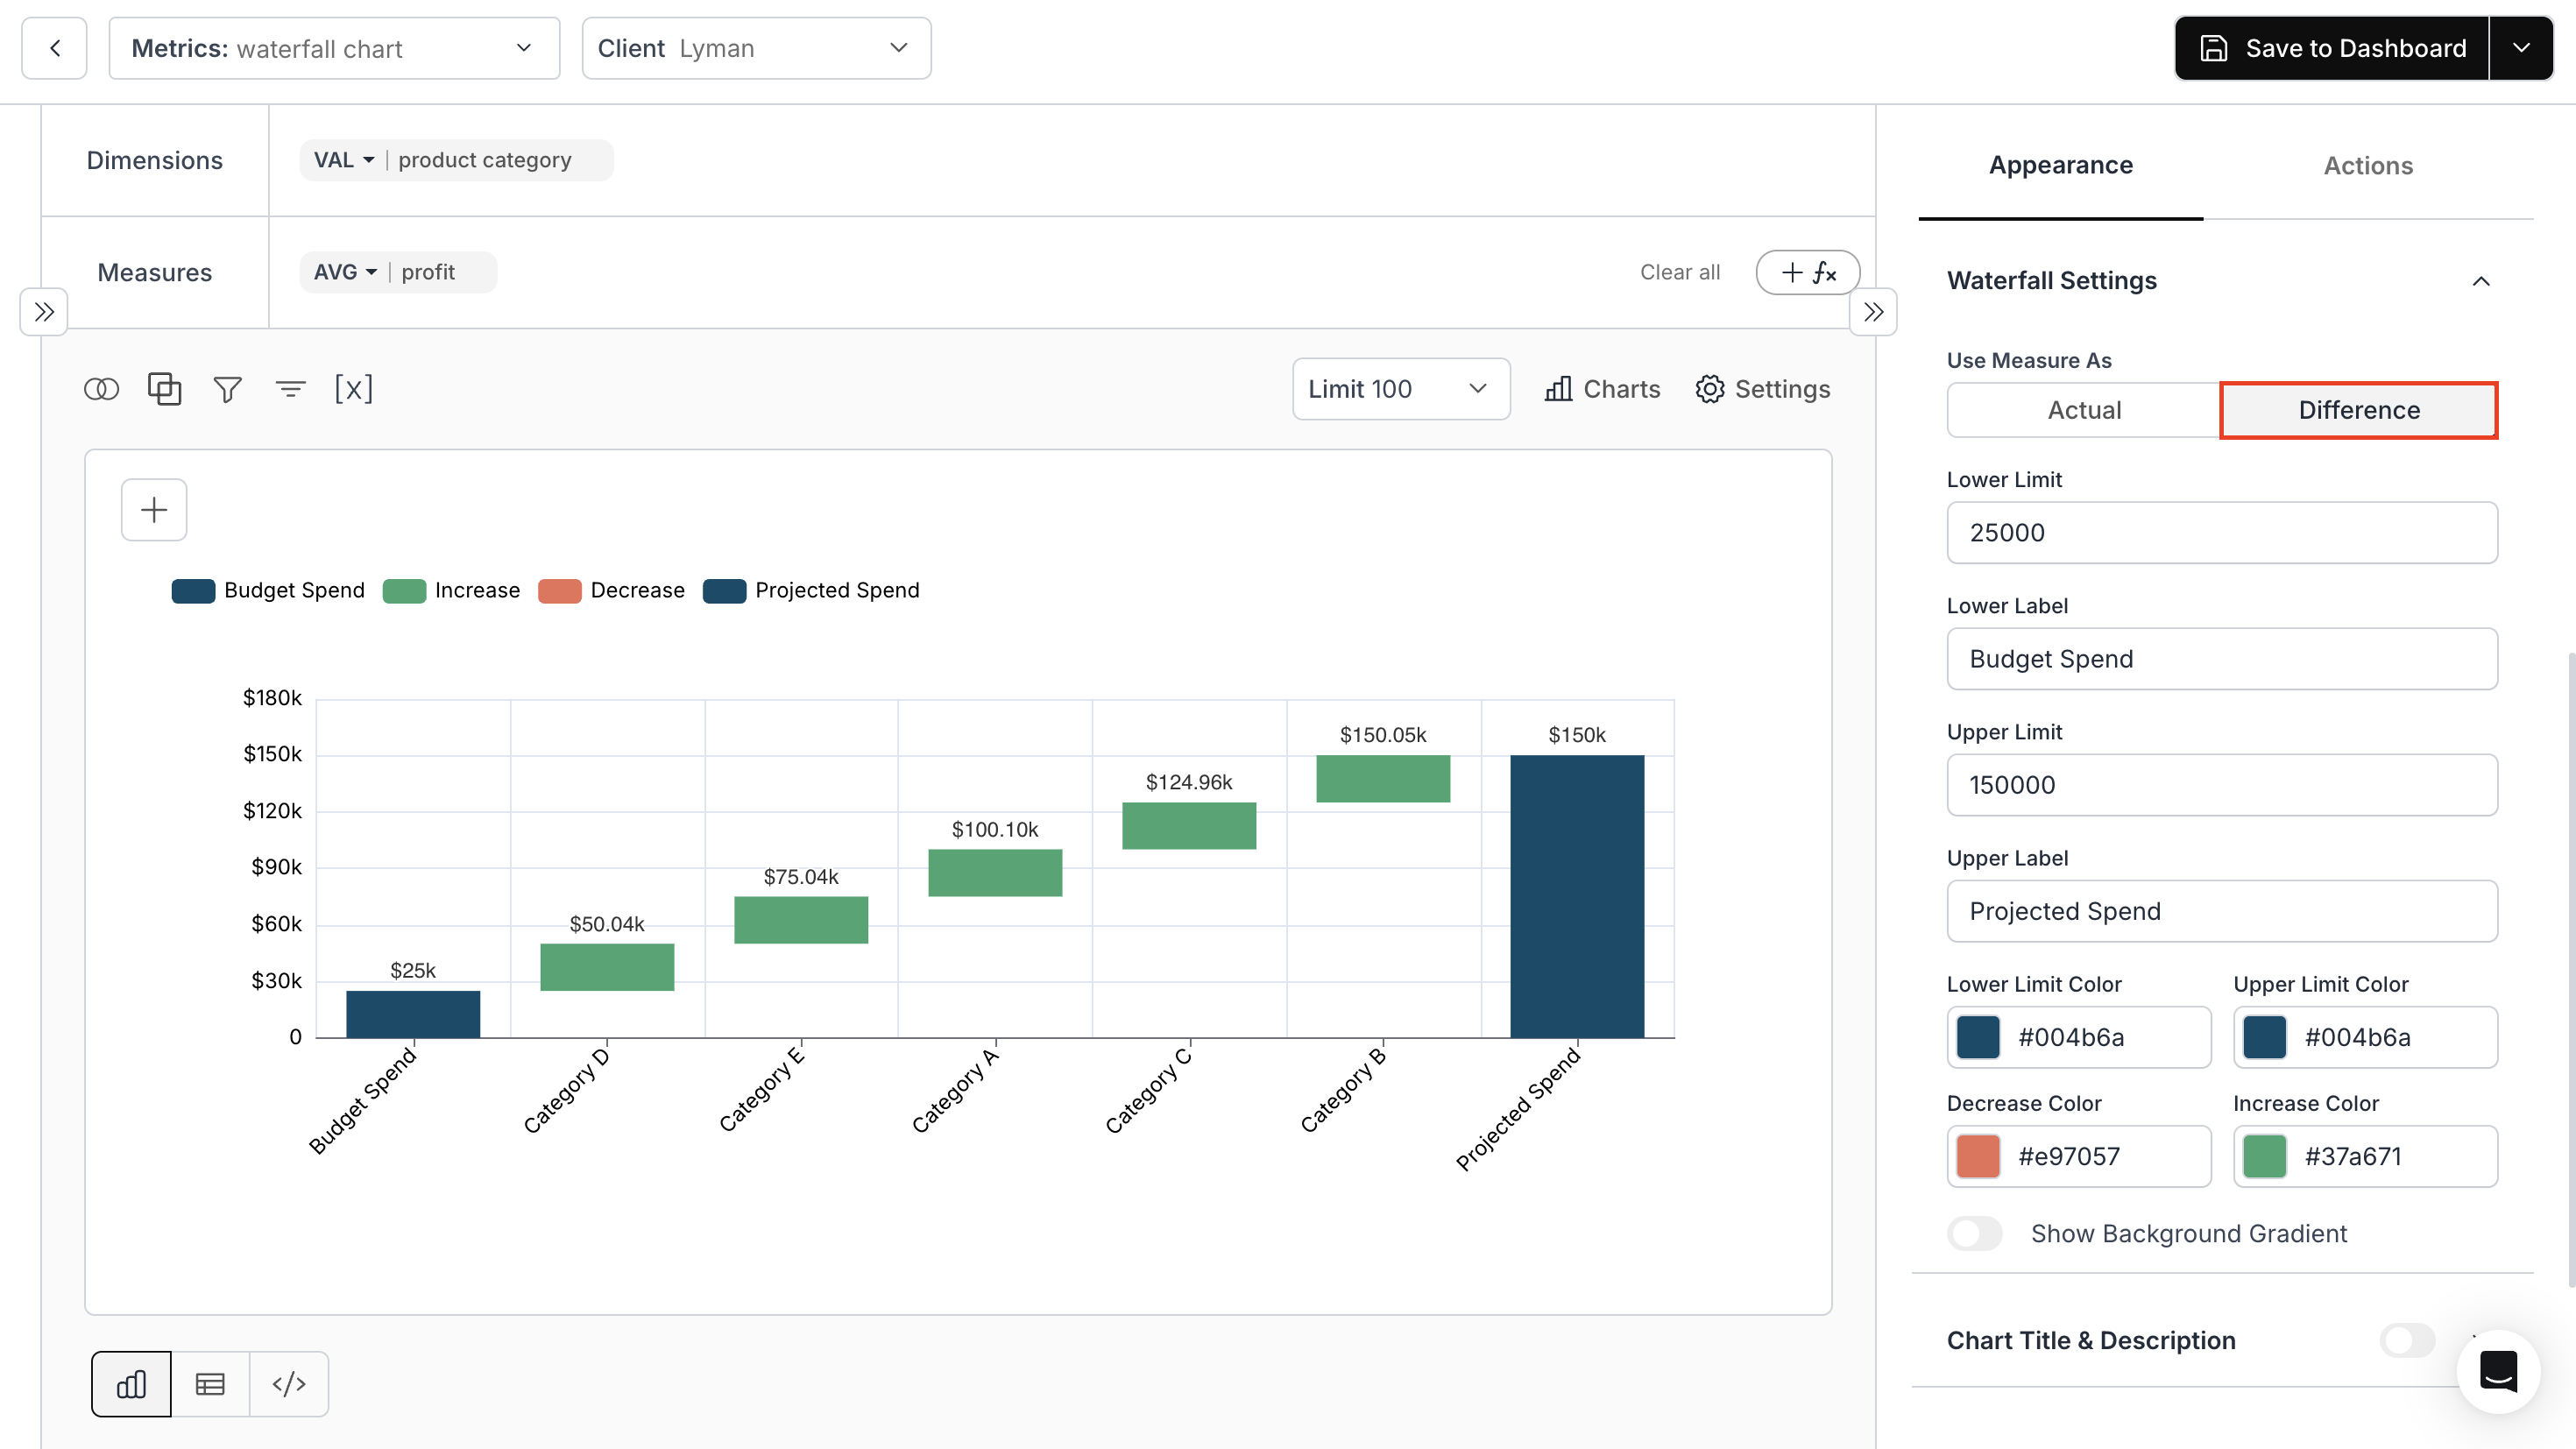
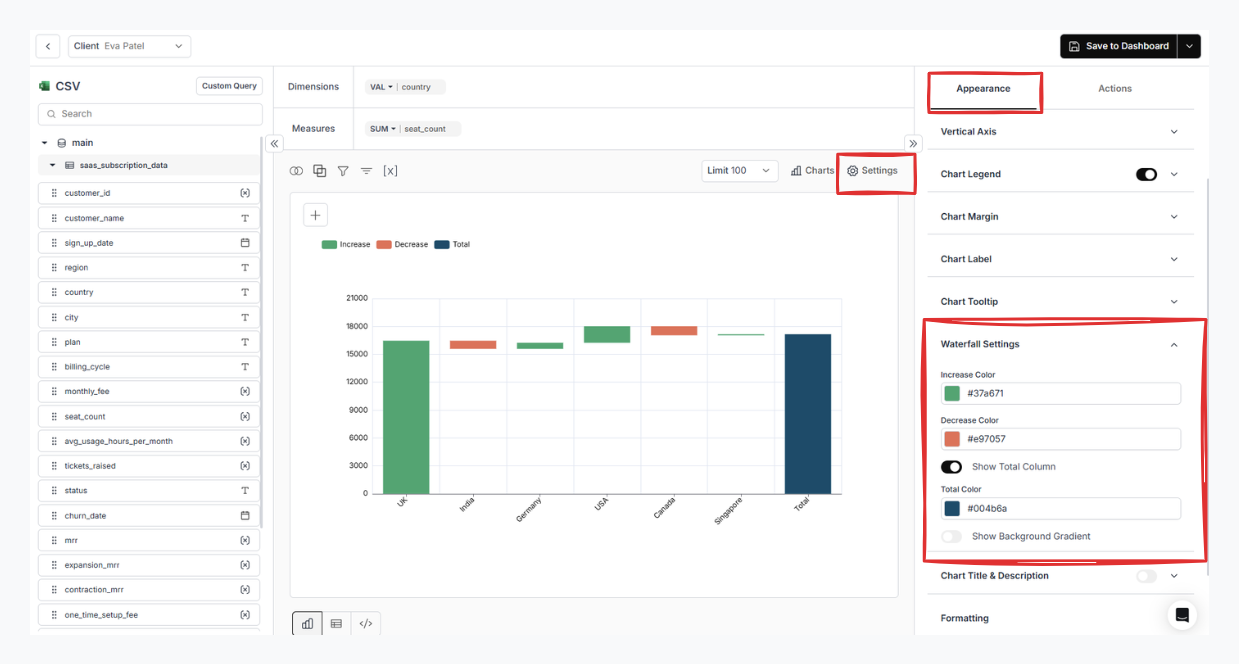
- Waterfall Chart:
Measures can now be treated as difference values by selecting the “Difference” option in the Waterfall Settings section.
- Fullscreen Trigger via Title Click in Embed:
A new prop,enable-title-click-fullscreen={true}, has been added to enable fullscreen mode when clicking the chart title.
Fixes:
-
Waterfall Chart:
Issues with chart labels have been resolved. -
ExpiryTime Type in Guest Token Creation & Rotate Token API:
Handling of theexpiryTimeparameter inguestTokenandguestTokenV2functions has been improved to ensure consistent data types. -
Invite User & Resend Mail Flow:
Issues in the invite user and resend mail flow have been resolved.
February 18, 2026 Updates
February 18, 2026 Updates
Enhancements:
- Create Dashboard Embed API – Response field documented:
The Create an Empty Dashboard Embed API response now documents thenamefield. Successful responses fromPOST /api/v2/data-app/dashboard-embedsincludeid,error, andname(the embed configuration name, ordashboardIdwhennameis not provided). Request examples and response examples in the docs have been updated accordingly.
February 4, 2026 Updates
February 4, 2026 Updates
Features:
- AI Suggestions for SQL Editor:
Connect your LLM to enable AI-powered suggestions for table names, schema names, and column names.
- Validation of Allowed Embeds in Guest Token Creation:
We have added a feature to validate allowed embeds during the process of guest token creation.
Enhancements:
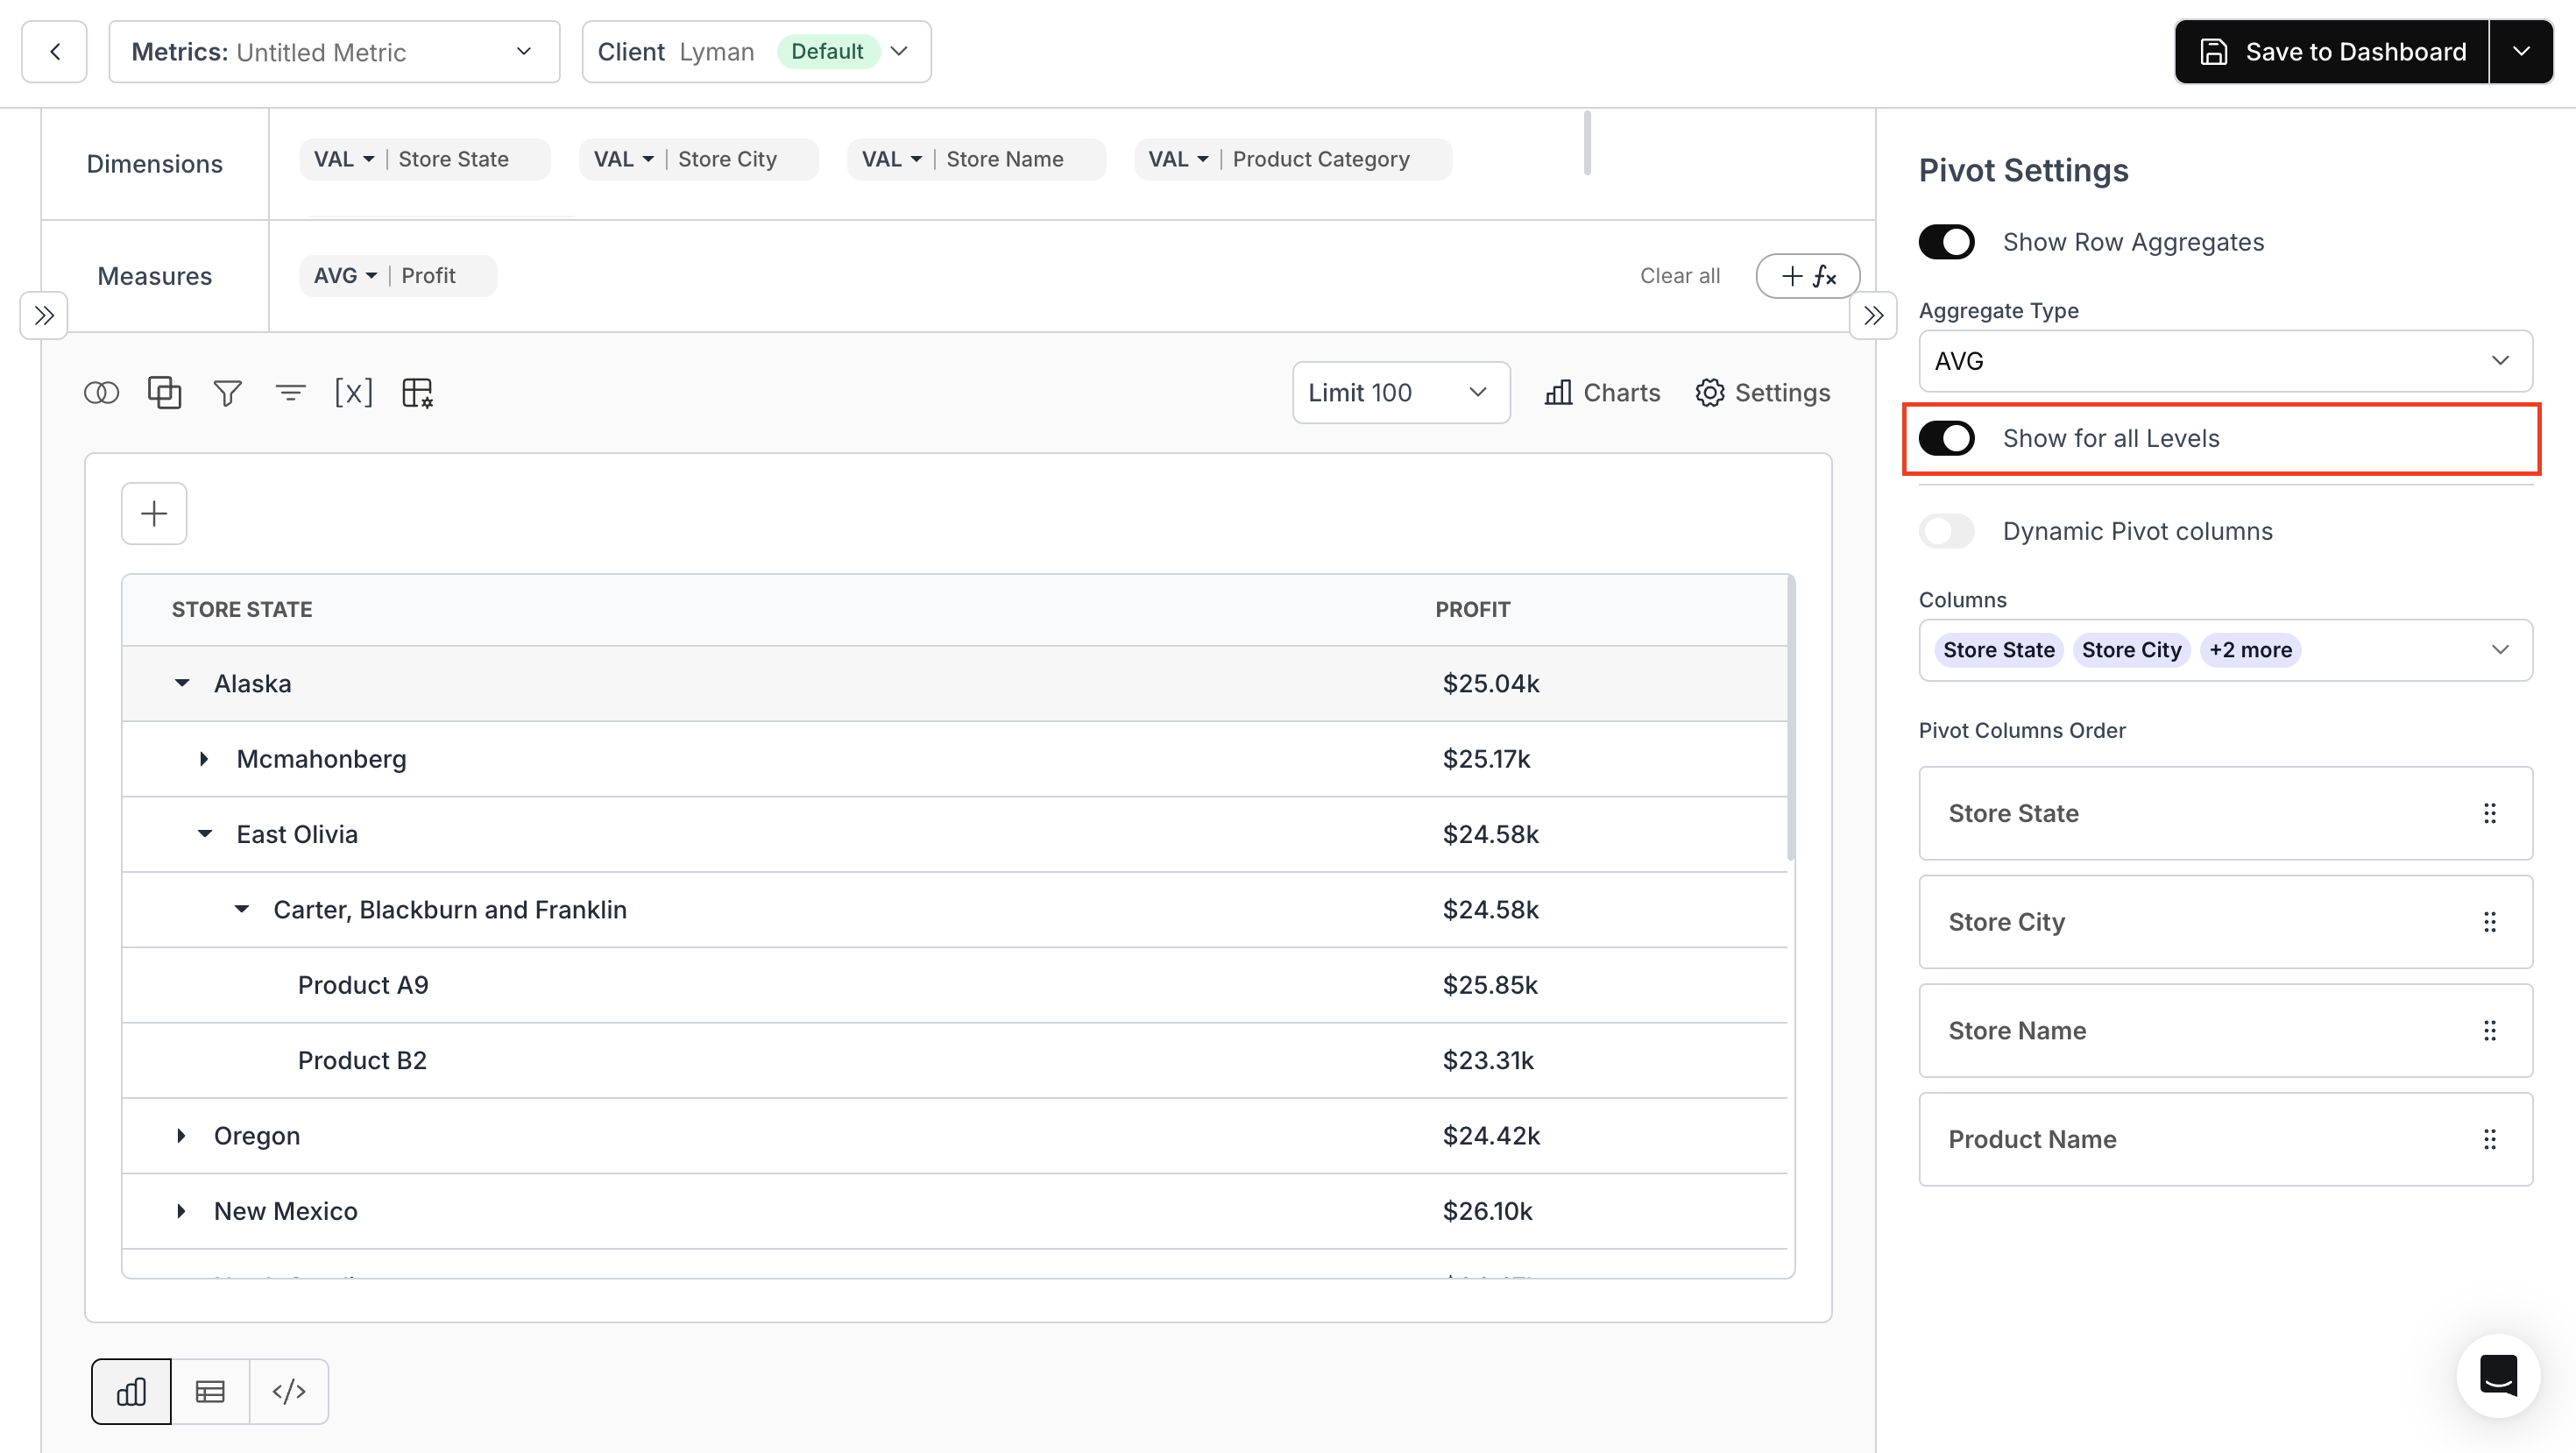
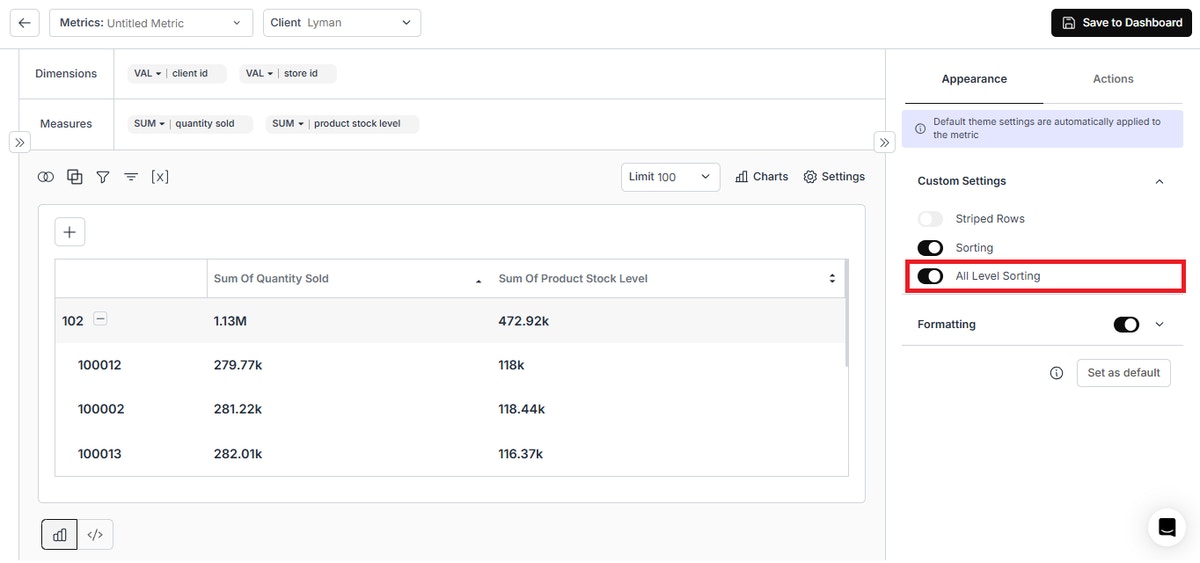
- Subtotals at all Hierarchy Levels in Pivot Table V3 Chart:
Enable the “Show for all Levels” toggle to display subtotals across all hierarchy levels.
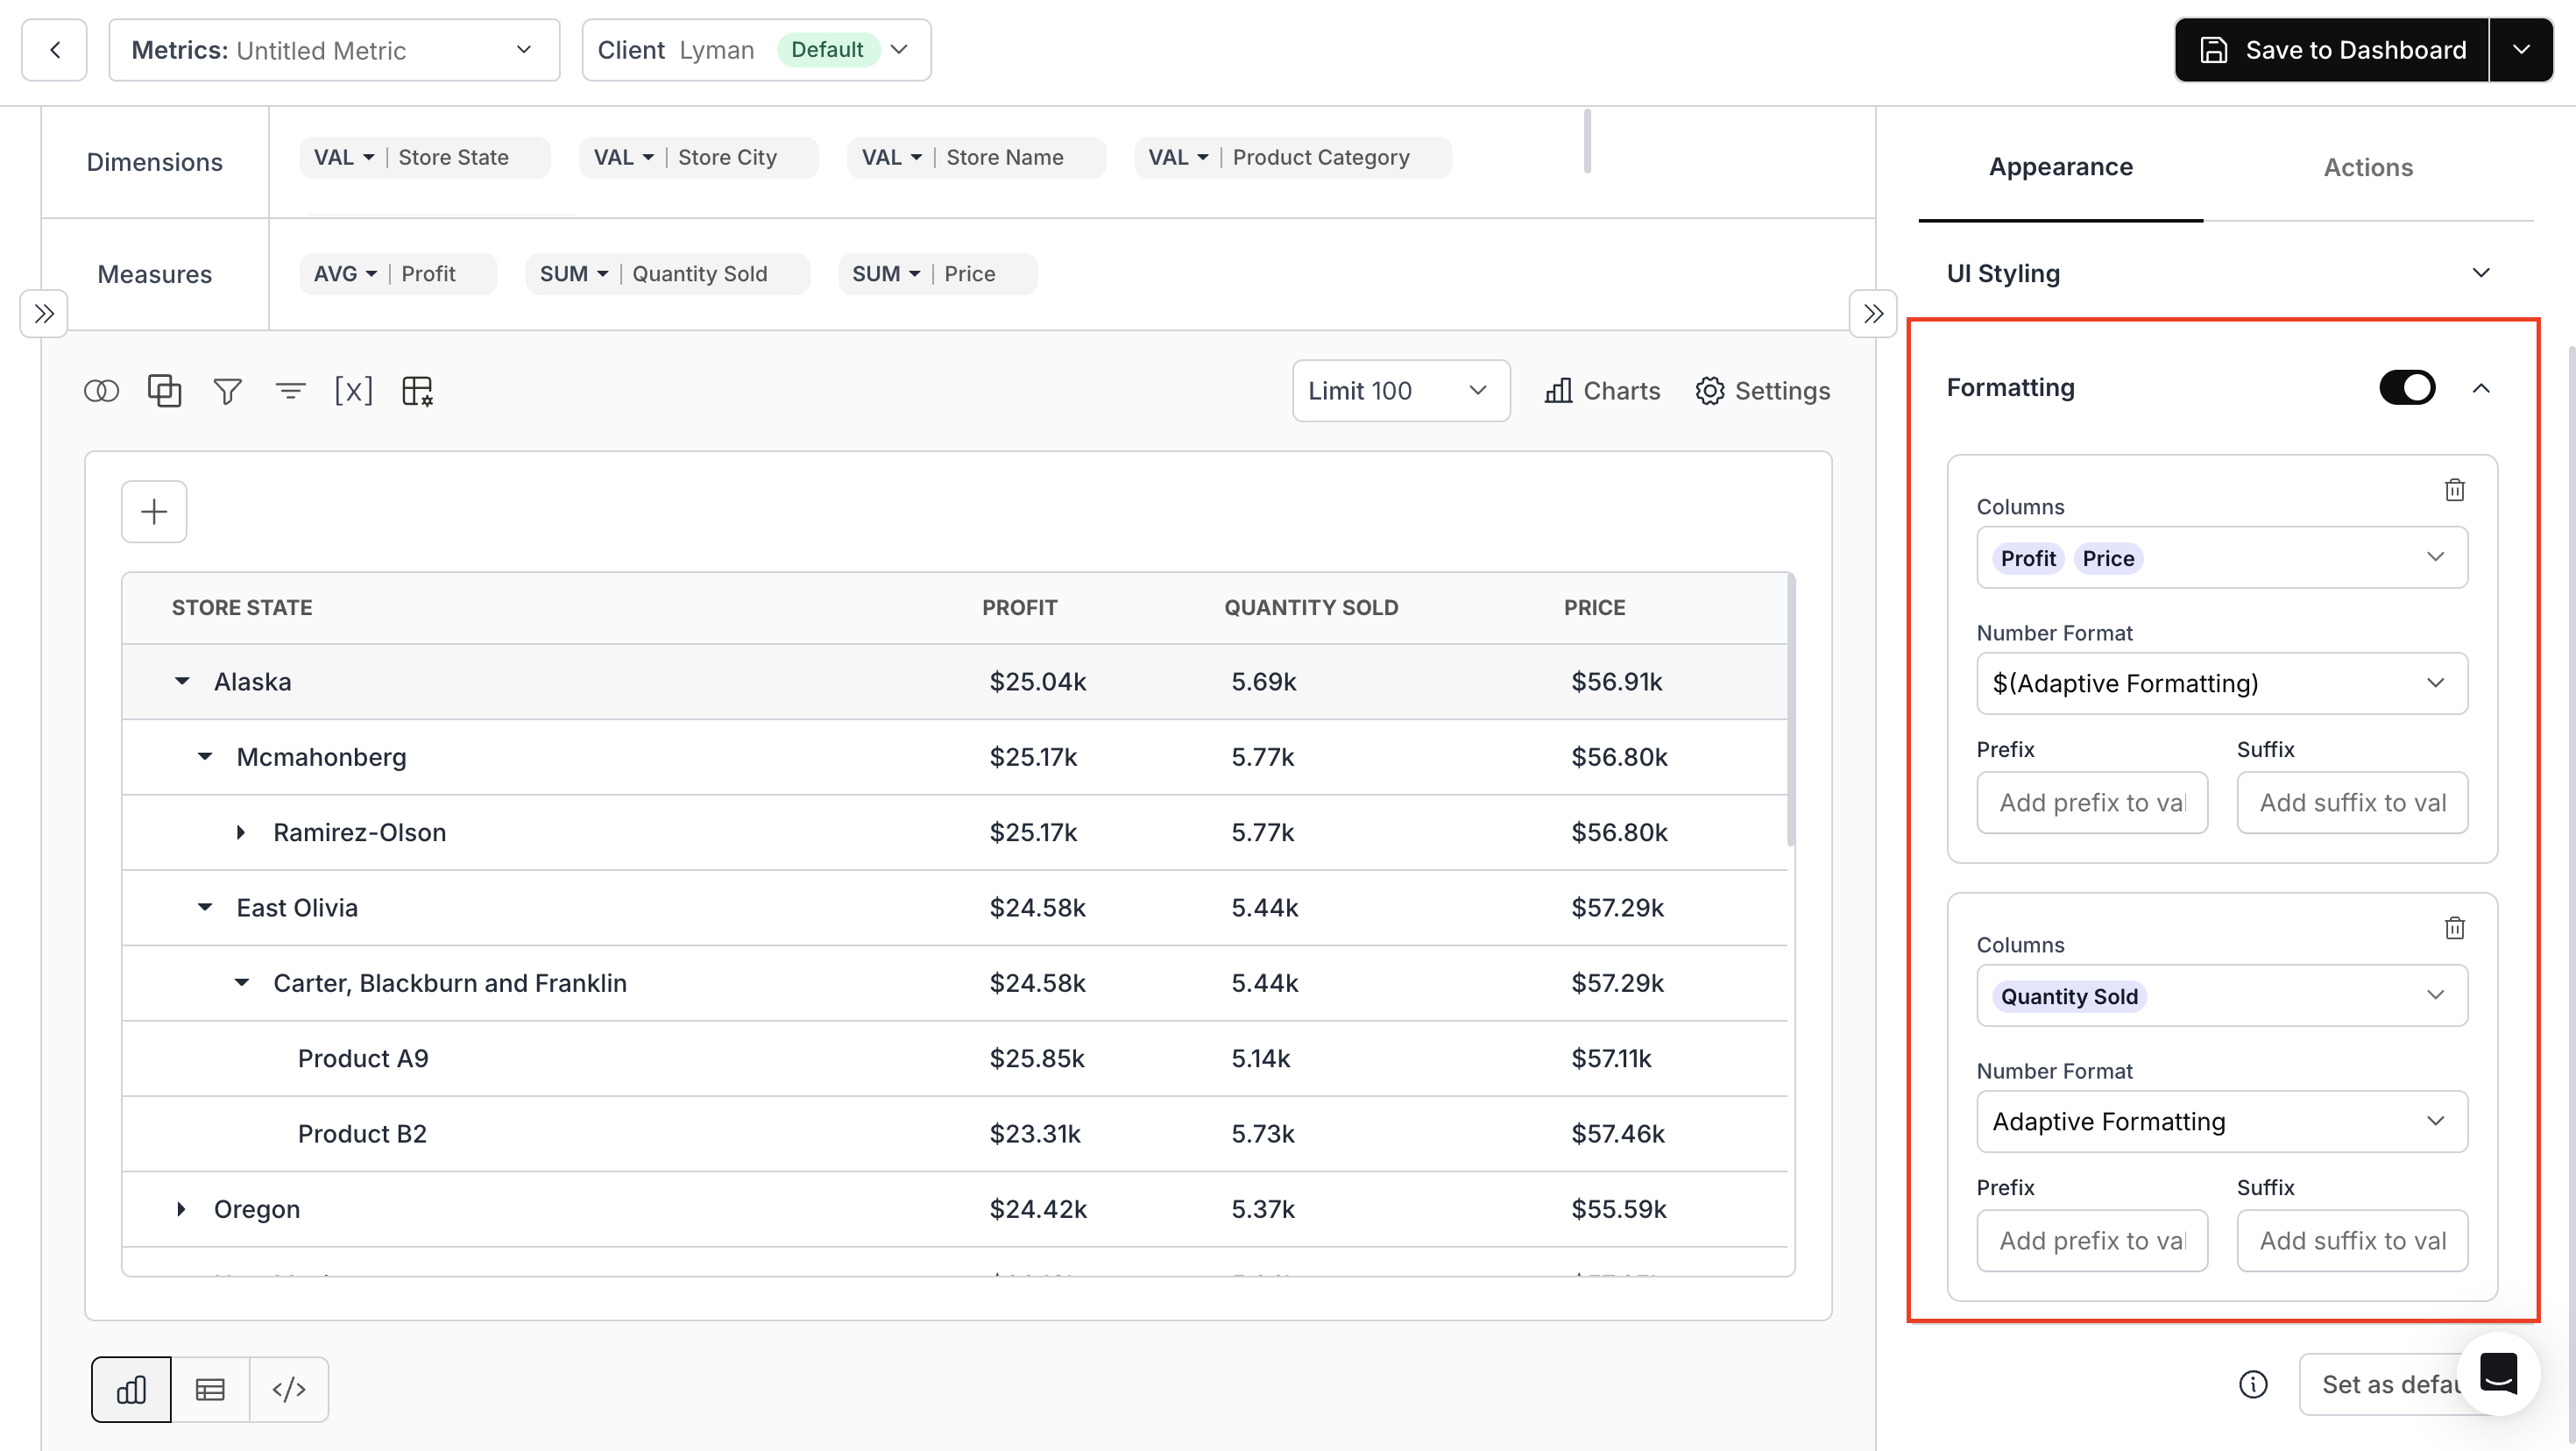
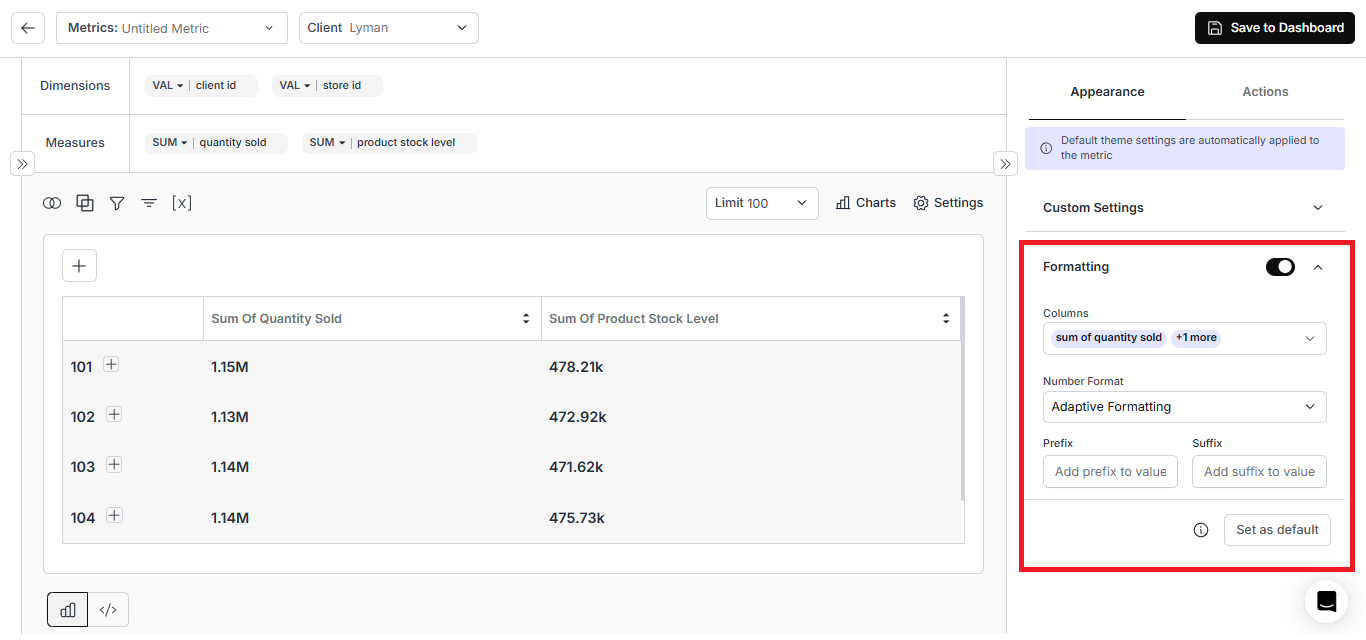
- Individual Column Formatting for Table Charts:
We have added support for formatting columns individually in Table, Horizontal Table, Pivot V2 & V3 charts.
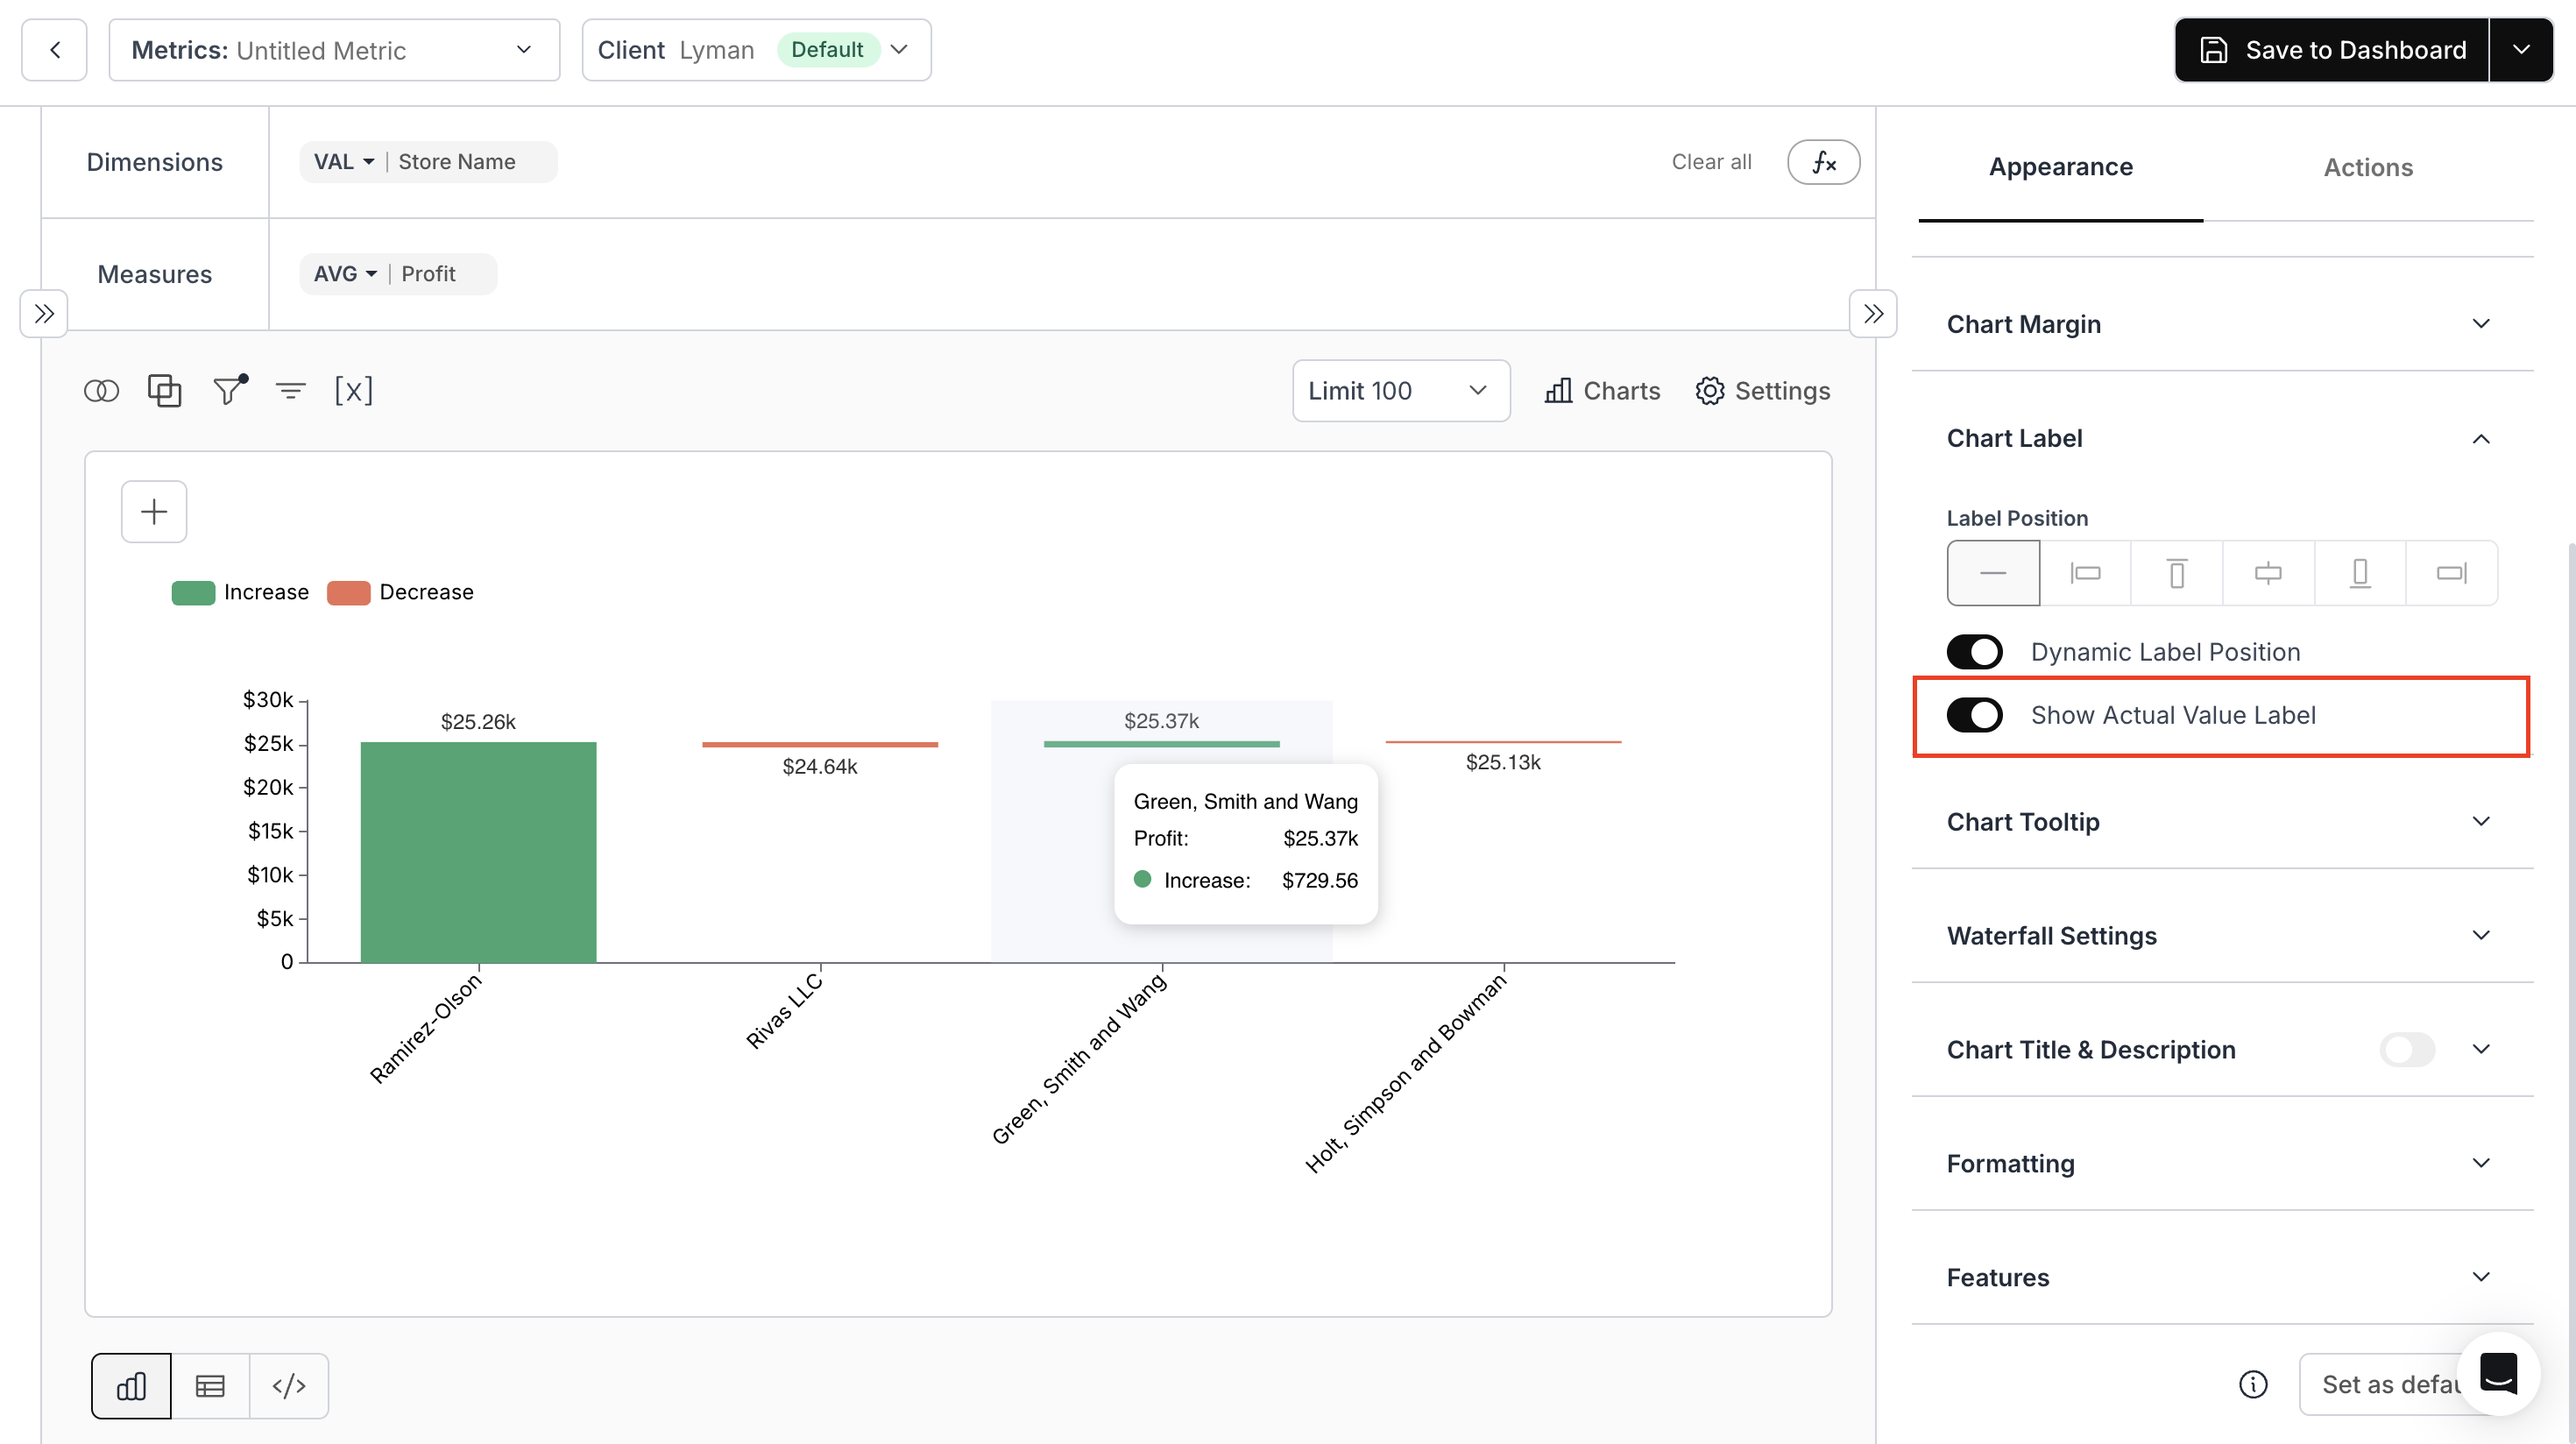
- Raw Values as Chart Labels in Waterfall Charts (V1 & V2):
Turn on the “Show Actual Value Label” toggle to view raw values in Chart Label instead of increase or decrease.
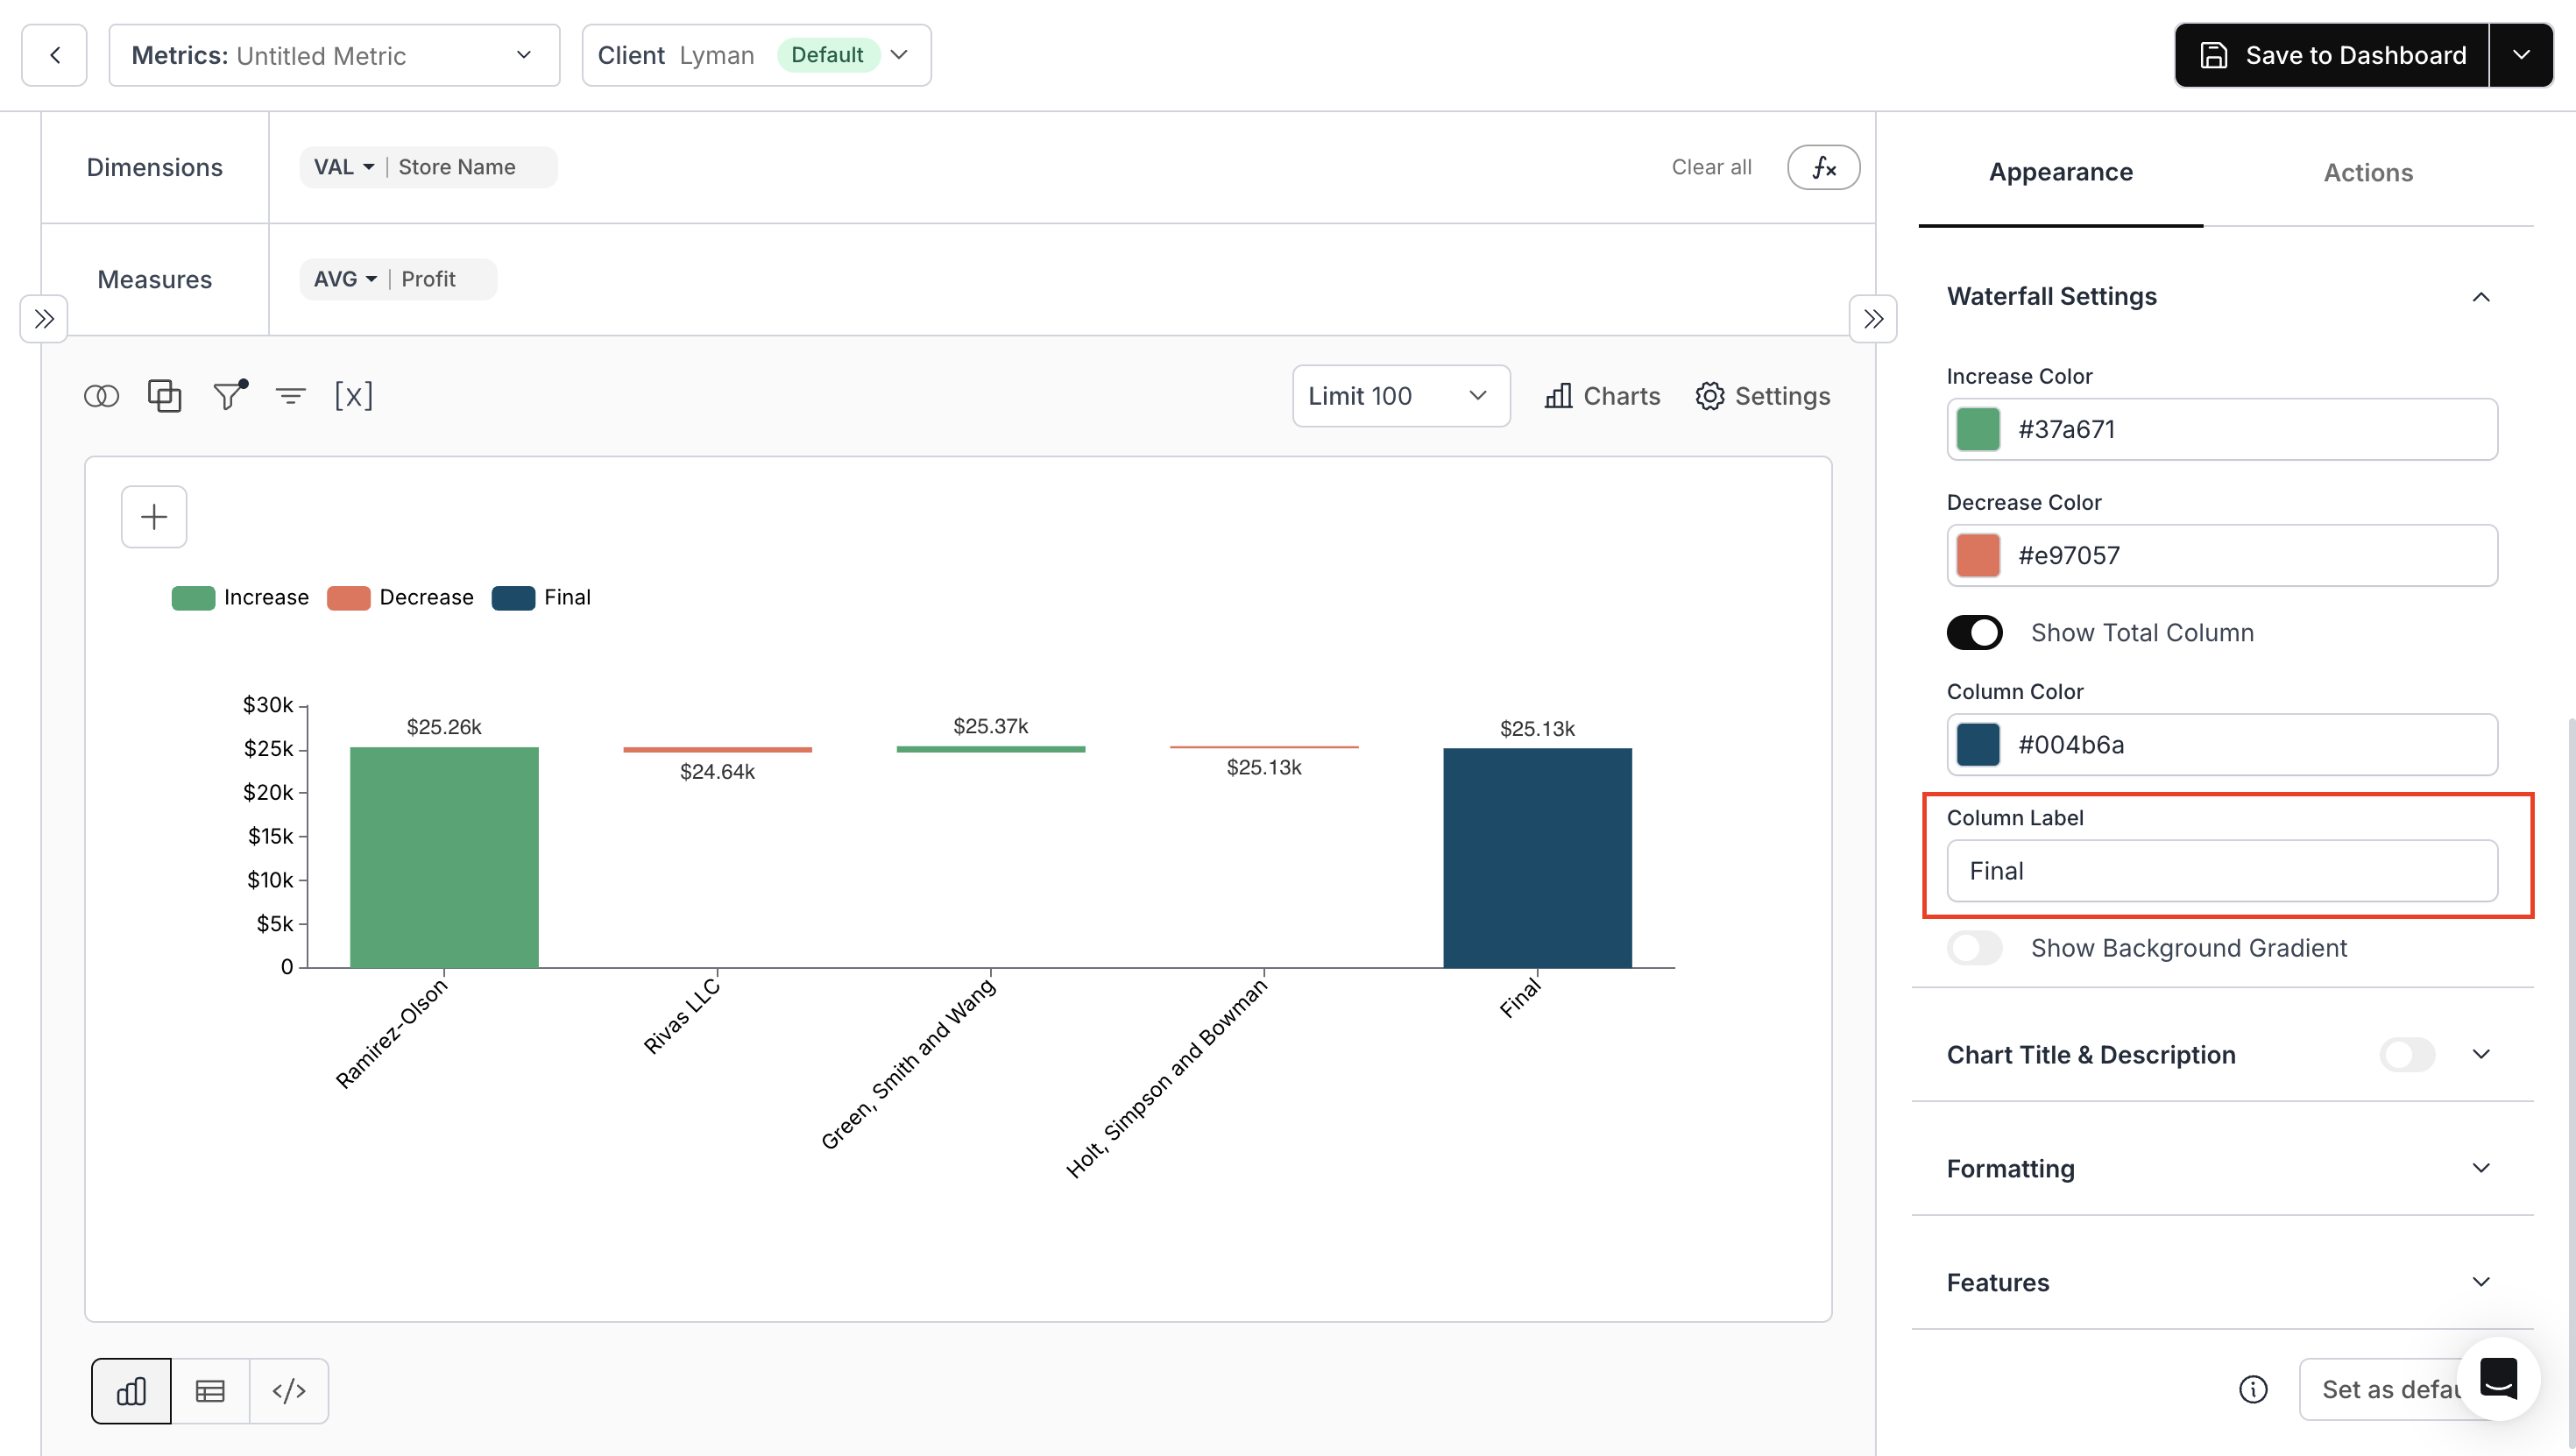
- Customizable Total Column in Waterfall Chart V2:
We have added support to customize the name of the “Total” column in Waterfall Chart V2.
Fixes:
-
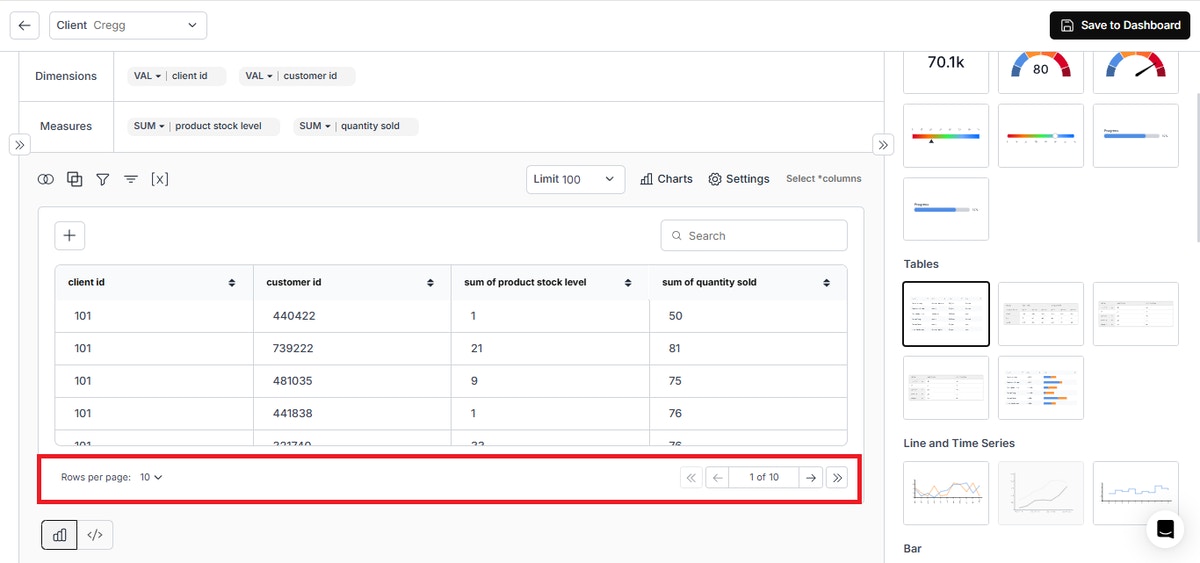
Limit and Rows per Page Settings:
Resolved an issue where settings for limit and rows per page settings were not retained in the dashboard. -
Improved LLM Settings Behavior:
Model dropdown is enabled only after API key validation, model selection is enforced post-validation, the first validated LLM is auto-set as default, and redundant UI status messages have been removed.
January 21, 2026 Updates
January 21, 2026 Updates
Features:
- Improved Join Handling in End-User Metric Creation:
Updated the join logic to apply joins only between selected tables and disabled column selection from tables that are not directly connected, reducing invalid joins and improving metric accuracy.
For example, when a One-to-Many relationship is defined between Orders and Shipments, dragging a column from Shipments will surface only the Shipments and Orders tables for selection. (Gif 1)
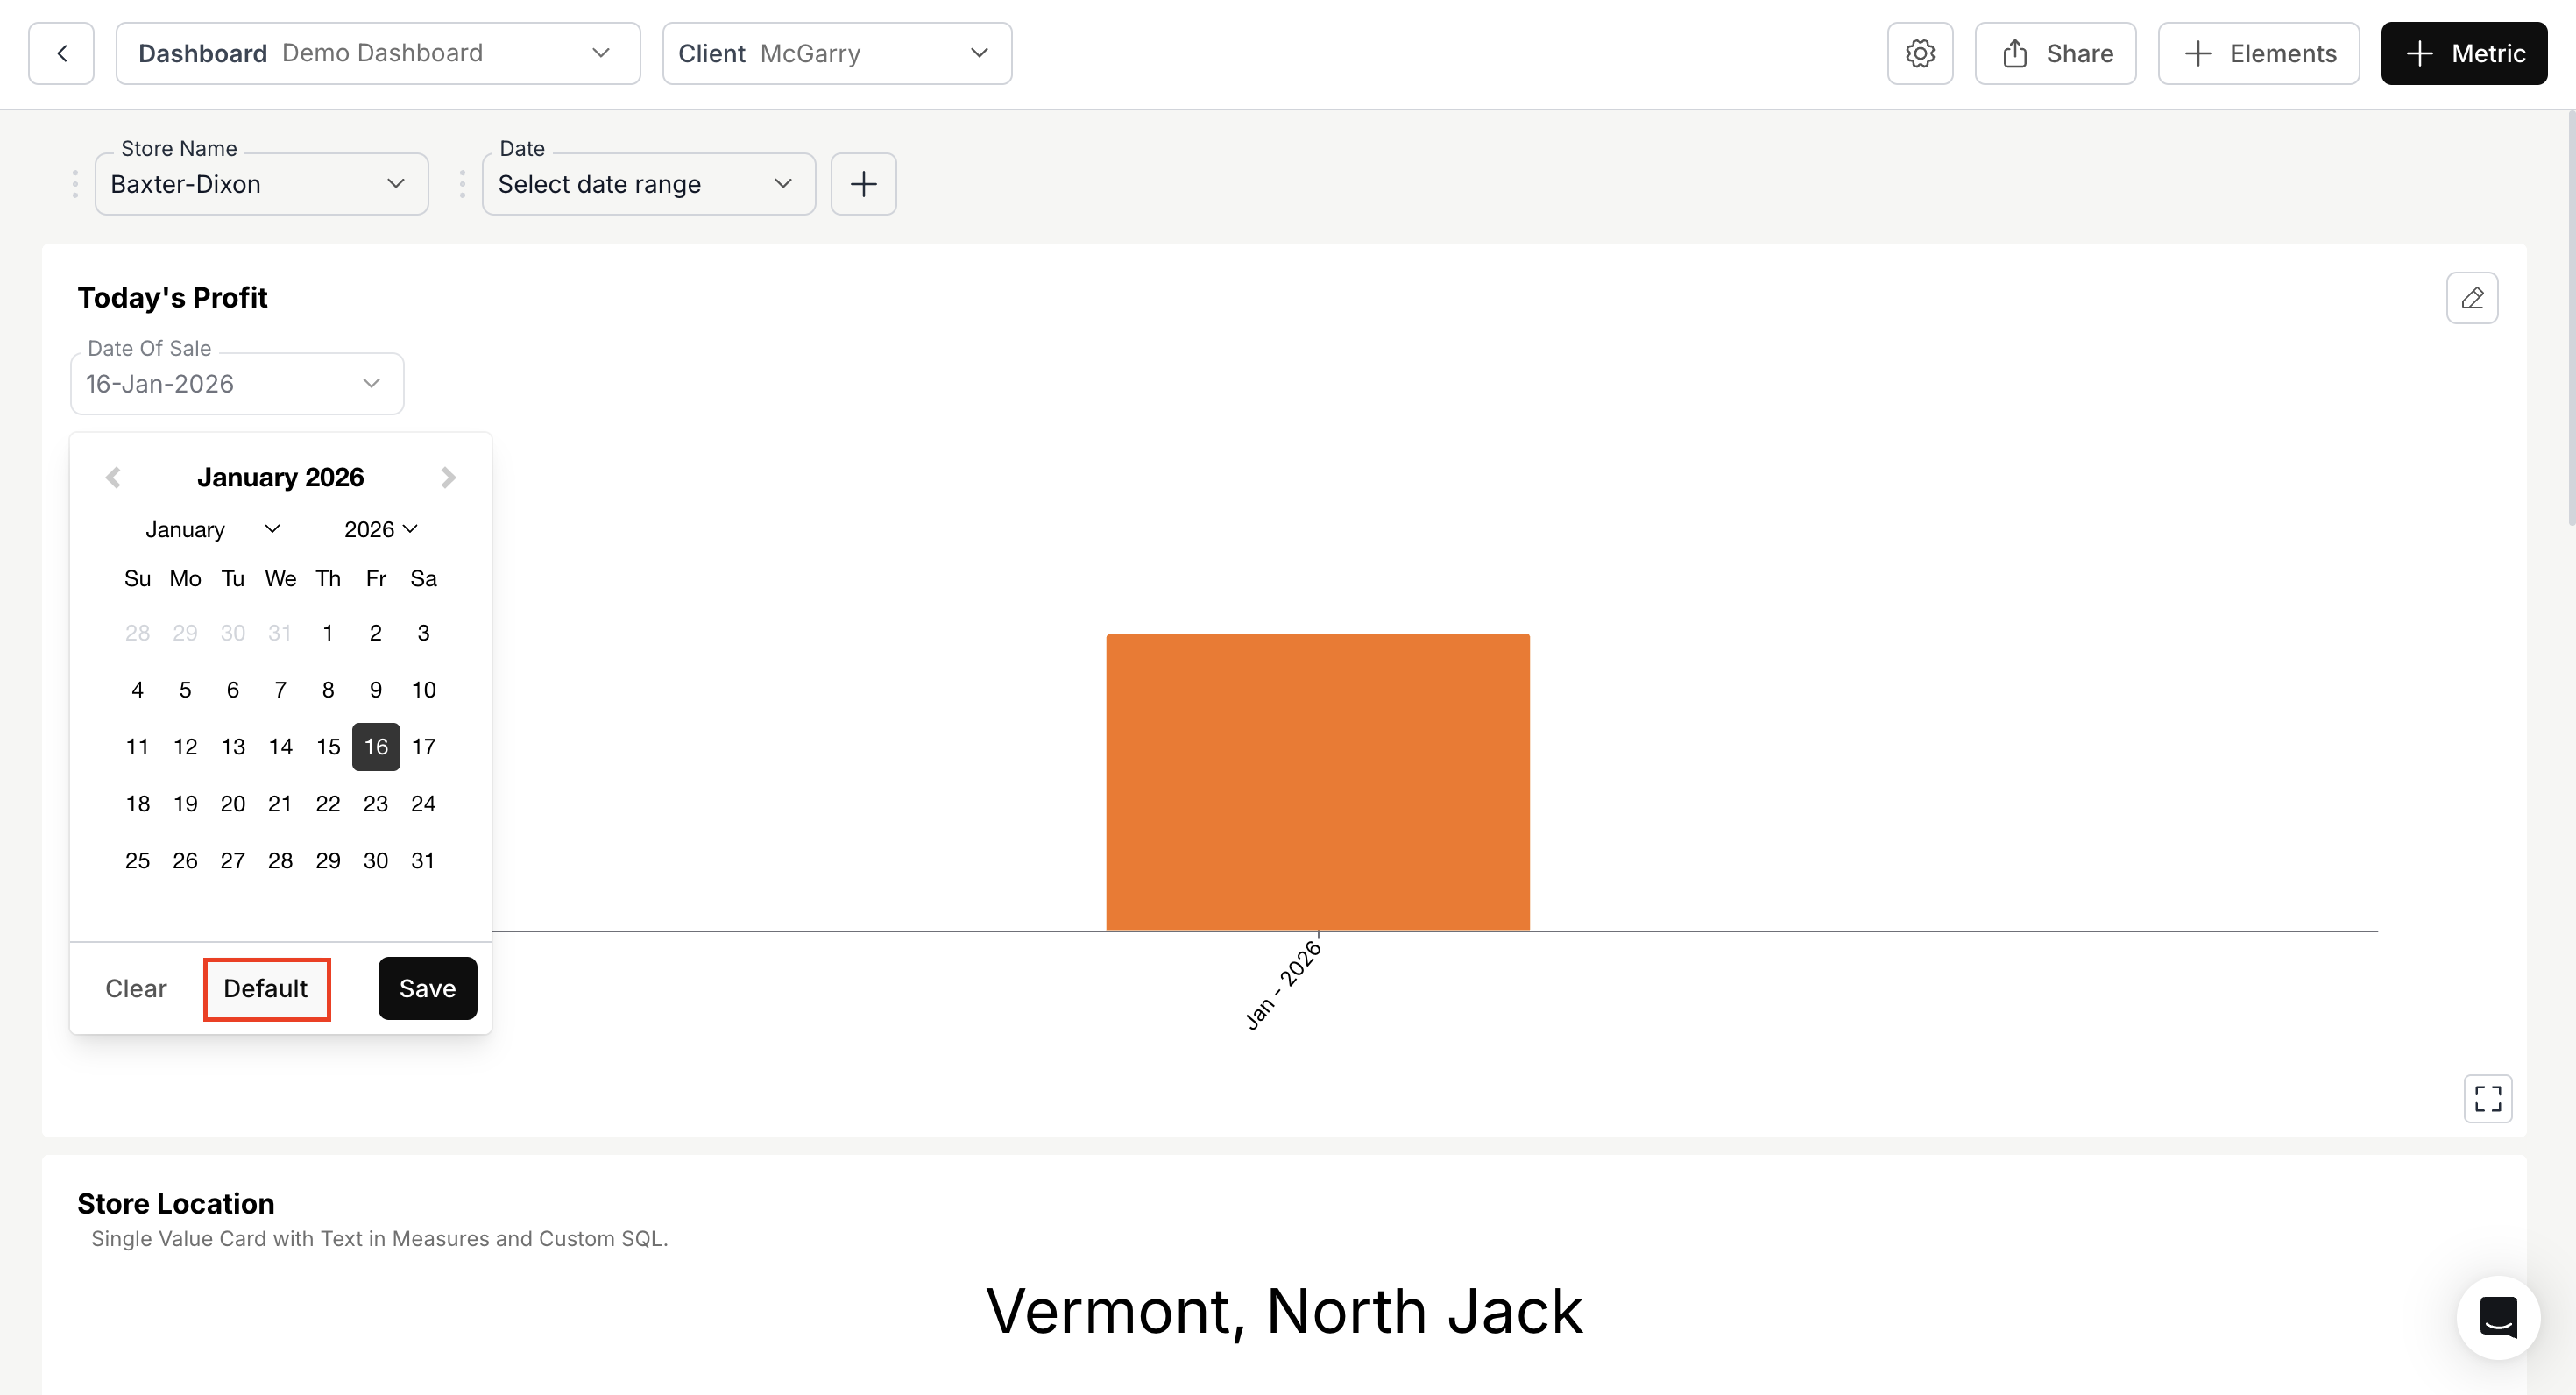
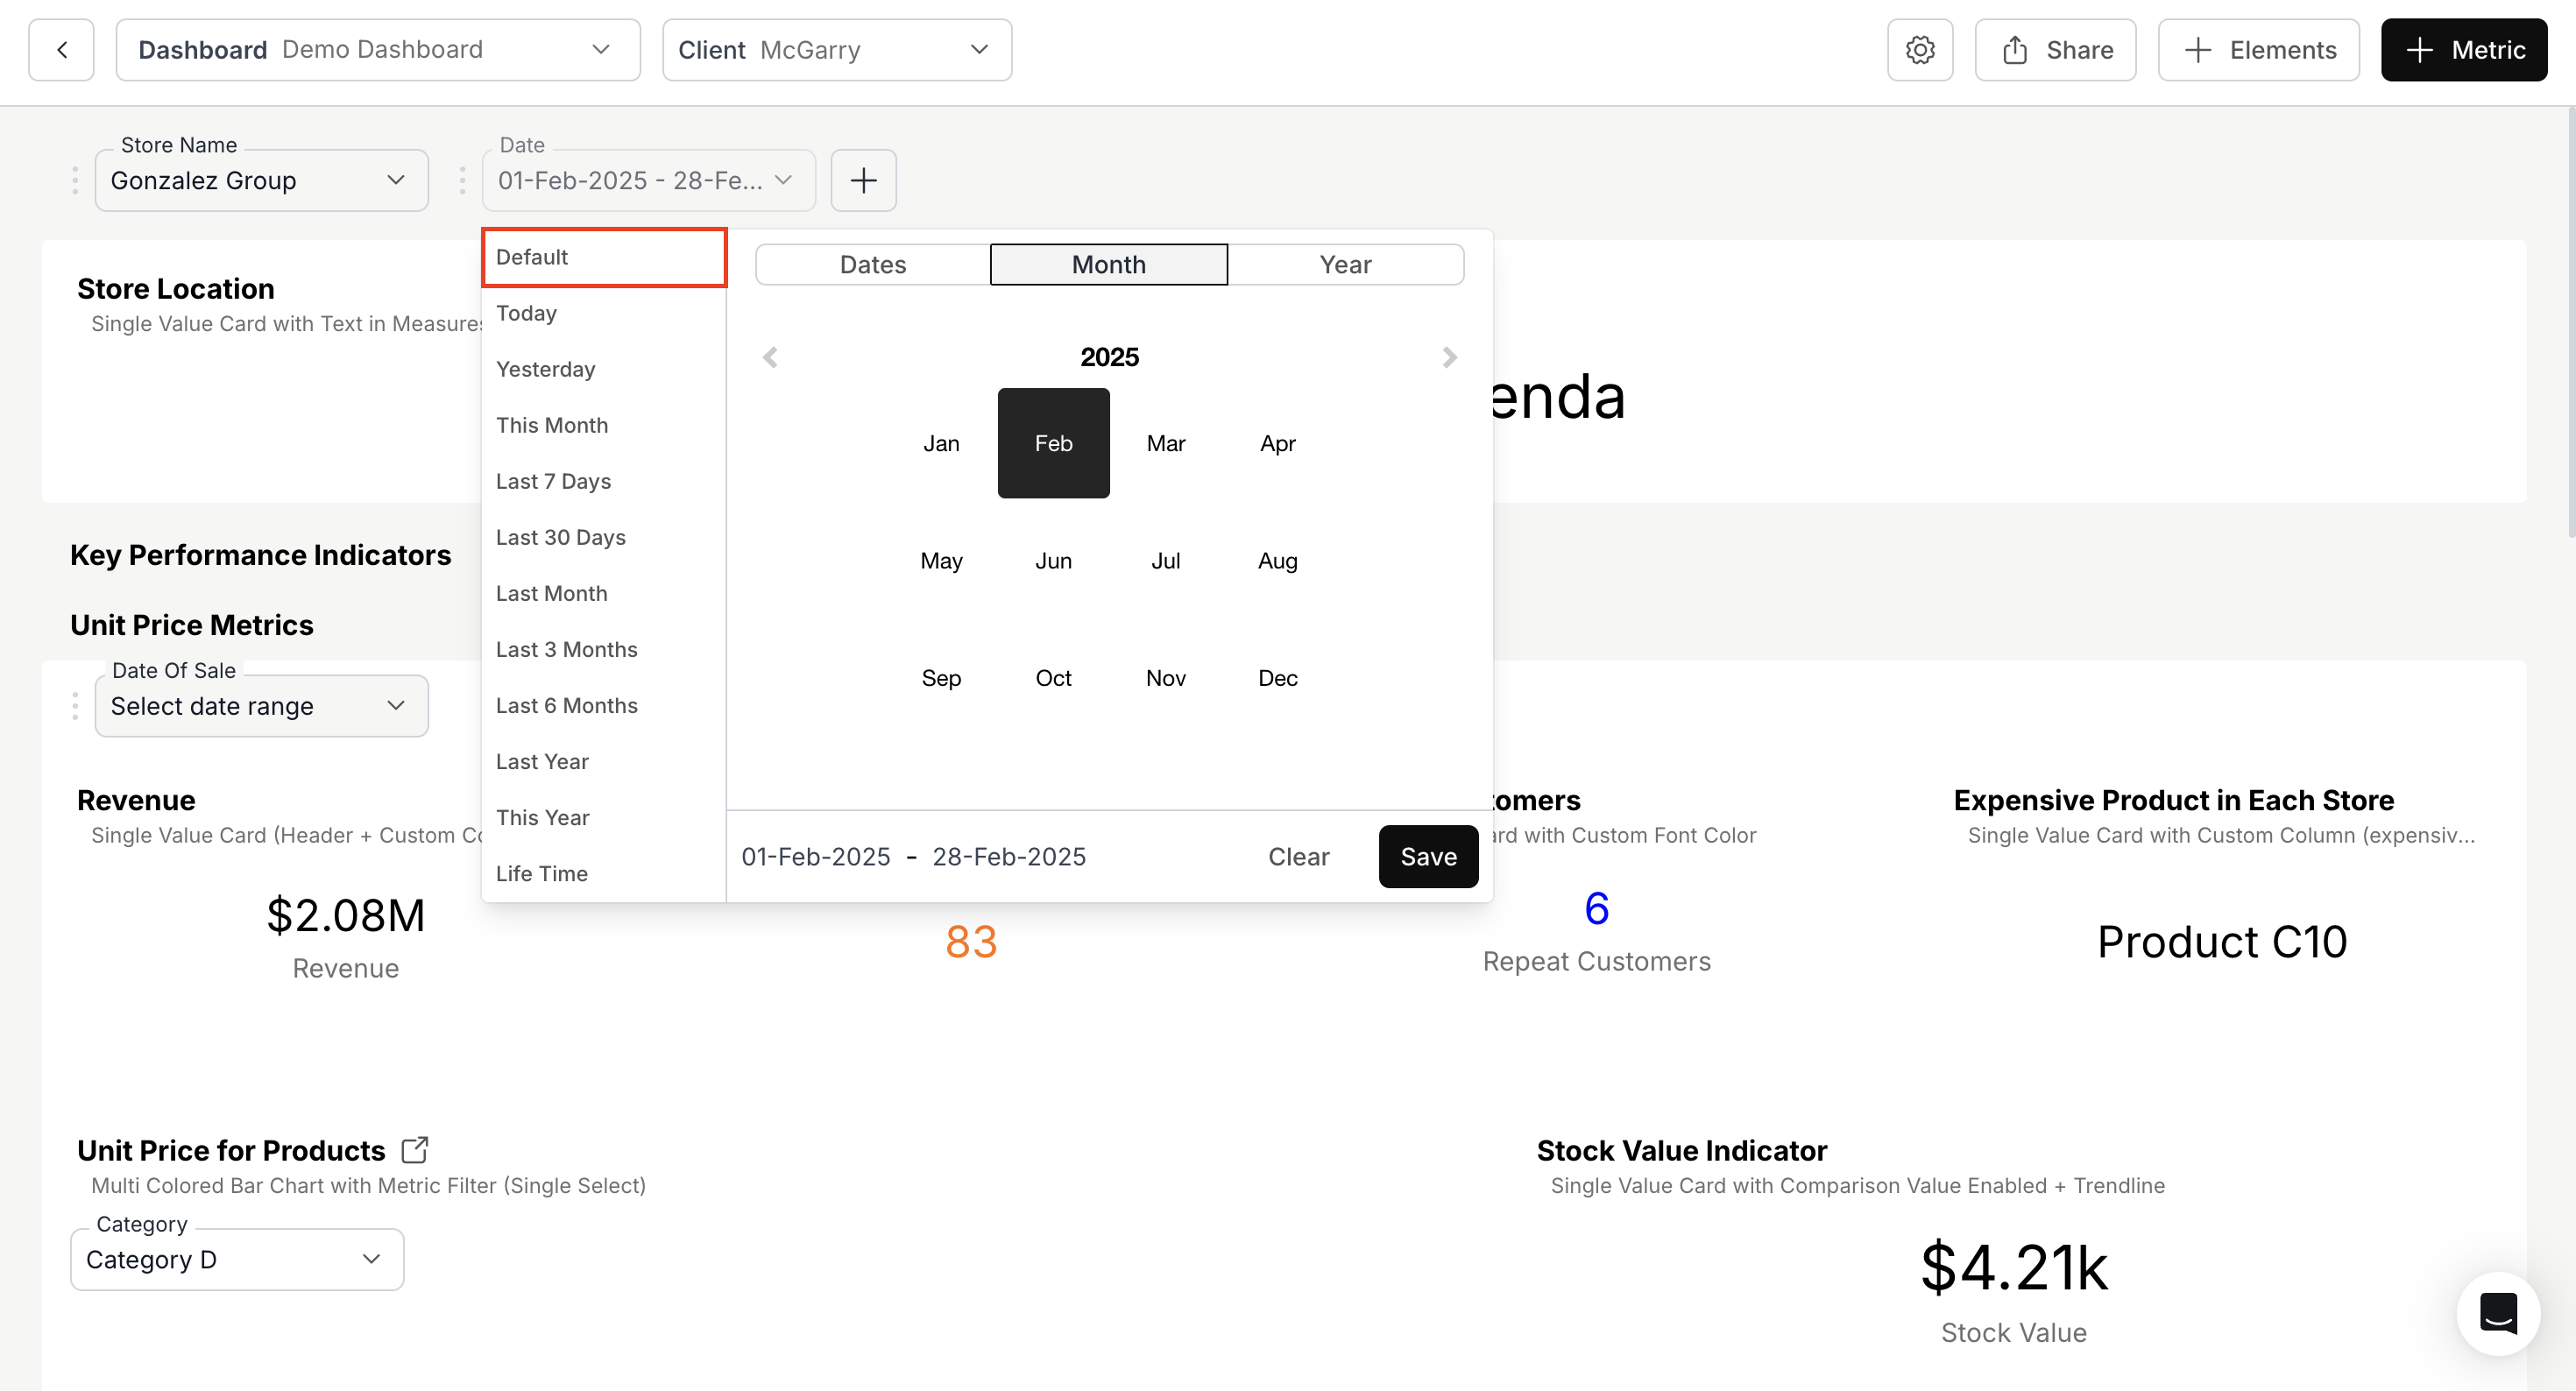
- Revert Option to Default Date in Metric and Dashboard Filters:
Users can now switch back to the default date in both metric-level and dashboard-level filters.
Enhancements:
-
Settings Button Enhancement in Embed:
Addedsettings-iconprop to thedbn-dashboardcomponent.settings-icon={JSON.stringify({name: 'random',iconSvg: 'svg'})} -
PDF Table Header Wrapping:
Enabled text wrapping for table headers when downloading dashboards as PDFs. -
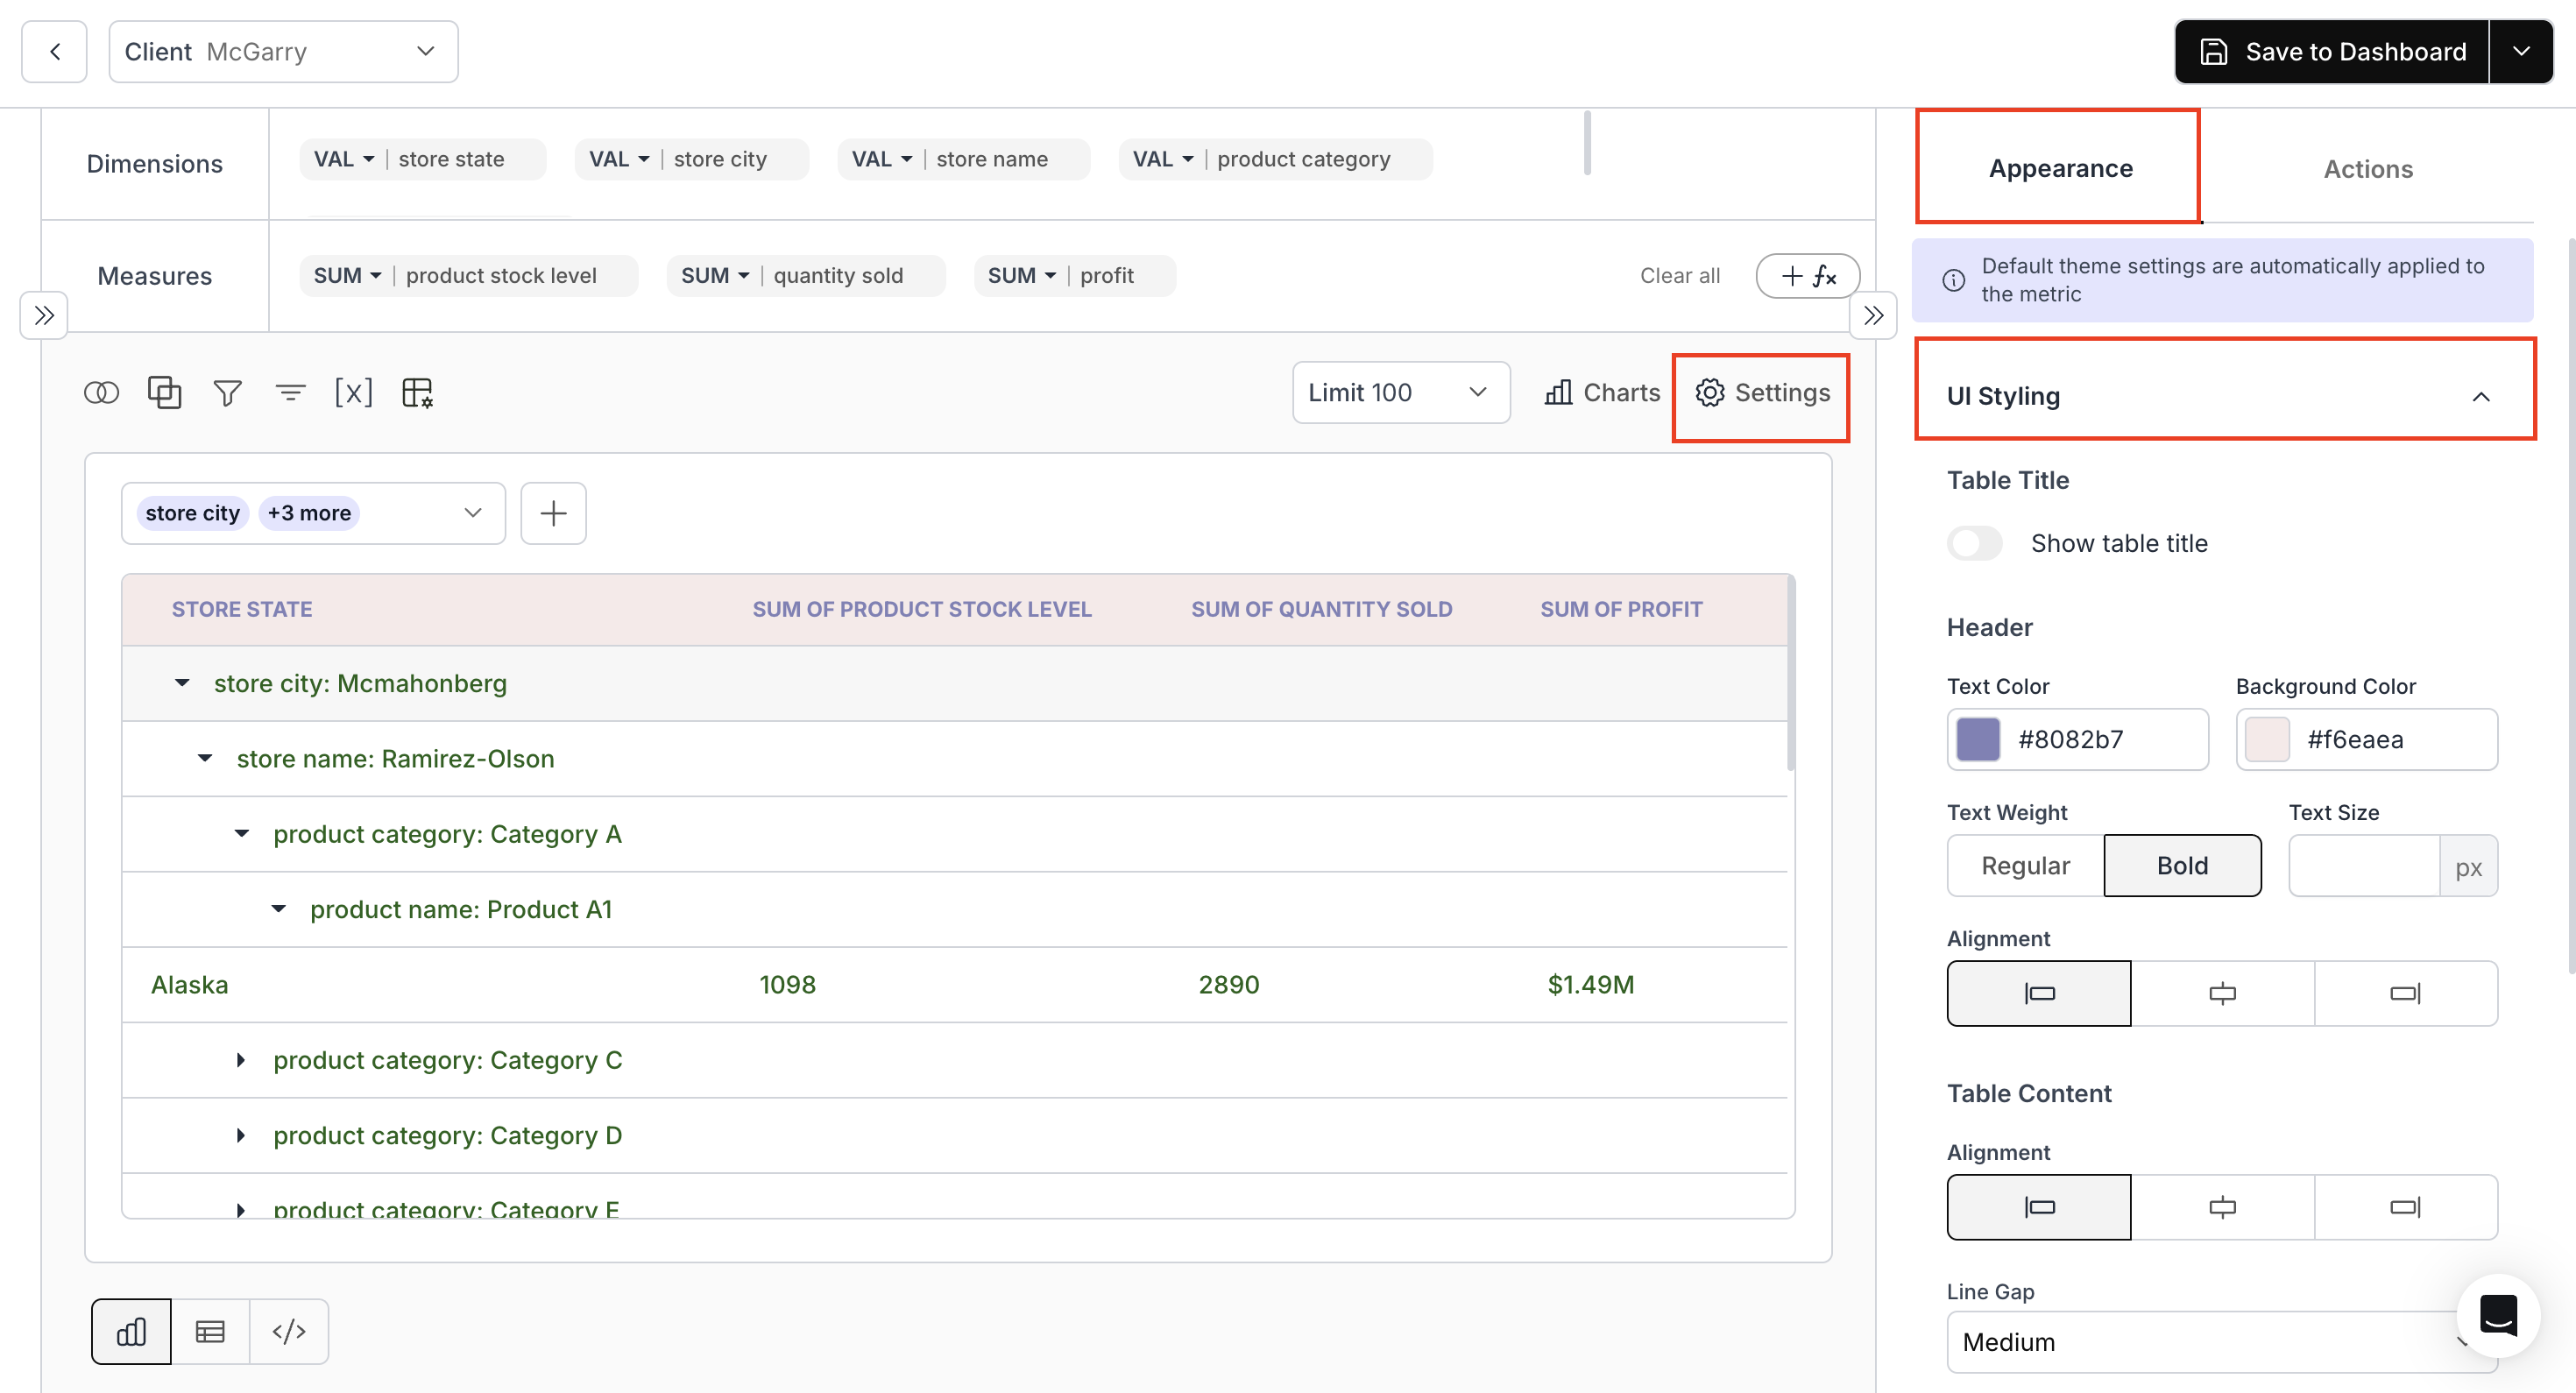
UI Styling Support for Pivot Table V3 Chart:
Added UI styling options to the Pivot Table V3 chart.
- Dynamic Label Positioning for Waterfall Charts:
Labels now dynamically adjust their position based on increases or decreases in values.
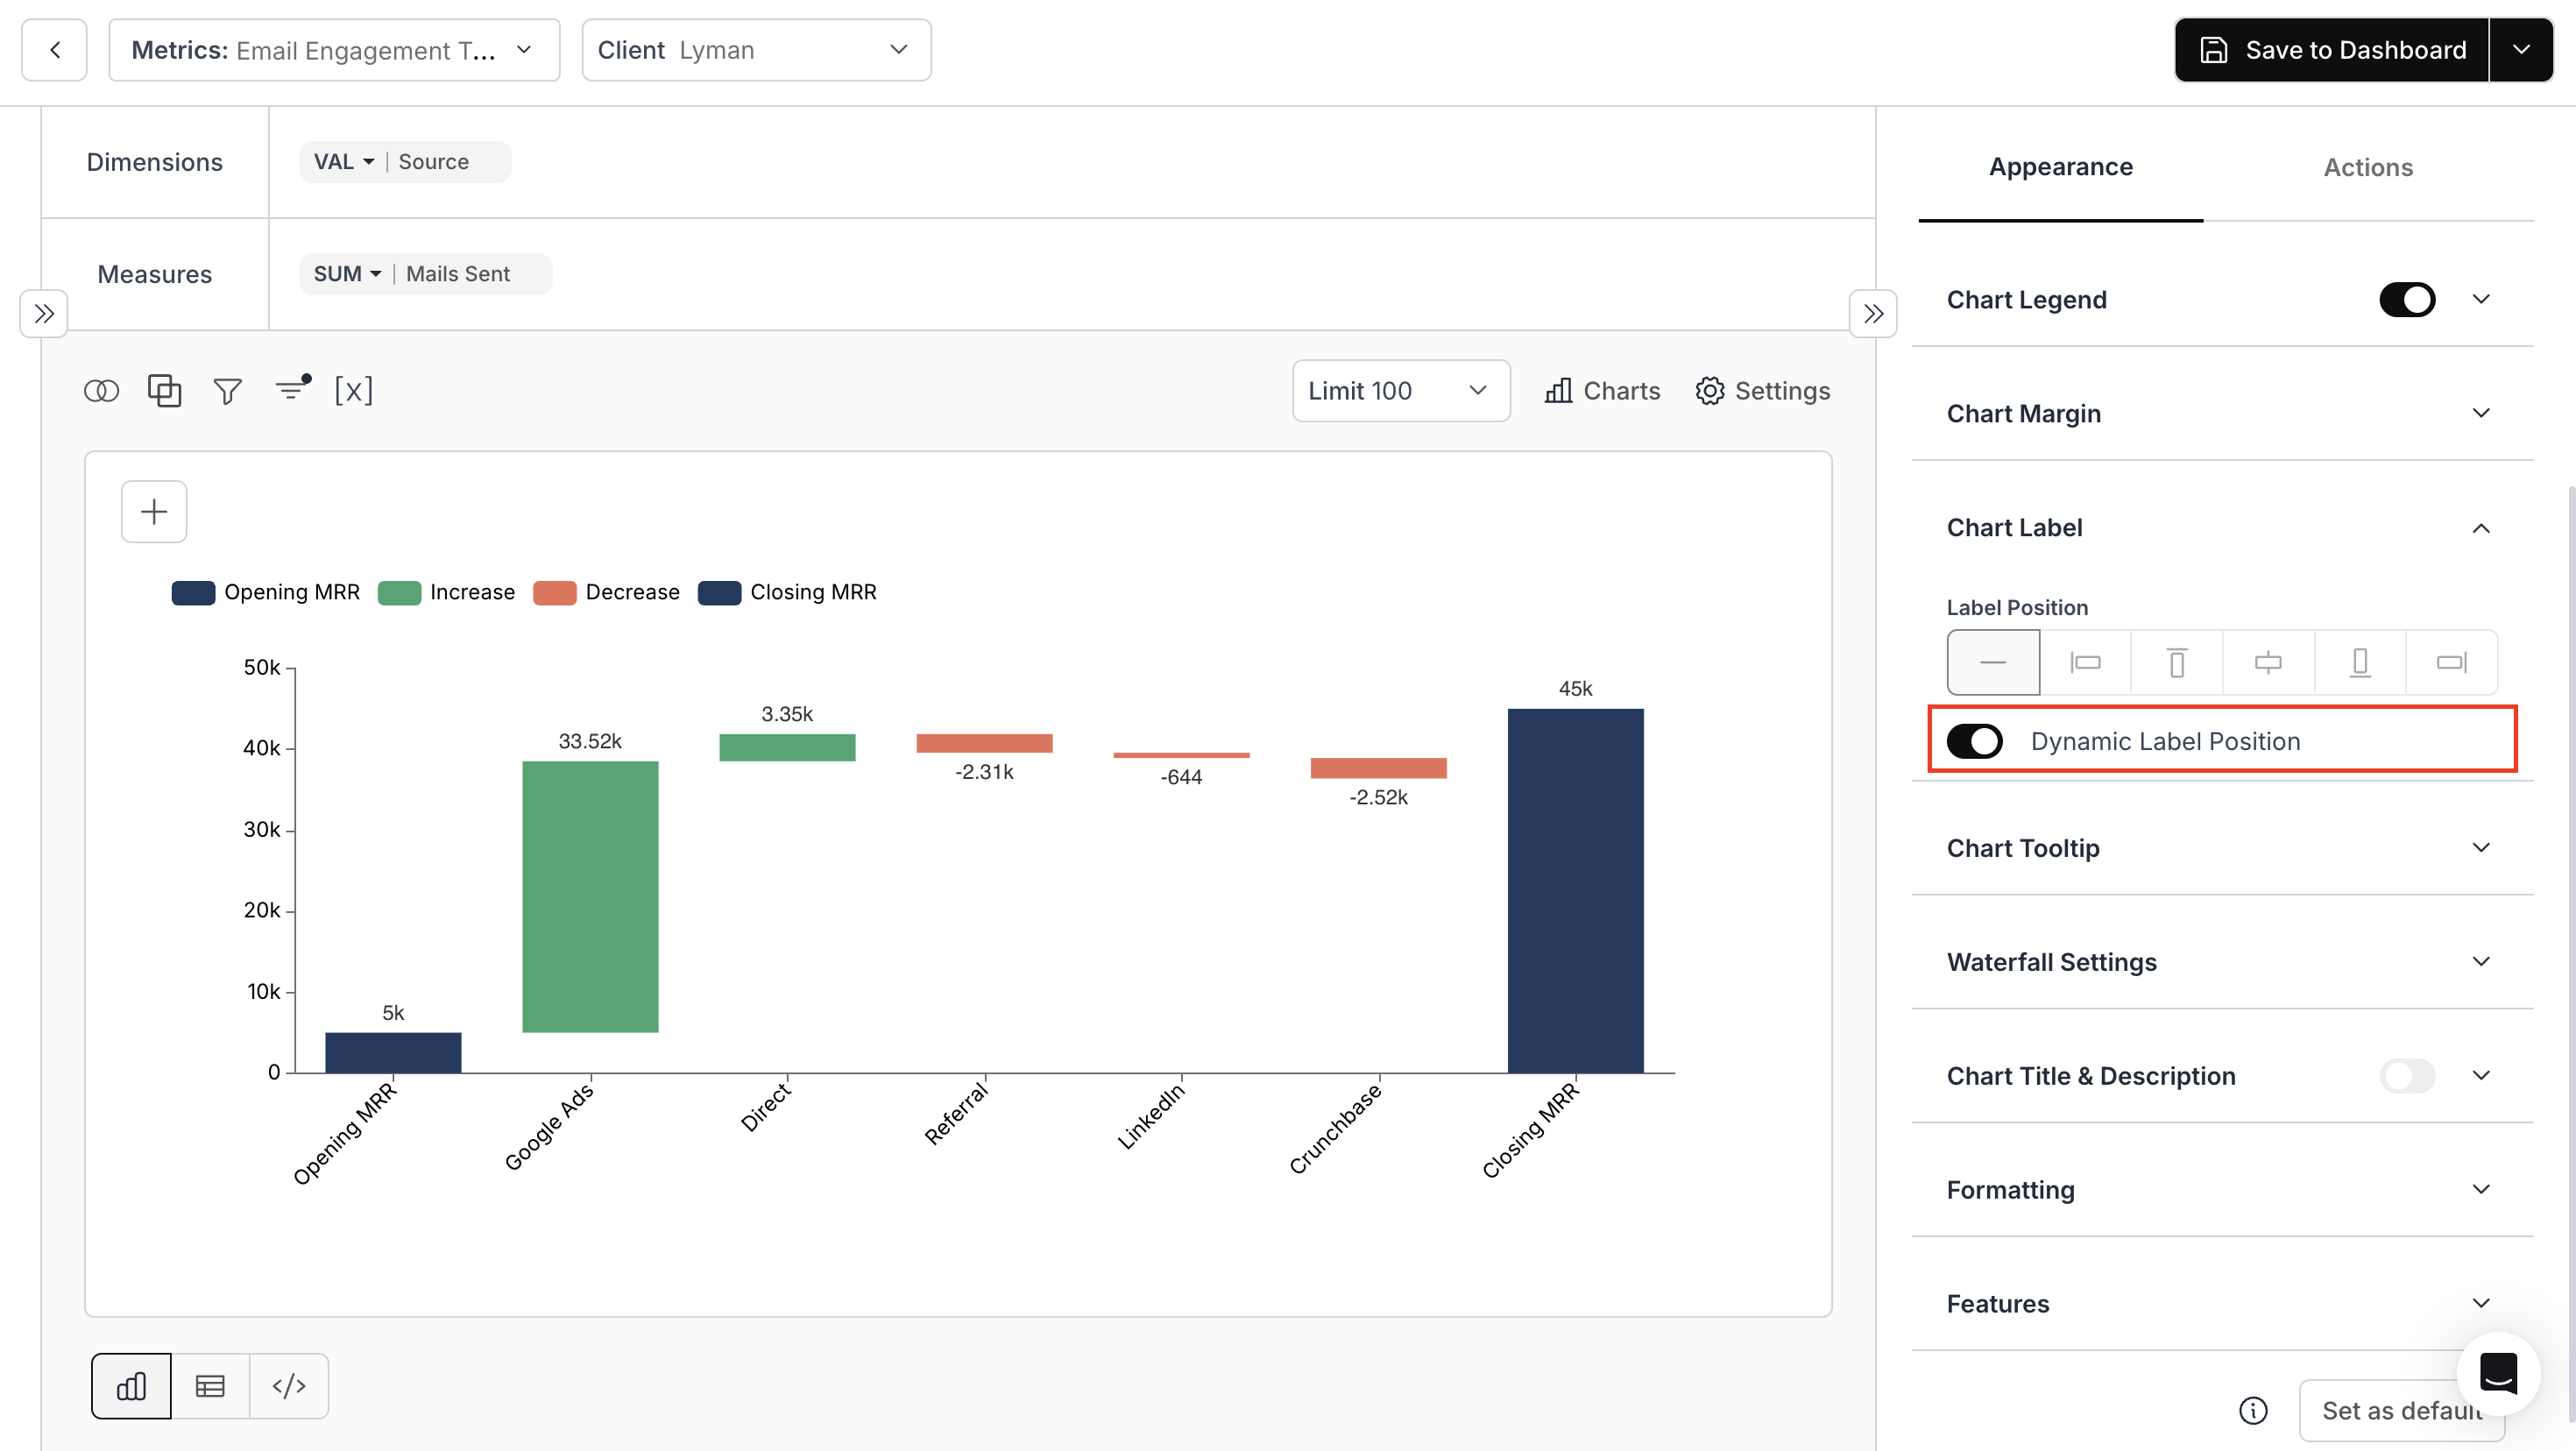
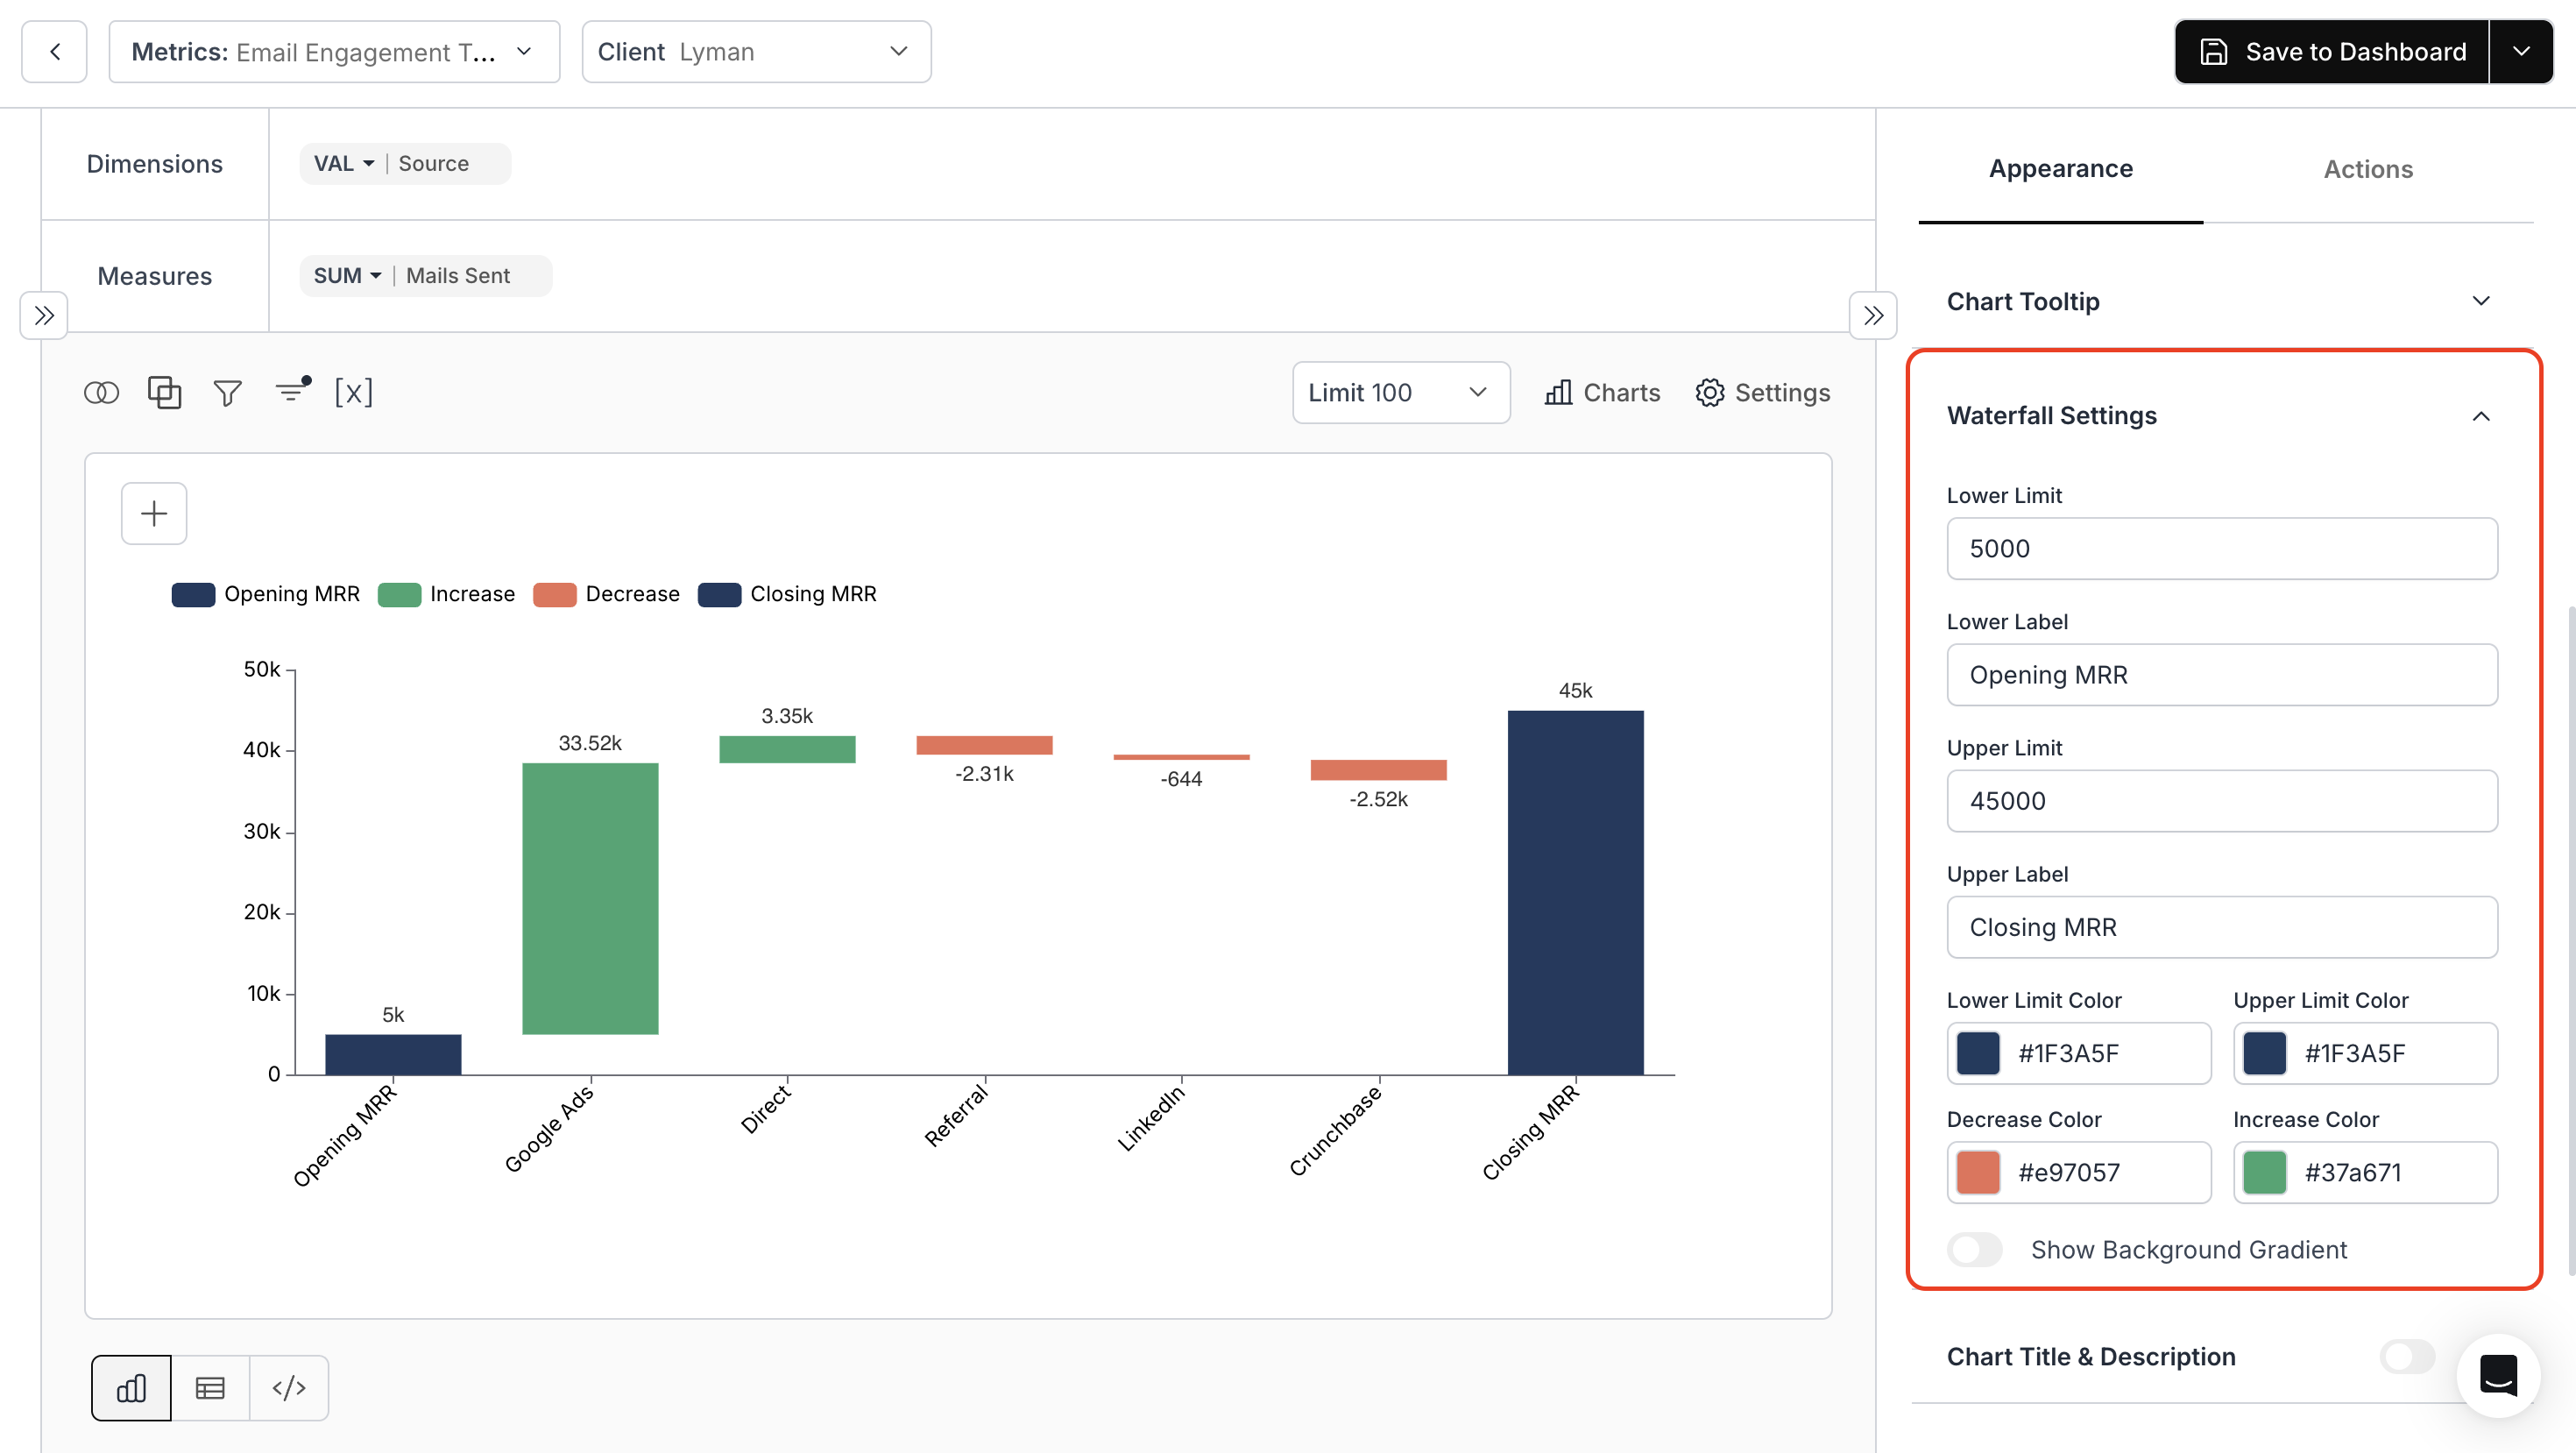
- Cumulative Start and End Labels for Waterfall Charts:
Added support for displaying cumulative start and cumulative end (running total) labels, making it easier to understand how individual increases or decreases impact the overall total. (Image 5)
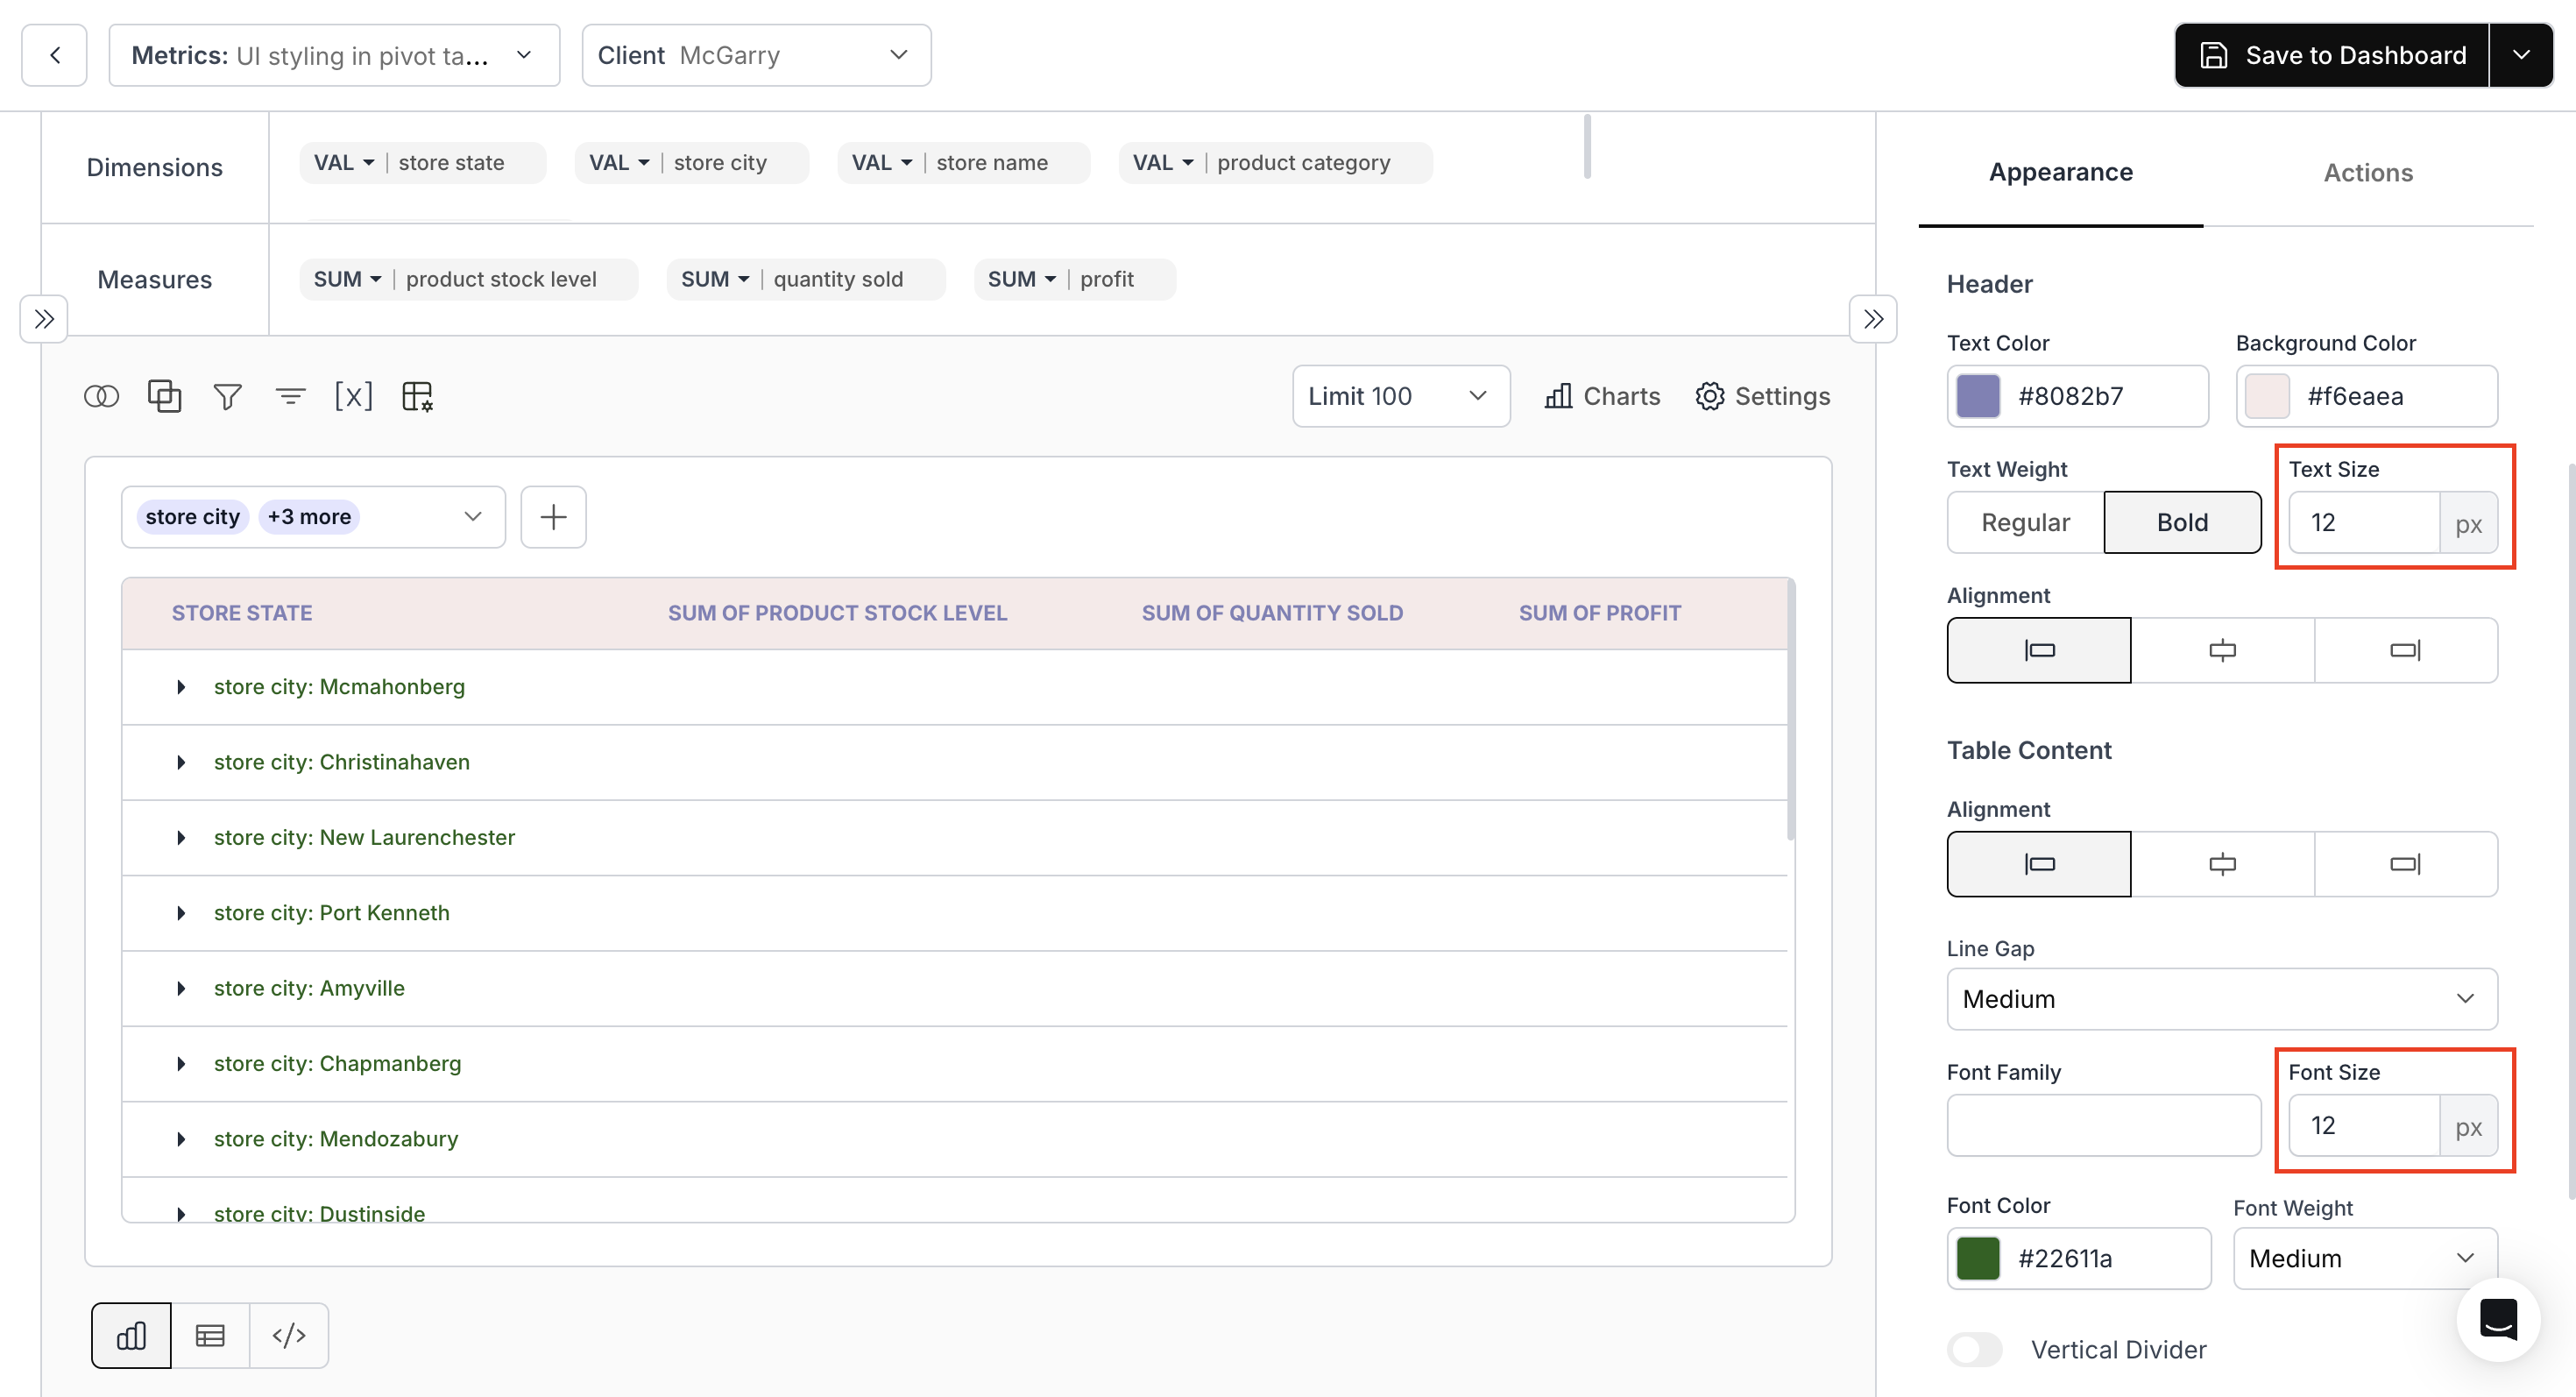
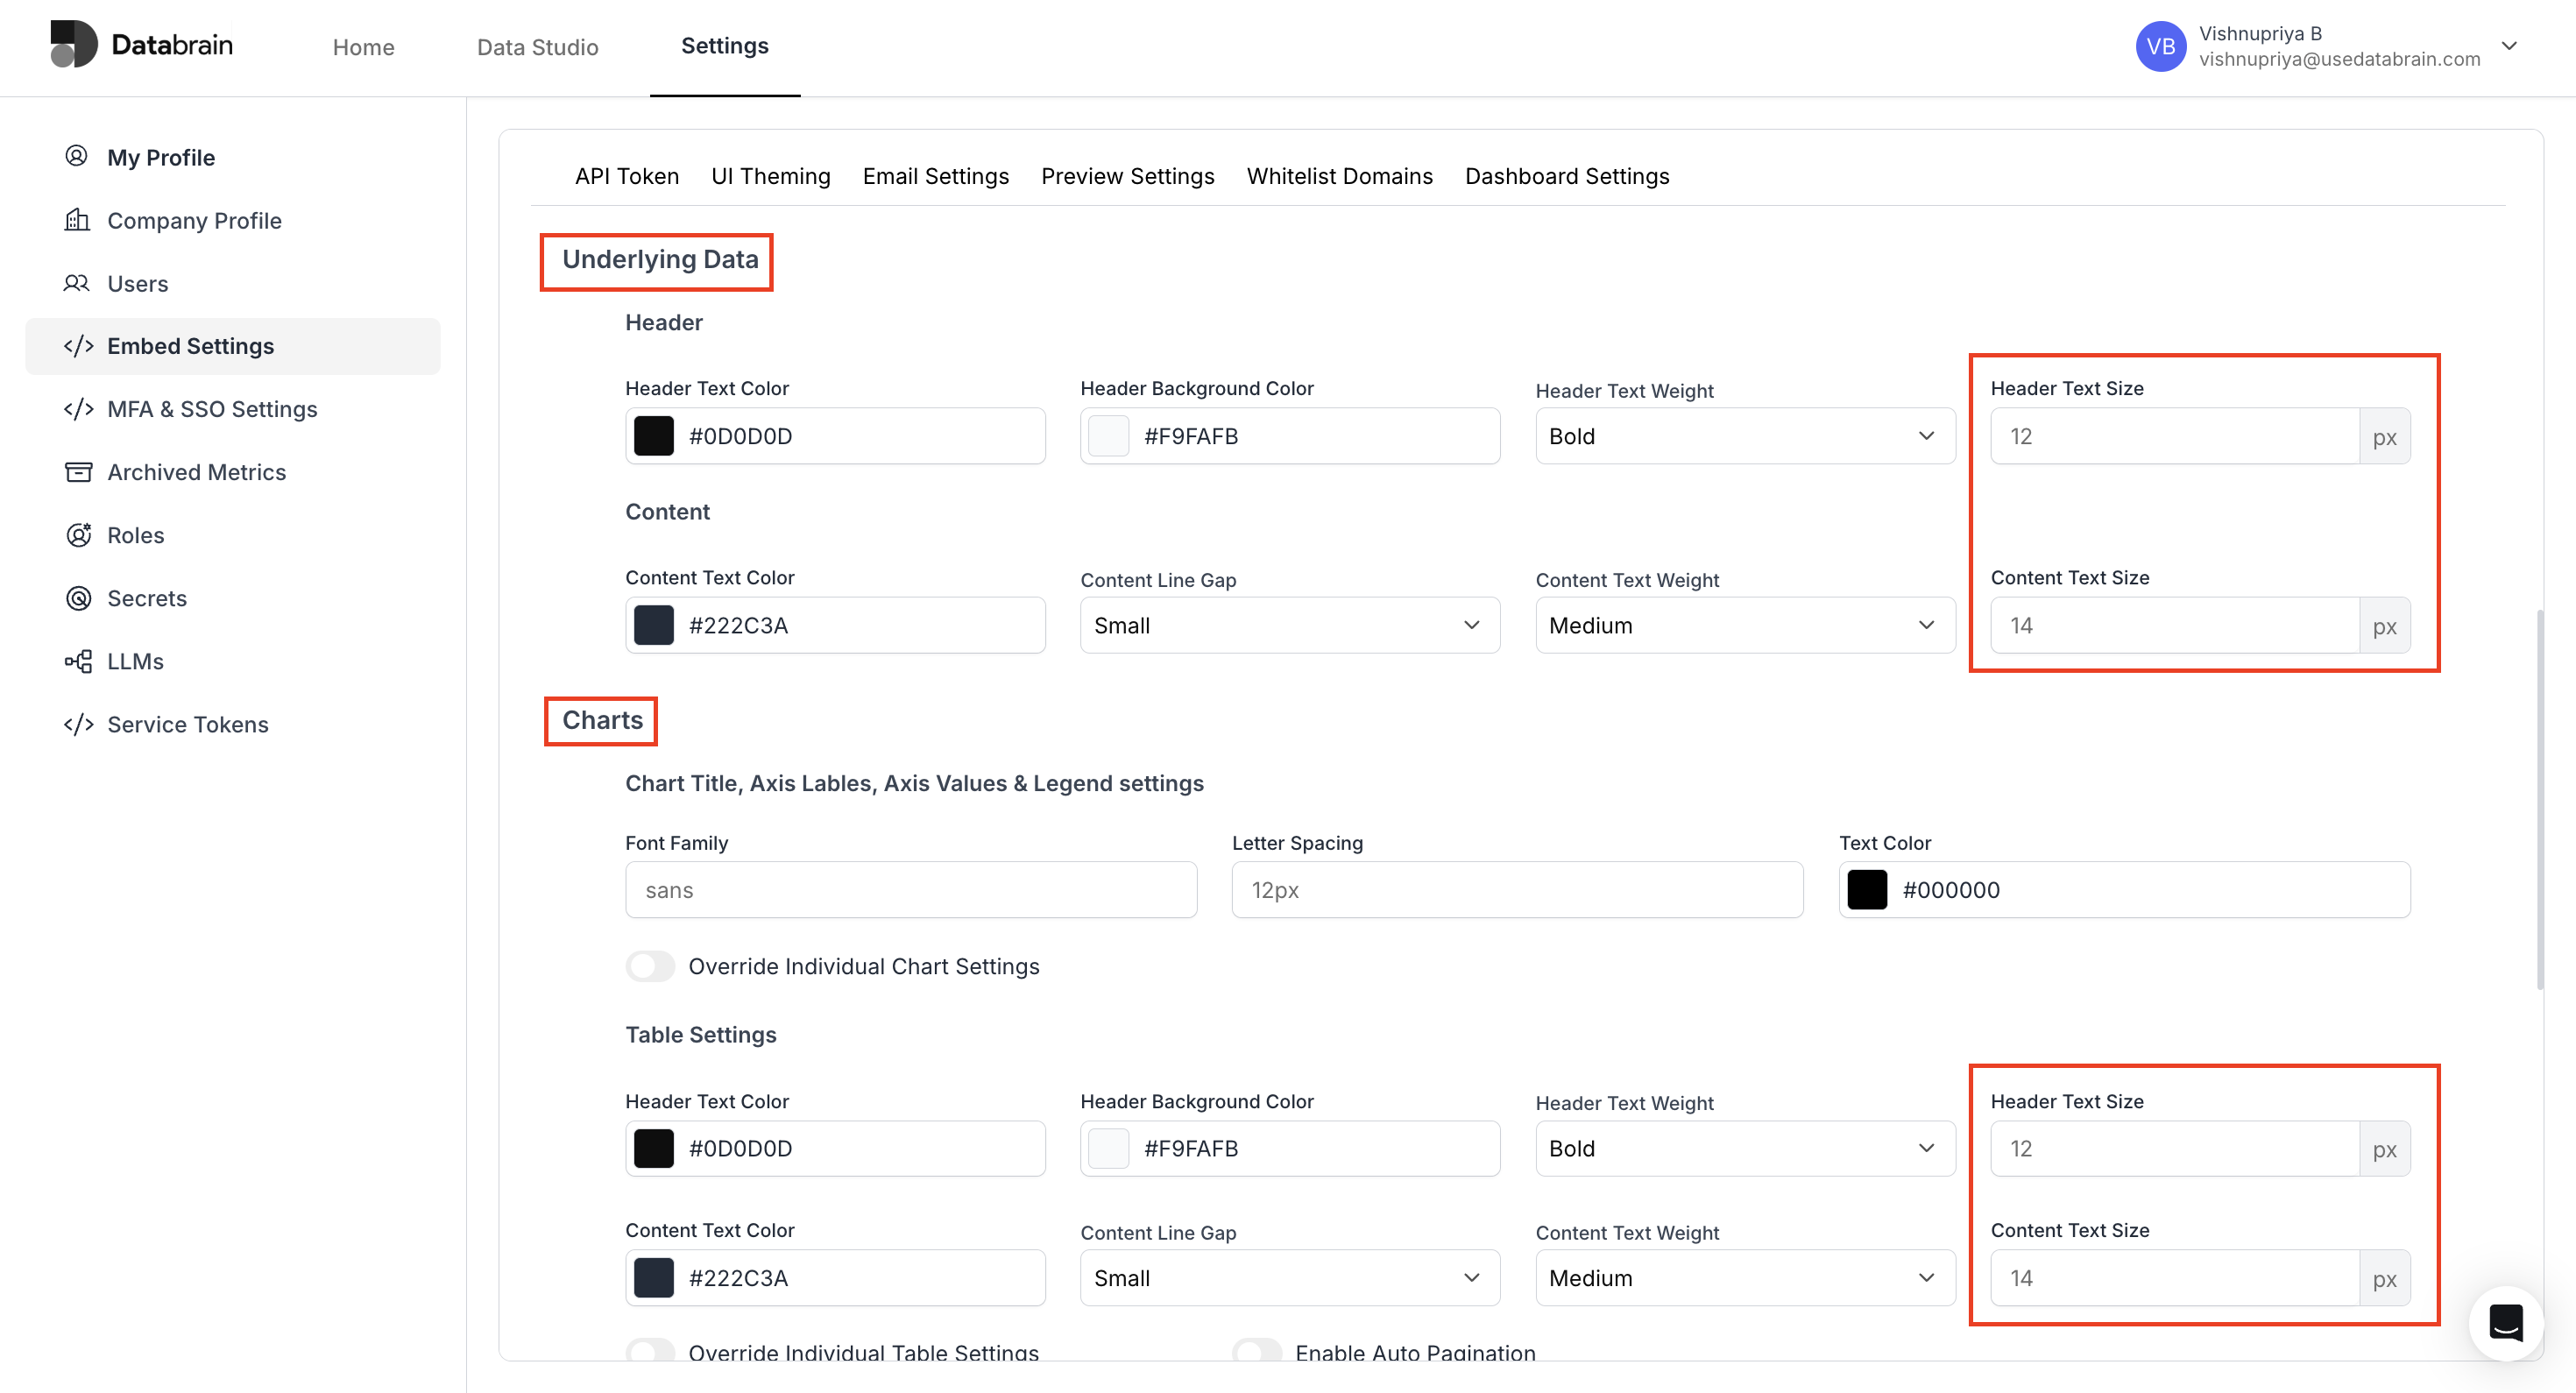
- Font Size Customization for Tables and Underlying Data:
Users can now control font sizes via Chart Settings for UI-styled table charts, and via Theme Settings for table charts and underlying data views (popup and fullscreen), ensuring improved readability and visual consistency. (Images 6, 7)
Fixes:
- Fullscreen and Download Metric Options in Embed:
Fixed an issue where Fullscreen and Download options were not visible in embedded dashboards containing merged metrics.
January 7, 2026 Updates
January 7, 2026 Updates
Features:
-
Sticky Dashboard Filters: We’ve added a Sticky option to the Dashboard Filter in the
dbn-component, allowing dashboard filters to remain fixed while scrolling. Prop:is-sticky-dashboard-filters = {true} -
Datamart & Semantic Layer Revamp:
We’re introducing a Datamart revamp to improve scalability and simplify data modeling.
- Define Relationships section: Table relationships (Joins) and Cardinality will now be defined in the Datamart.
- Configure Tenancy section: Tenancy is configured first during Datamart creation to set up the base and Client ID mapping should be defined in Datamart
- Datamart APIs will support joins and client ID mapping
Enhancements:
-
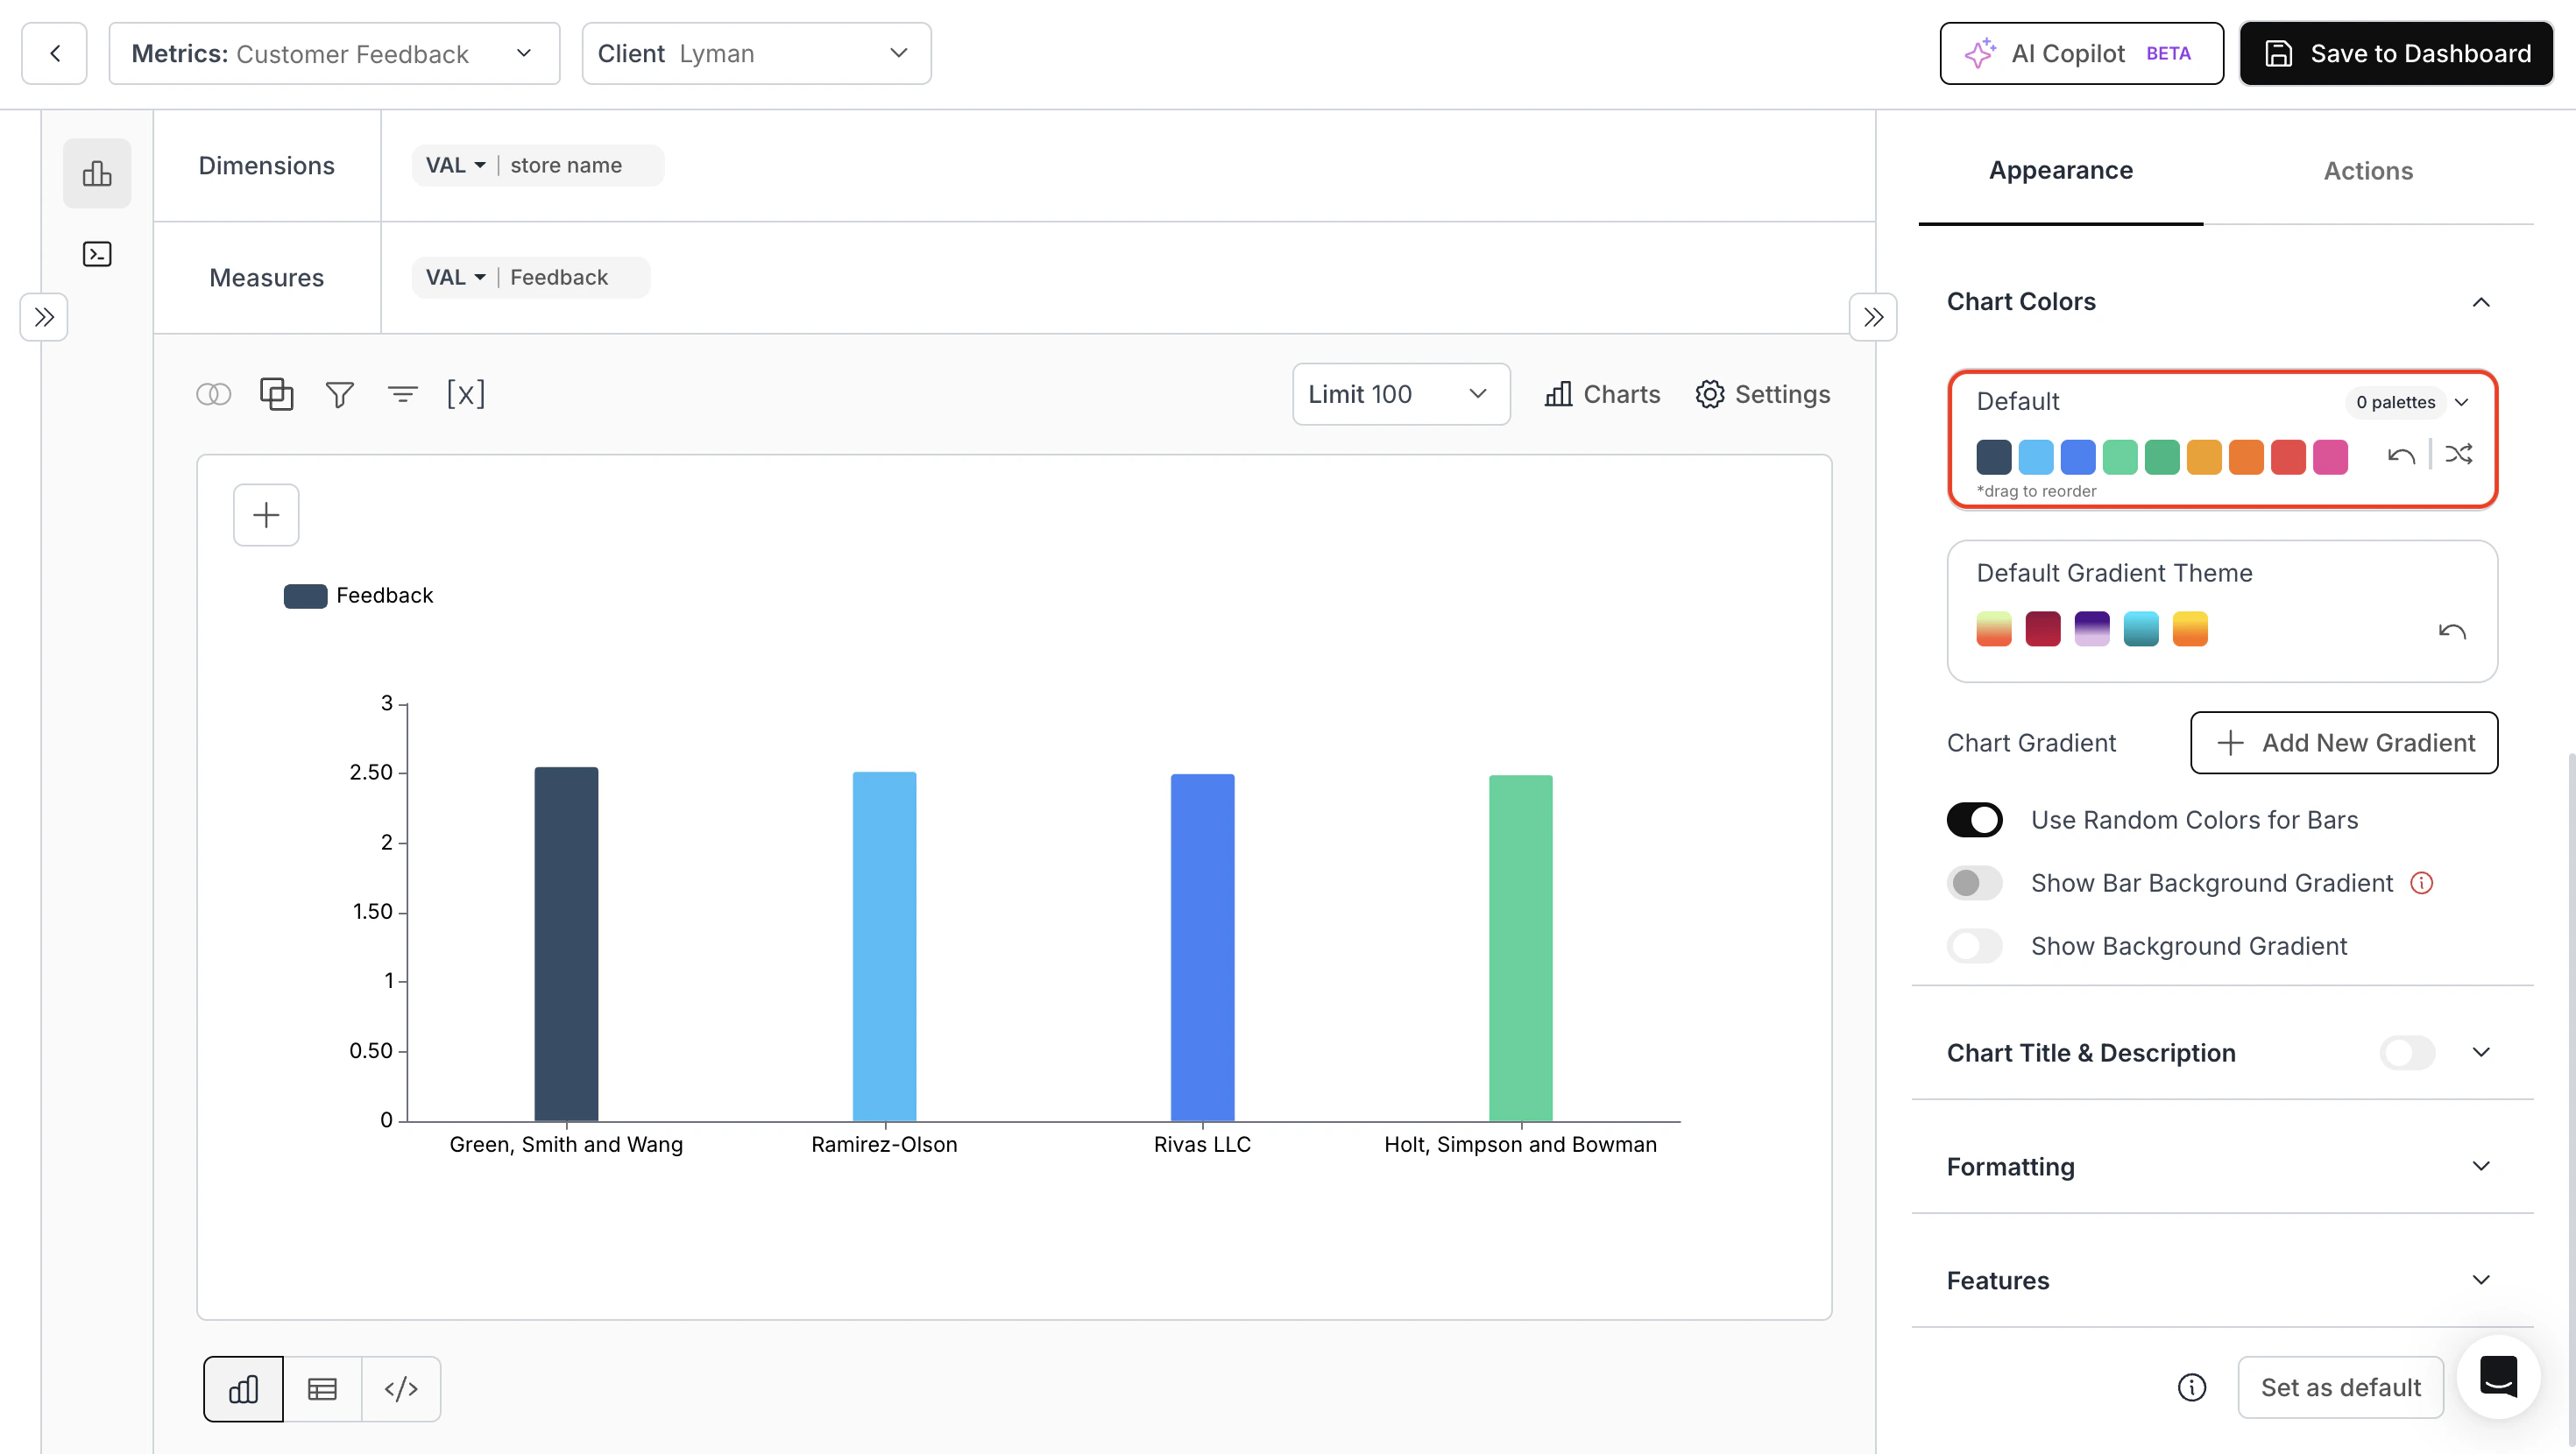
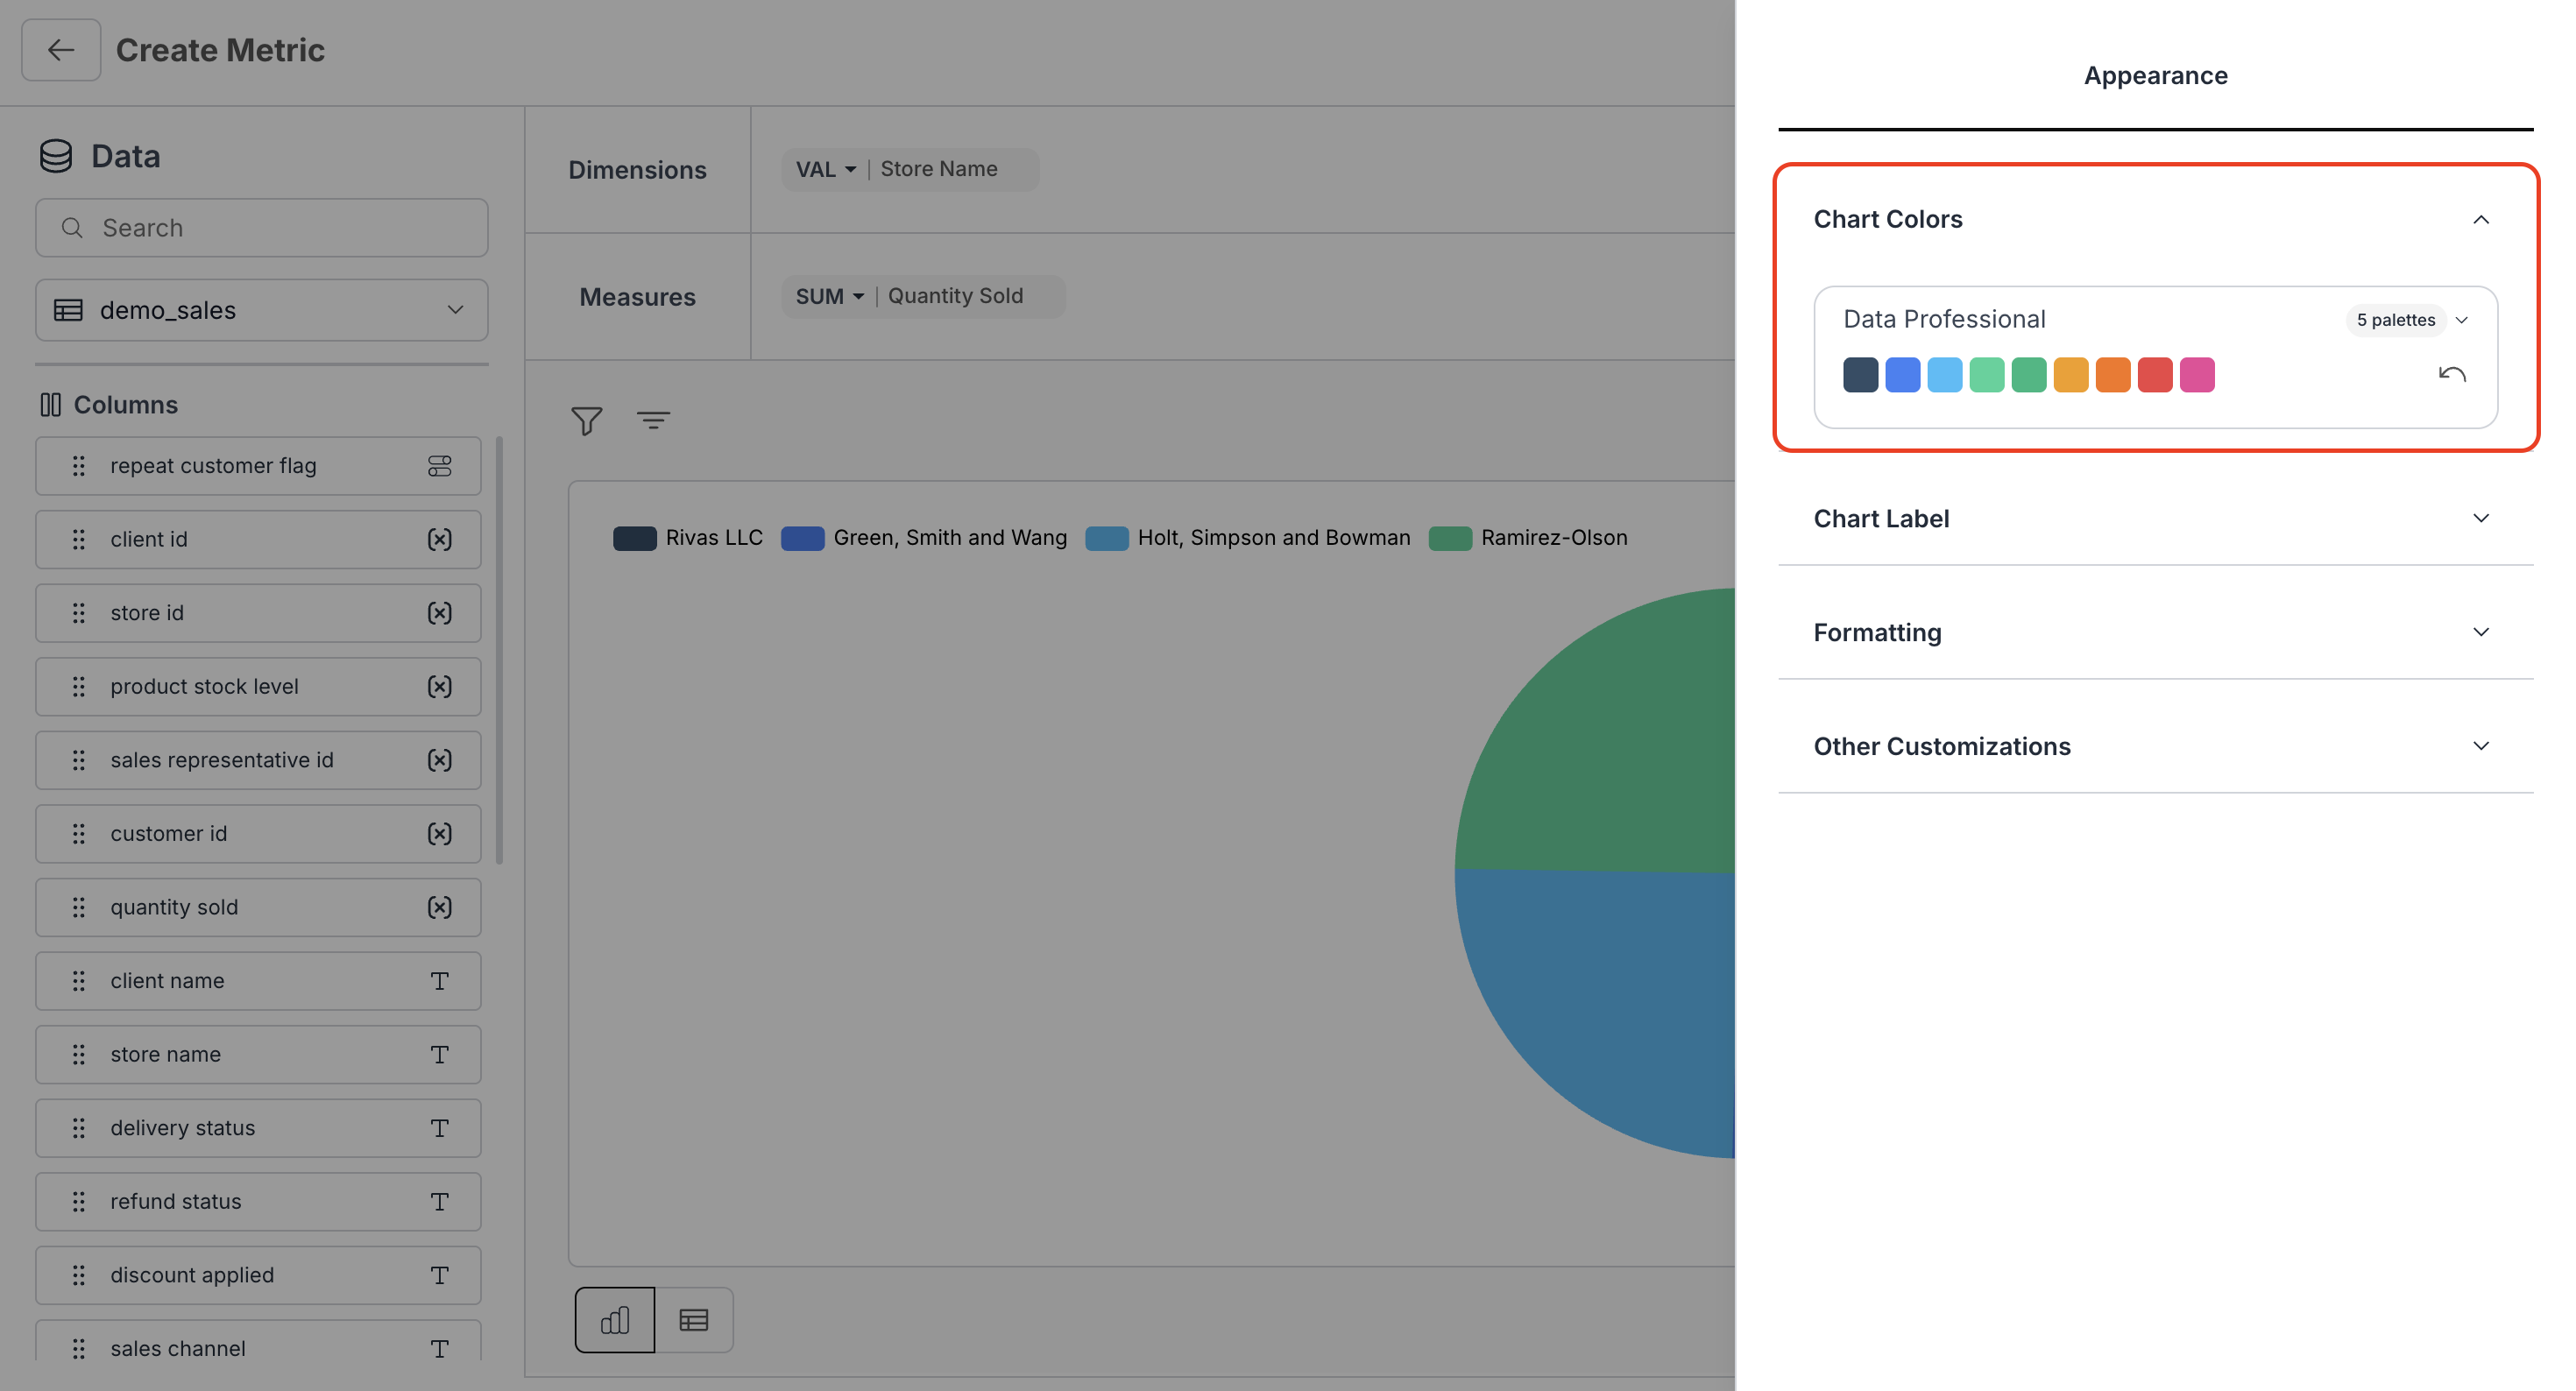
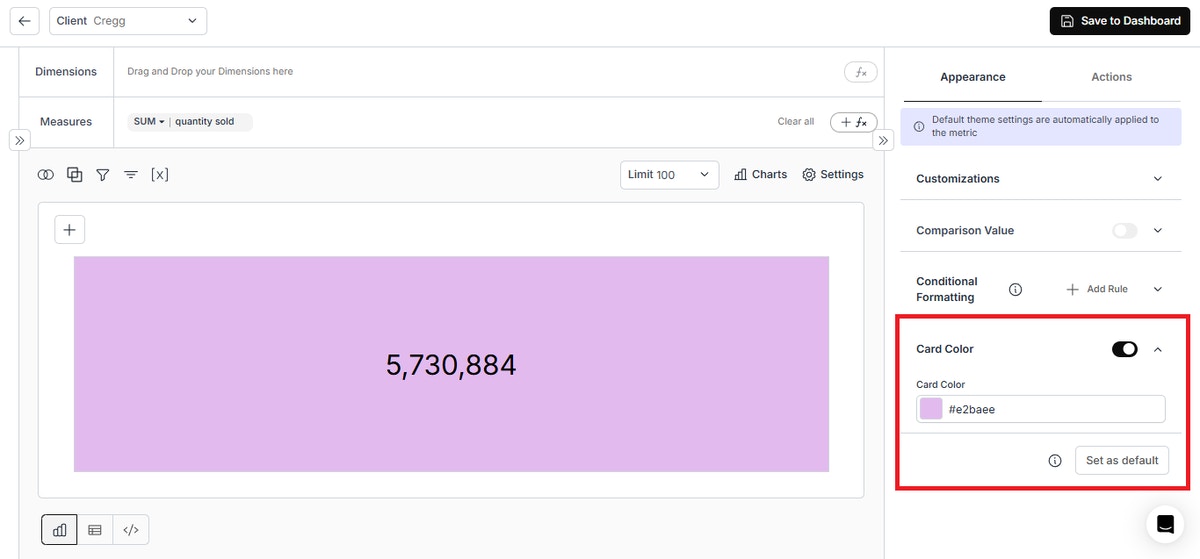
Palette Configuration for Dashboards: We’ve added palette props to the
dbn-dashboardcomponent to set default palette used in dashboard and specify the ones which can be used in chart settings. - Chart Color Configuration for App & End-User Metrics: We have added an option in chart settings for users to configure chart colors. (Image 1)
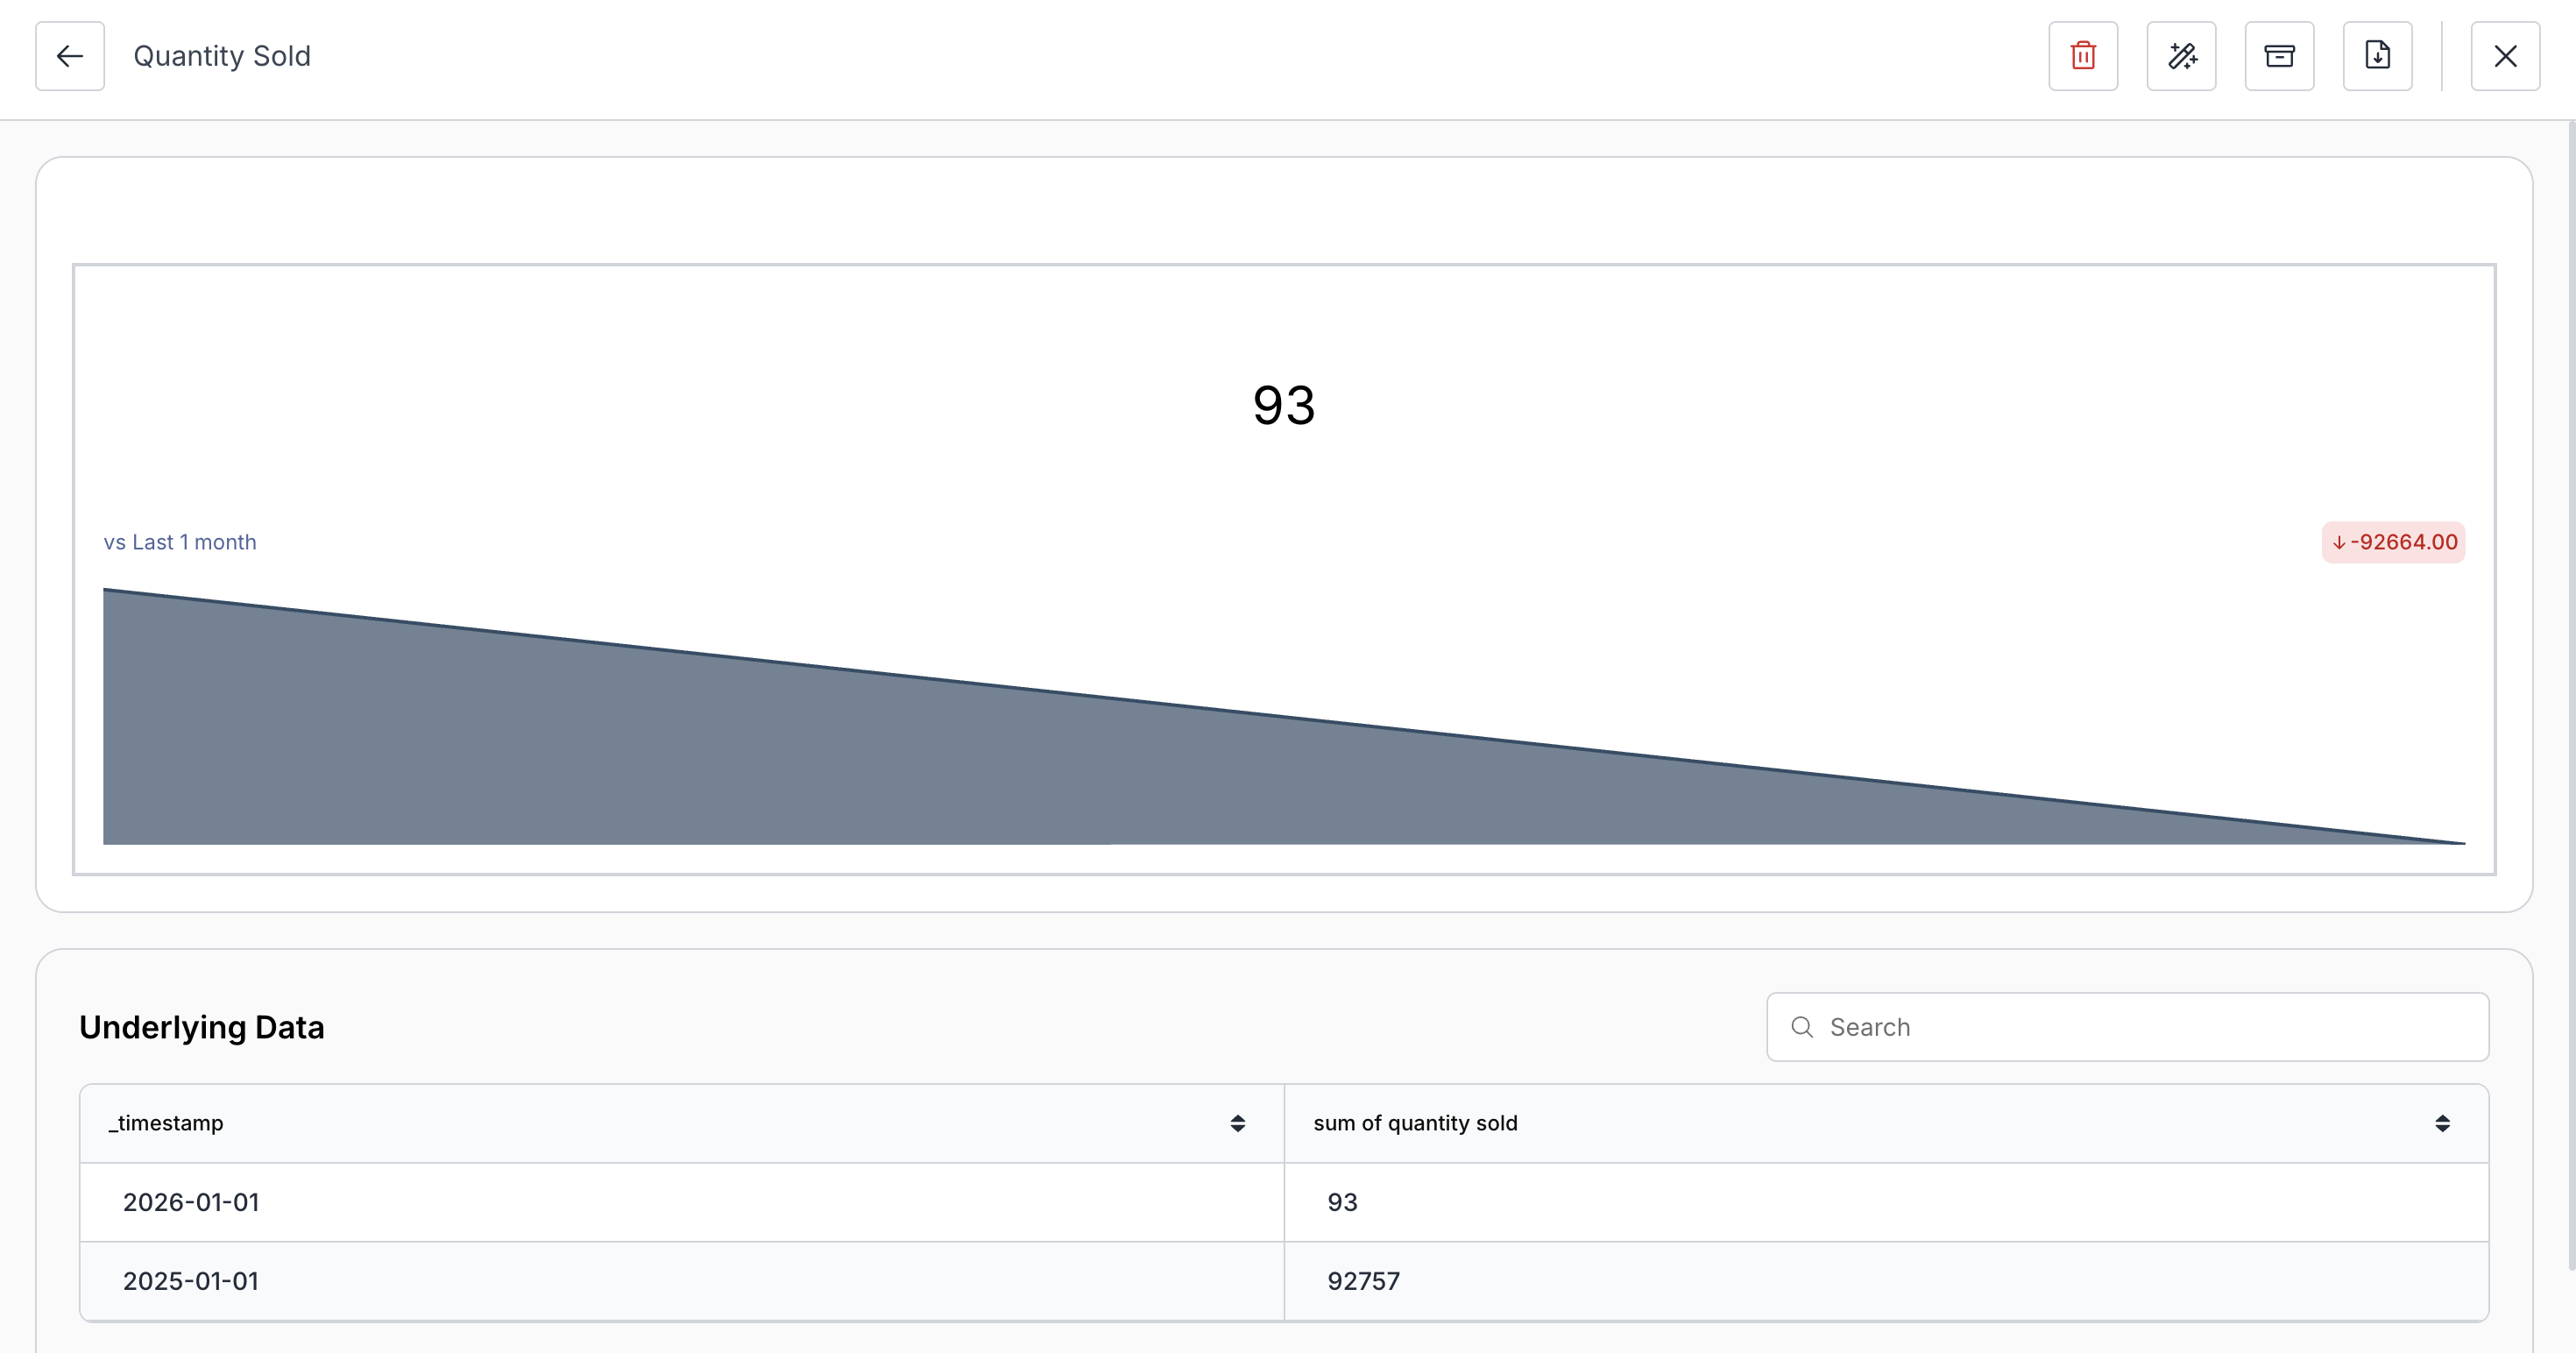
- Year-over-Year Comparison in Single Value Cards: Users can now compare the current month’s value with the same period from the previous year. (Image 2)
- Calculated Fields Support in Datamart APIs: We have added Calculated fields support in Update Datamart and Create Datamart API. (Gif 1)
- Switch Y-Axis Option for Time-Series Charts: We’ve added an option to switch the X-axis in time-series charts.
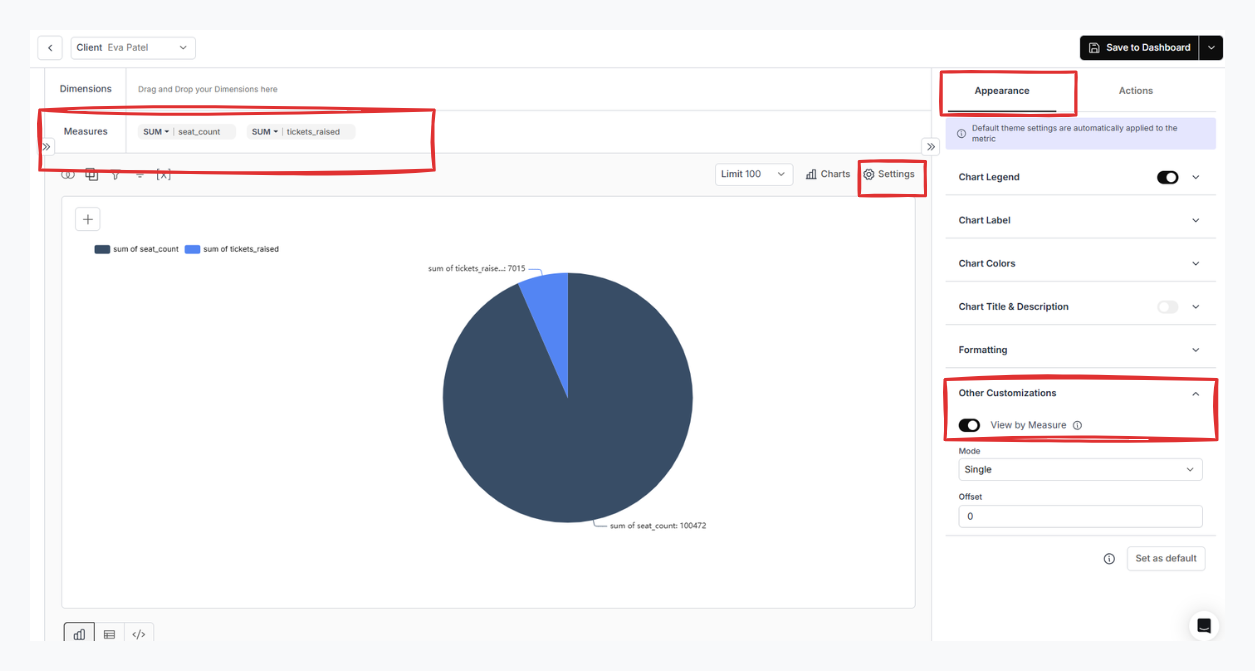
- Measure breakdown in Pie Chart for end users: Added measure-based breakdown for Pie Charts for end users, where wedges are generated based on the number of measures.
- Never Repeat Option in Frequency of Scheduled Reports: We have added ‘Never Repeat’ Option in Frequency of Scheduled Reports.
Fixes:
-
Join Query Support: Fixed an issue to support joins that use
,in queries along with filters. - Horizontal Bar Chart Label Overlap: Resolved an overlapping issue in horizontal bar charts where chart labels overlapped with Y-axis values.
December 17, 2025 Update
December 17, 2025 Update
Features:
-
Create Datamart API – Hide Table: Added support for
tableList.isHideto hide entire tables from the Datamart interface. Refer to the Create Datamart API documentation for details. -
Create Datamart API – Hide Table Column List: Added support for
tableList.columns.isHideto hide specific columns from the Datamart interface. Learn more in the Create Datamart API documentation. - CRUD APIs for Datasource: Introduced full CRUD API support for managing datasources. See the Datasource API documentation.
- Pie Chart – Measure Breakdown: Added measure-based breakdown for Pie Charts, where wedges are generated based on the number of measures.
- Waterfall Chart V2: Introduced Waterfall Chart V2 with cumulative value support.
- Multiple Scheduled Reports: Enabled end users to create and manage multiple scheduled reports.
- API for Listing User-Created Reports: Added API support to list user-created scheduled reports by embed. Refer to the List Schedule Reports API documentation.
- Embed Renaming API: Added API support to assign and update embed names. See the Rename Embed API documentation.
Enhancements:
-
Dashboard Embed Metadata API: Added new parameters to fetch additional embed metadata, including
createdAt,updatedAt,externalMetricId,dataAppId,embedId, andname. Learn more in the List Embed API documentation. - Whitelist Domain Support: Added wildcard support and improved Top-Level Domain handling for whitelisted domains.
Fixes:
- Whitelist Domain Validation: Fixed issues related to incorrect Top-Level Domain handling in whitelisted domains.
December 4, 2025 Update
December 4, 2025 Update
Features:
-
Service Tokens + API Key Rotation: You can now create and manage service tokens directly within the app, enabling secure API key rotation through the Data App for safer long-term usage.

-
Dashboard Deletion via Embed Config: Added support for dashboard deletion using the URL parameter:
isDeleteDashboard: true
Enhancements:
- CSV and XLSX Support in Scheduled Reports: Users can now schedule reports in CSV and Excel (.xlsx) formats, expanding export flexibility in automated schedules.

Fixes:
- Resolved Metric Loading Issue: Fixed an issue where loading a metric caused the entire dashboard to load instead of just the selected metric.
- Dashboard Filters on Empty Dashboards: Filters now work correctly even when a dashboard contains no visualizations.
- Schedule Report in Embed: Scheduled reports within embedded dashboards now work contextually based on the selected dashboard and client.
November 25, 2025 Update
November 25, 2025 Update
Features:
- Publish Metric API: Added support to publish all metrics via API using the property
isPublished: true. - Update Datamart API: Added support to update datamarts via API.
- Workspace APIs: Added APIs for Create Workspace, Update Workspace, and List Workspaces.
Enhancements:
- Embed Axis Color Properties: Chart axis colors can now be customized using:
Fixes:
- Filter Dropdown in Metric Creation: Resolved issues affecting simple filter dropdown values.
November 12, 2025 Update
November 12, 2025 Update
Features:
- Auto Joins in End-User Metric: You can now set up auto joins in the Semantic layer. End users can drag and drop to create metrics from different tables seamlessly.
Enhancements:
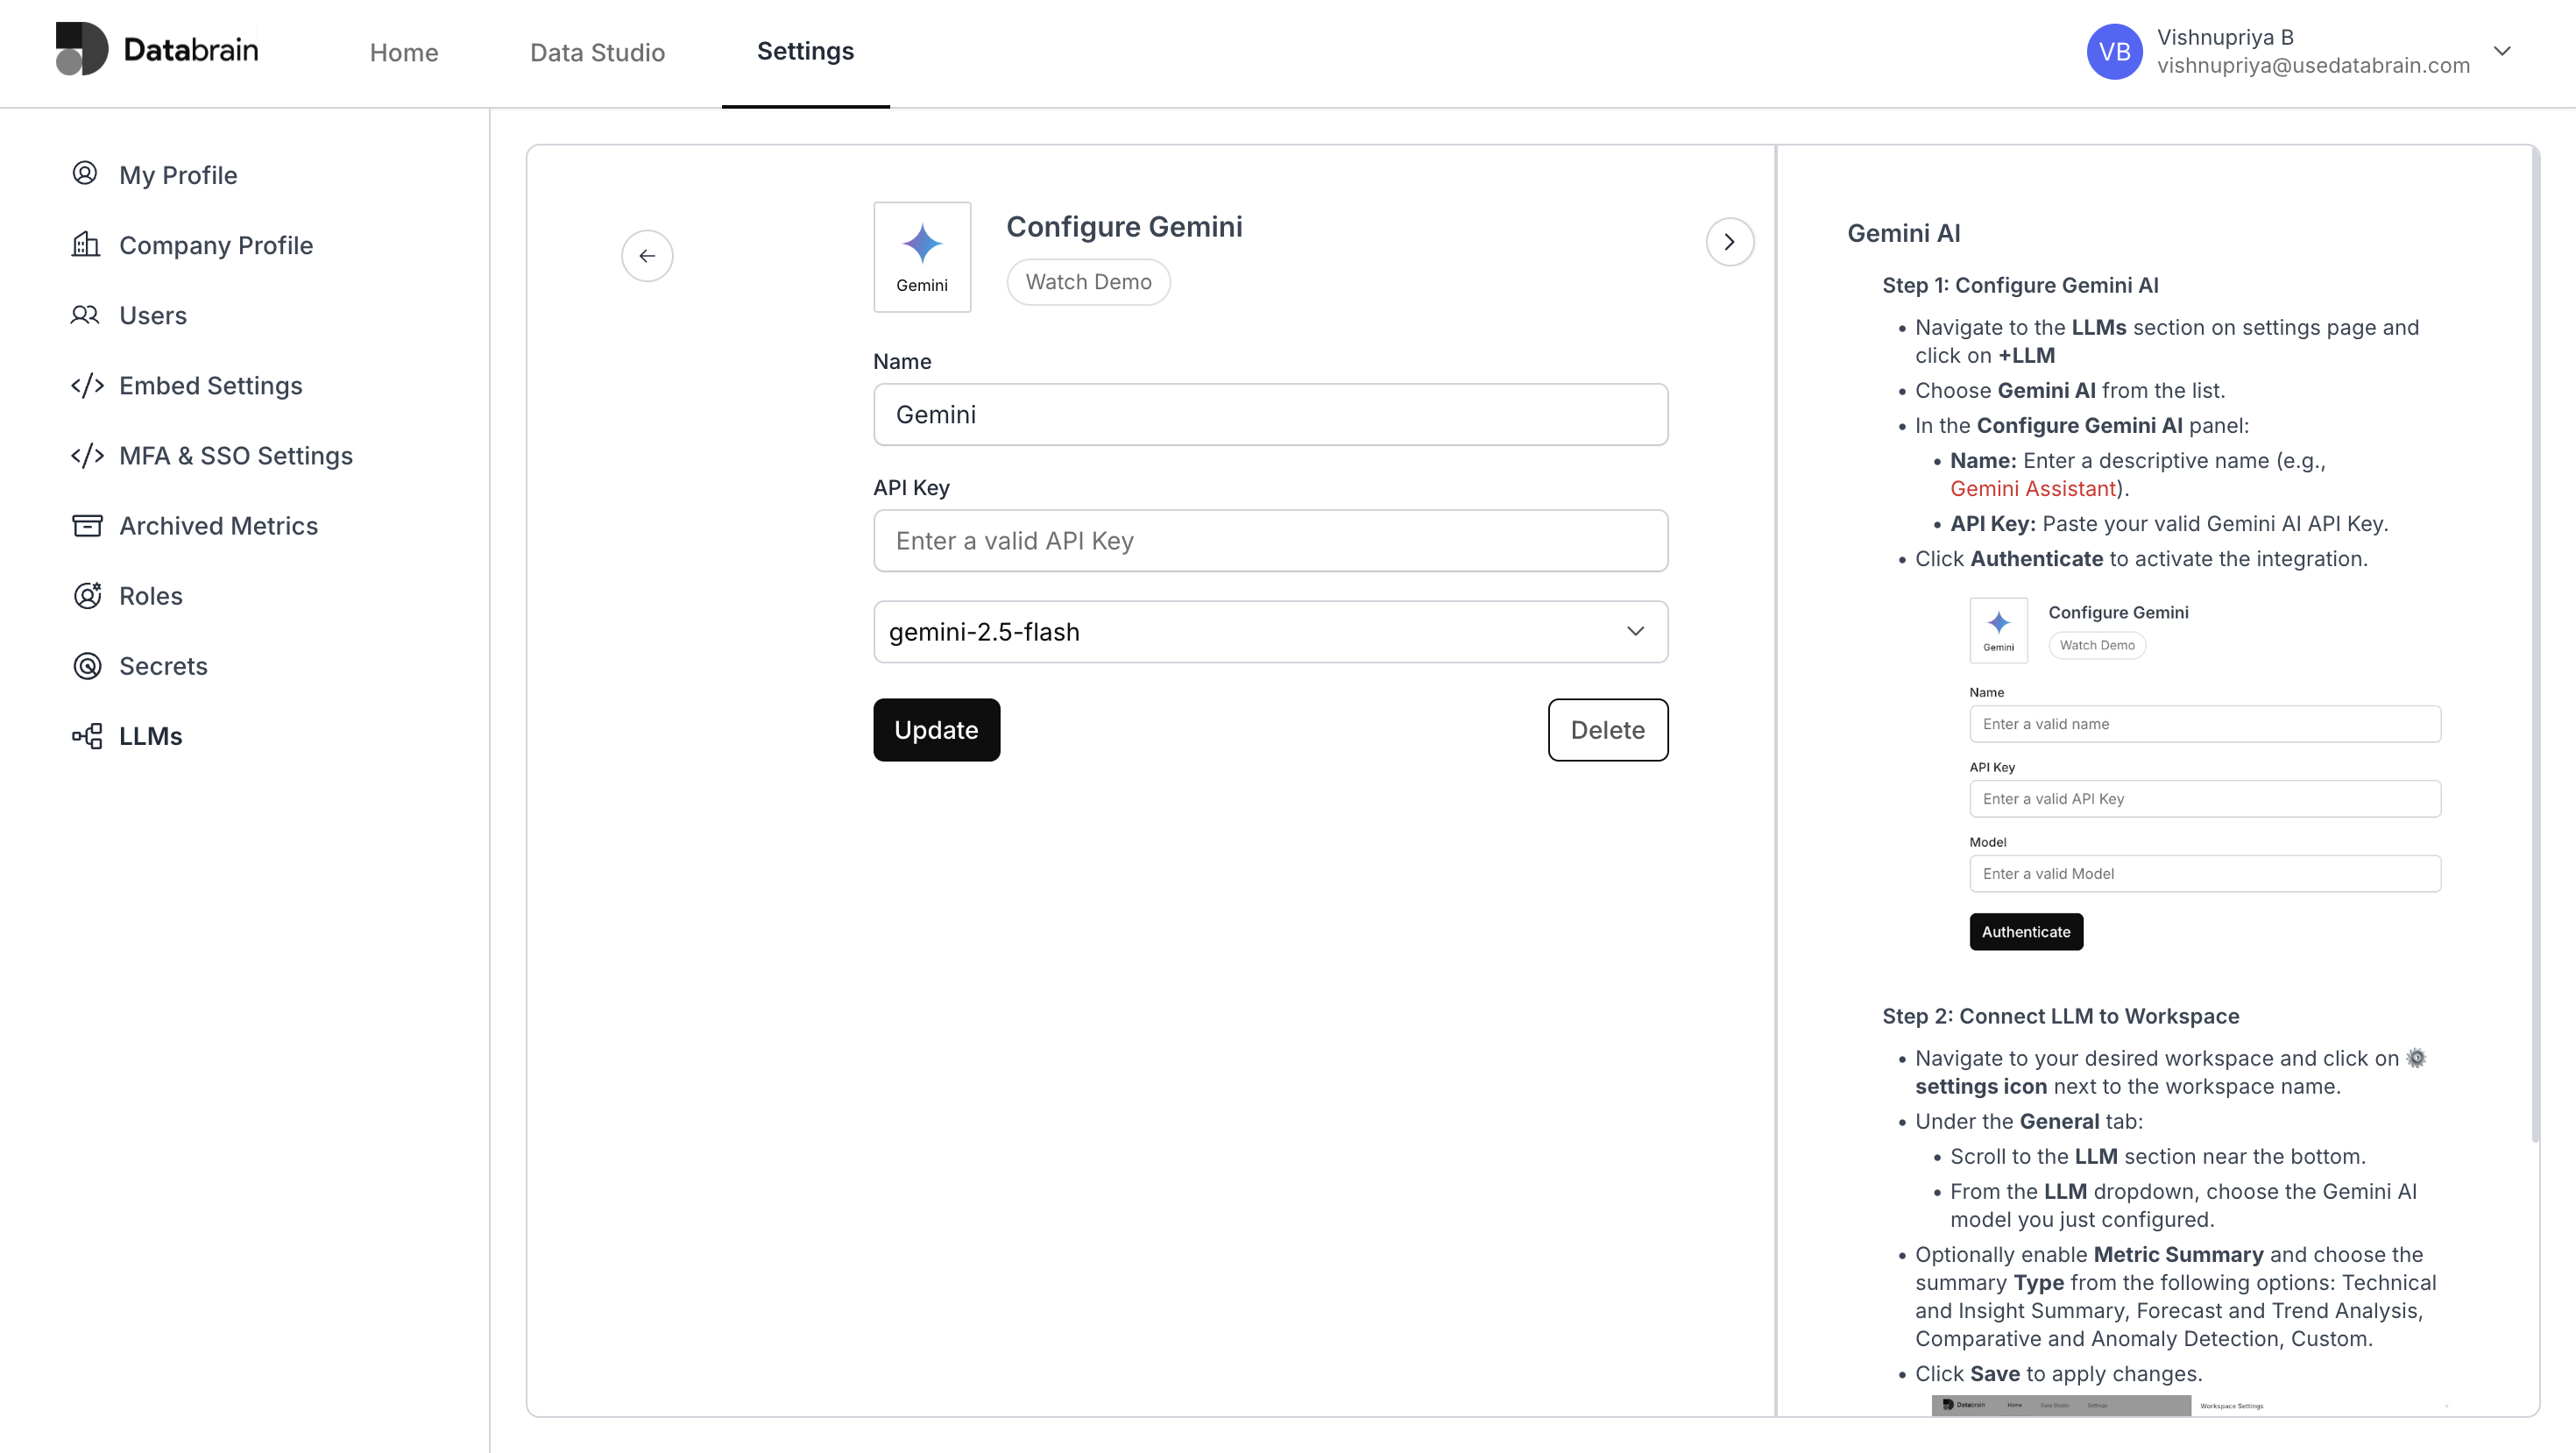
- LLM Model Selection in Settings: You can now choose and configure your preferred LLM model (e.g.,
gemini-2.5-flash,gemini-2.5-pro-preview, etc.) directly in the LLM settings.
- Custom Field Support in End-User Metric Creation: Added support for custom fields during end-user metric creation.
Fixes:
- Bar Length: Fixed an issue where bar lengths were not consistent.
- Optimized Embedded Dashboards for Mobile/Tablet: Improved layout consistency for smaller screens, including better handling of Dashboard Filters, Filter Popups, and View Boards.
- Encryption in End-User Metric Creation: Enabled encryption during end-user metric creation.
- Filter Value in MSSQL: Resolved the “Metric already exists” error during end-user metric creation.
November 3, 2025 Update
November 3, 2025 Update
Features:
- User Defined Fields (UDF): Easily customize dashboards with your own data fields — no schema changes needed. DataBrain now auto-detects and supports both common and client-specific fields as dynamic filters and chart axes for flexible, personalized insights.
Fixes:
- Iceberg + Trino SQL: Resolved a server error caused by empty or undefined filter values. Added validation to ensure all required fields are filled before adding a new filter.
- Metric Cards: Removed extra spacing in Metric Cards and Full-Screen View.
- Invite User Settings: Added validation for user invites.
- Alias Modification: Fixed issues related to alias name updates.
October 24, 2025 Update
October 24, 2025 Update
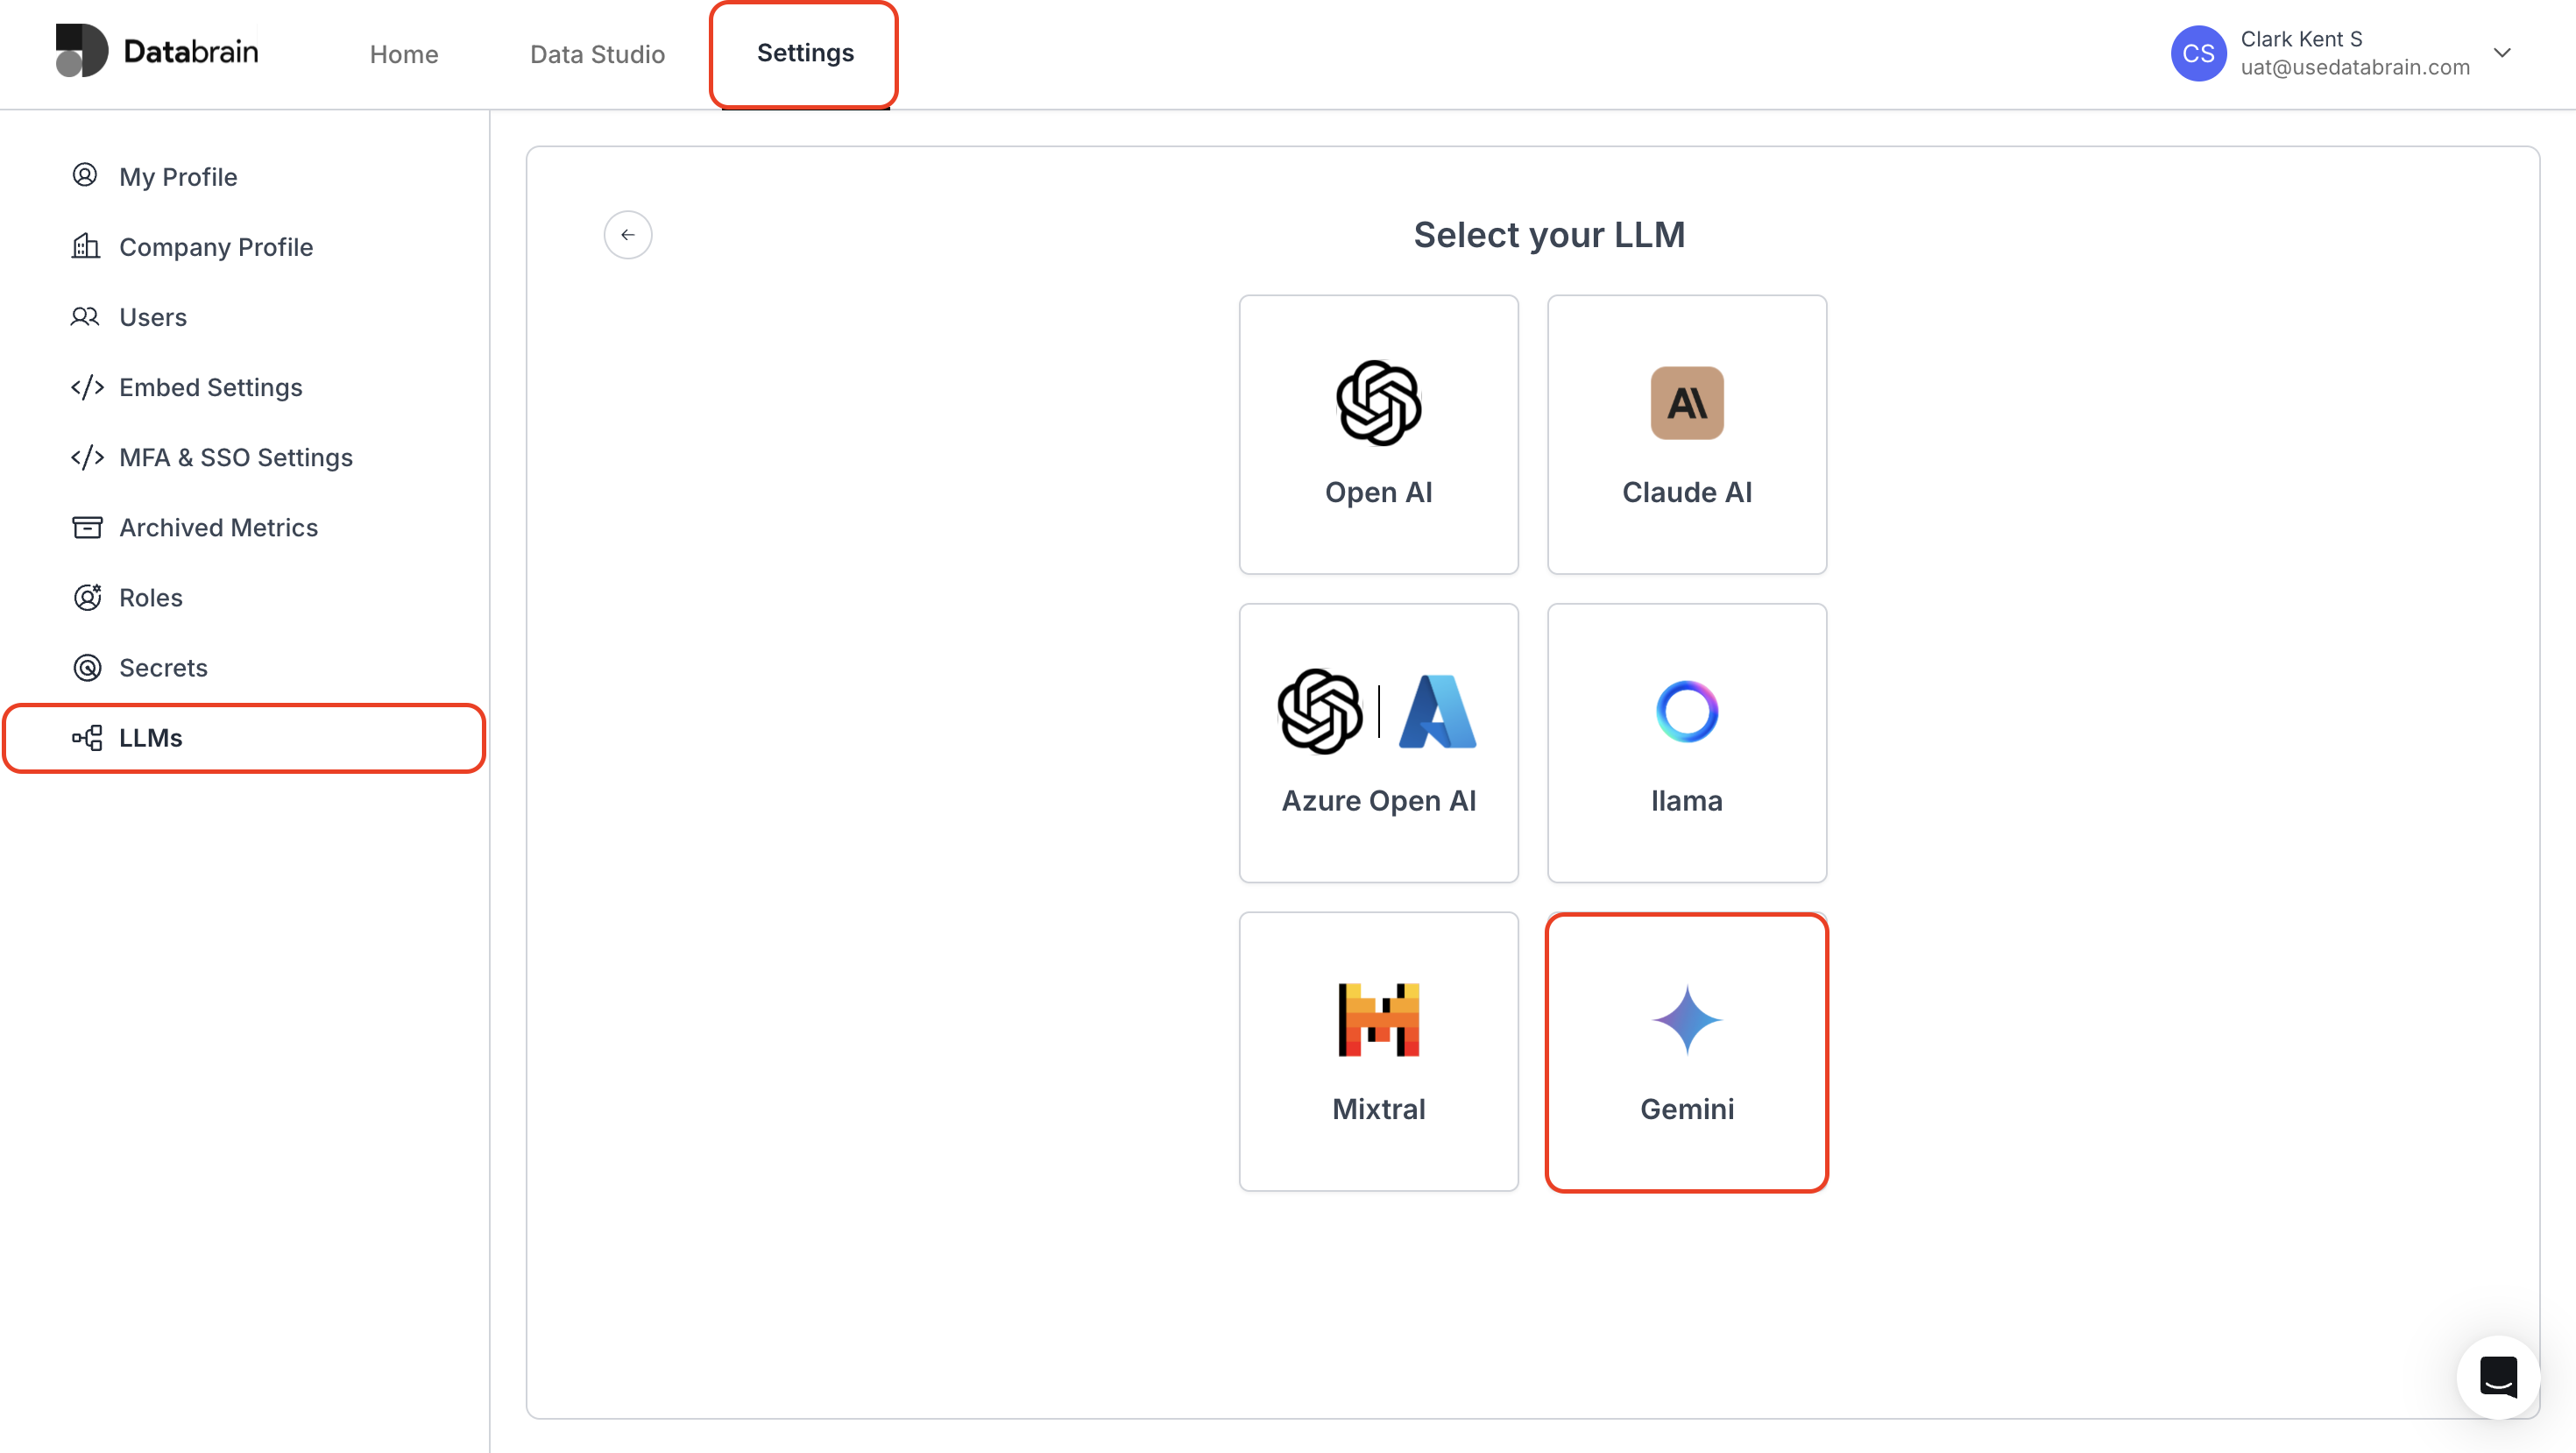
Features:
- Gemini LLM: Added a new connector for LLMs — Gemini.
Enhancements:
- Filter Elements for Fetch Metrics API: Added a new parameter
isMetric=trueto the Fetch Metrics API. - Prop for Download Dashboard as PDF: Introduced a new embed prop
enable-download-all-pdf={true}to enable dashboard PDF downloads. - Naming Conventions & Methods in End User APIs: Updated HTTP methods to
POST,GET,PUT, andDELETEfor improved consistency.
Fixes:
- Trino: Resolved a server error when creating a metric caused by “Zero-length delimited identifier not allowed.”
- Logs in Playground: Implemented a logging mechanism in the playground environment for better traceability.
- Chat Mode: Fixed query-related and limit issues in chat mode.
October 7, 2025 Update
October 7, 2025 Update
Features:
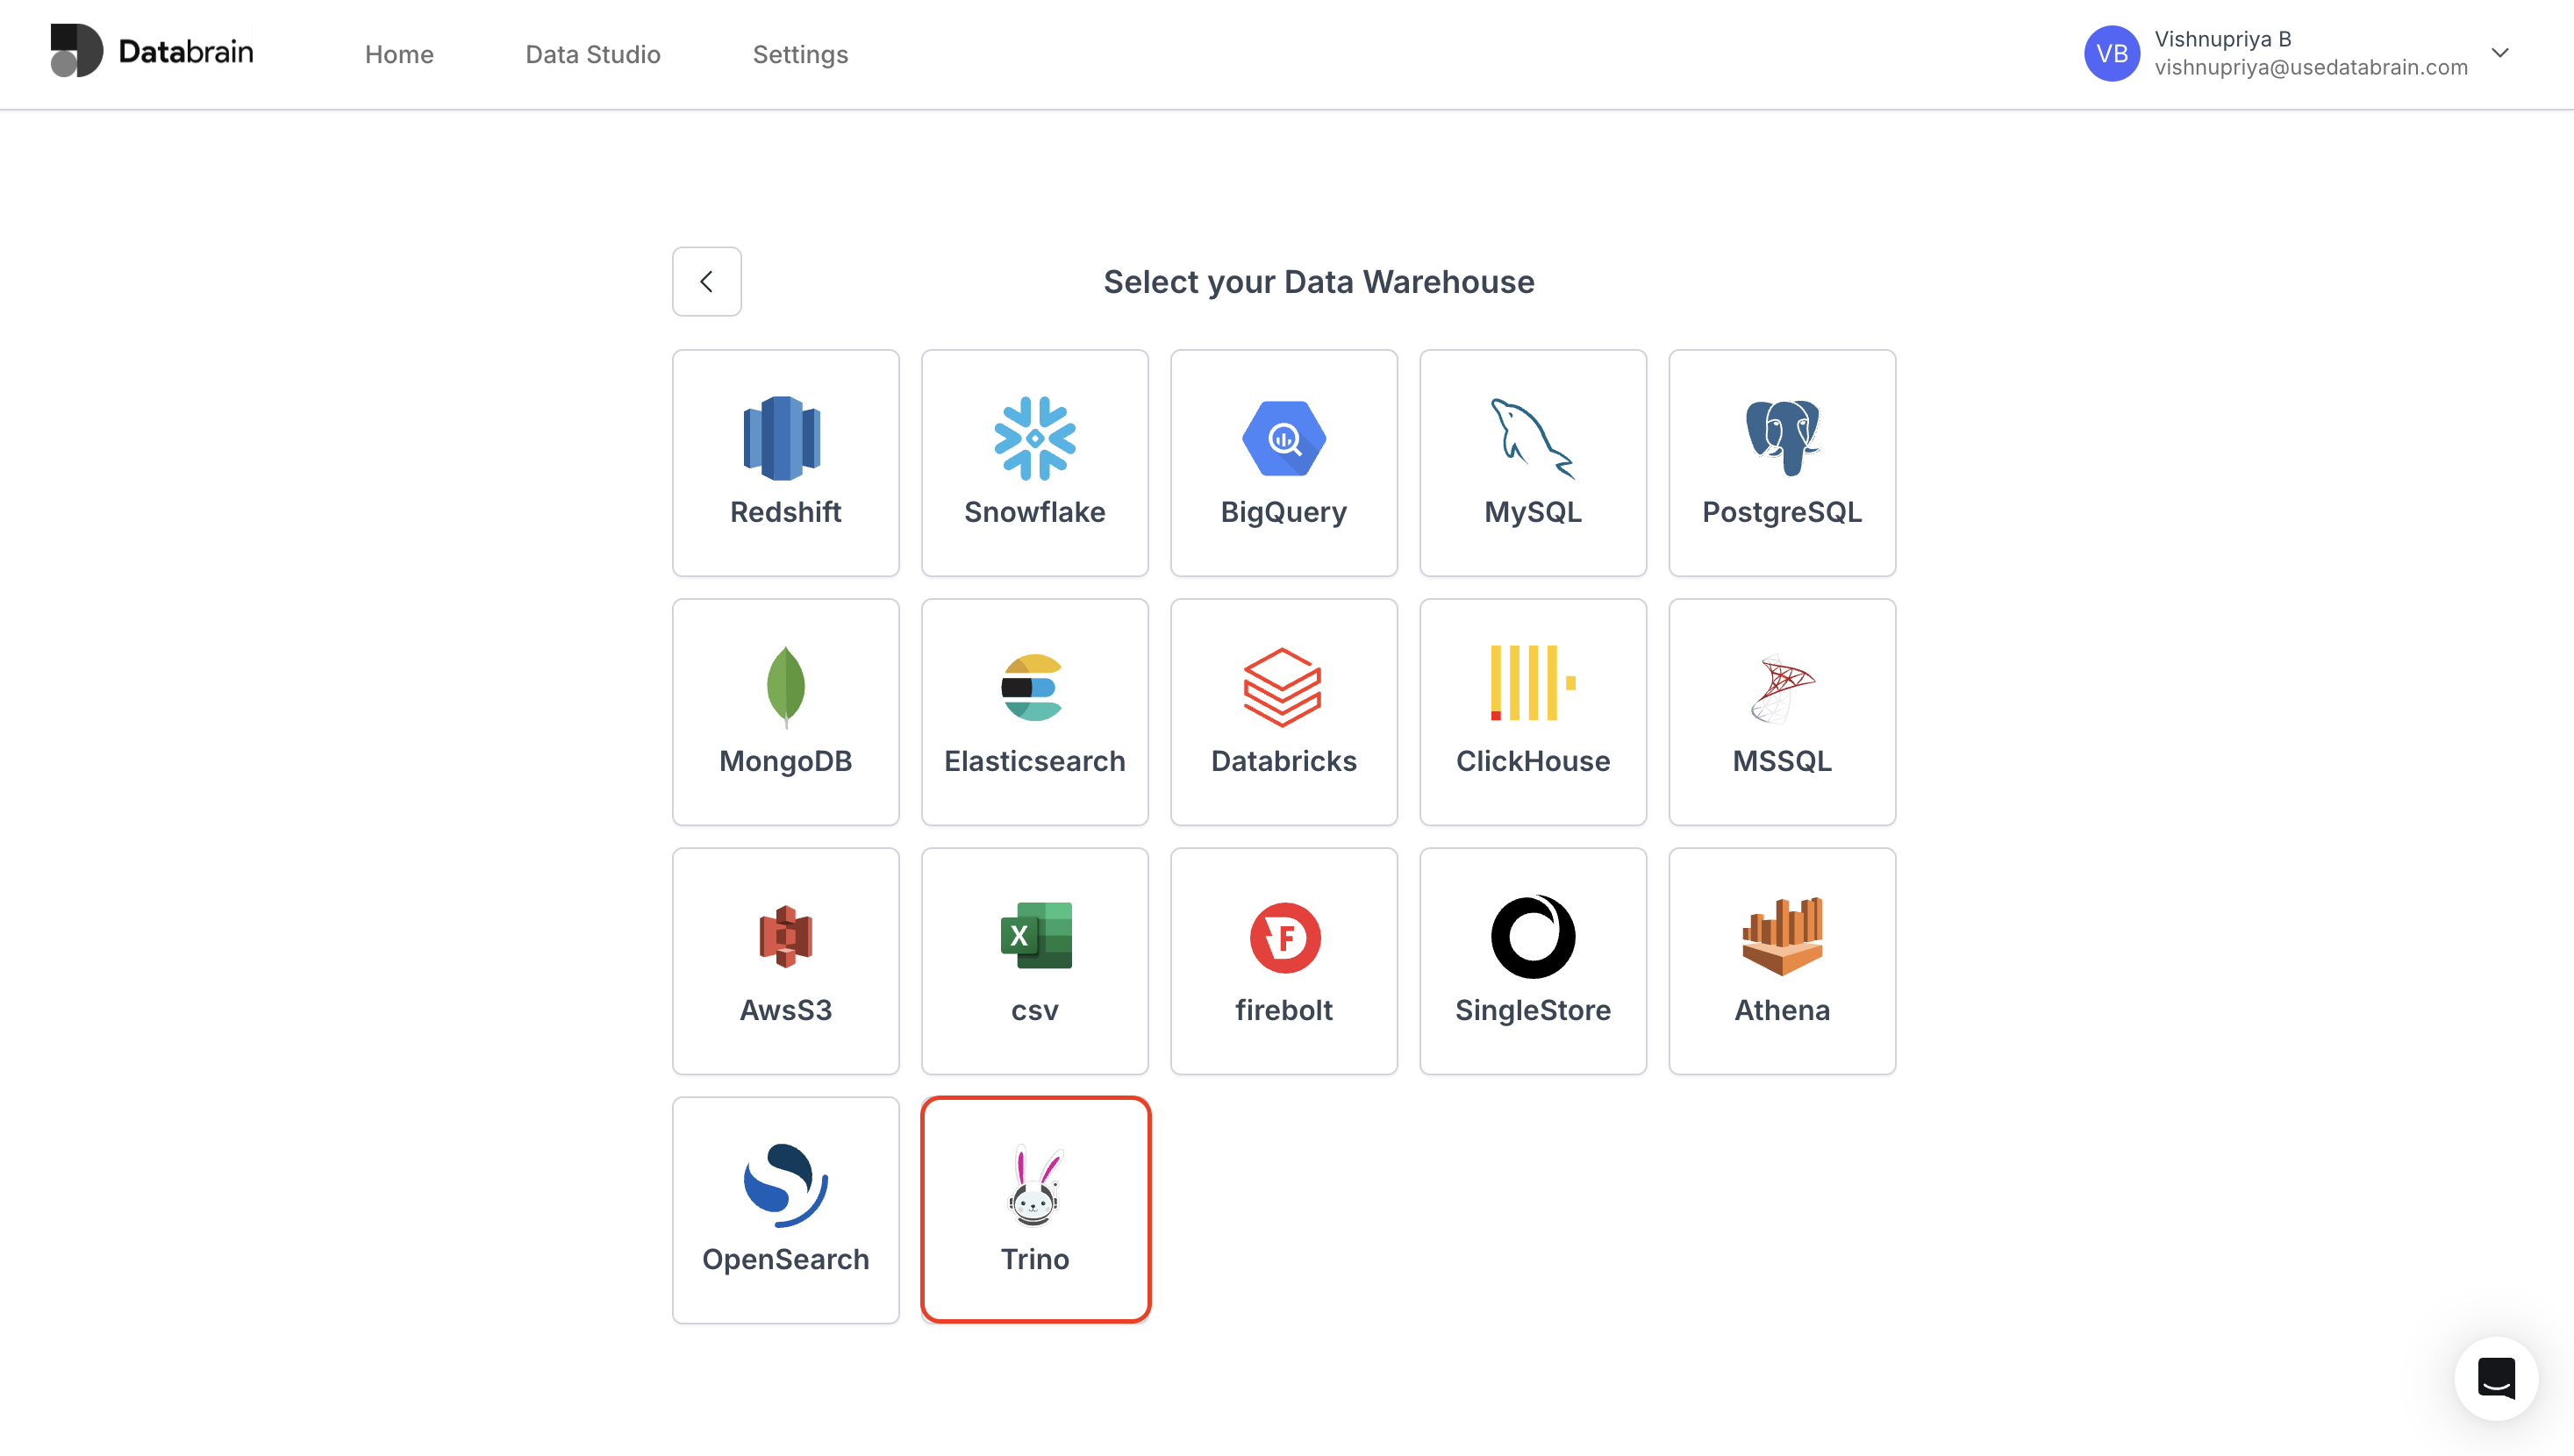
- API Endpoint for End User Dashboard Creation: End users can now create dashboards directly through the API.
- New Data Source – Trino: Added support for a new data source — Trino.
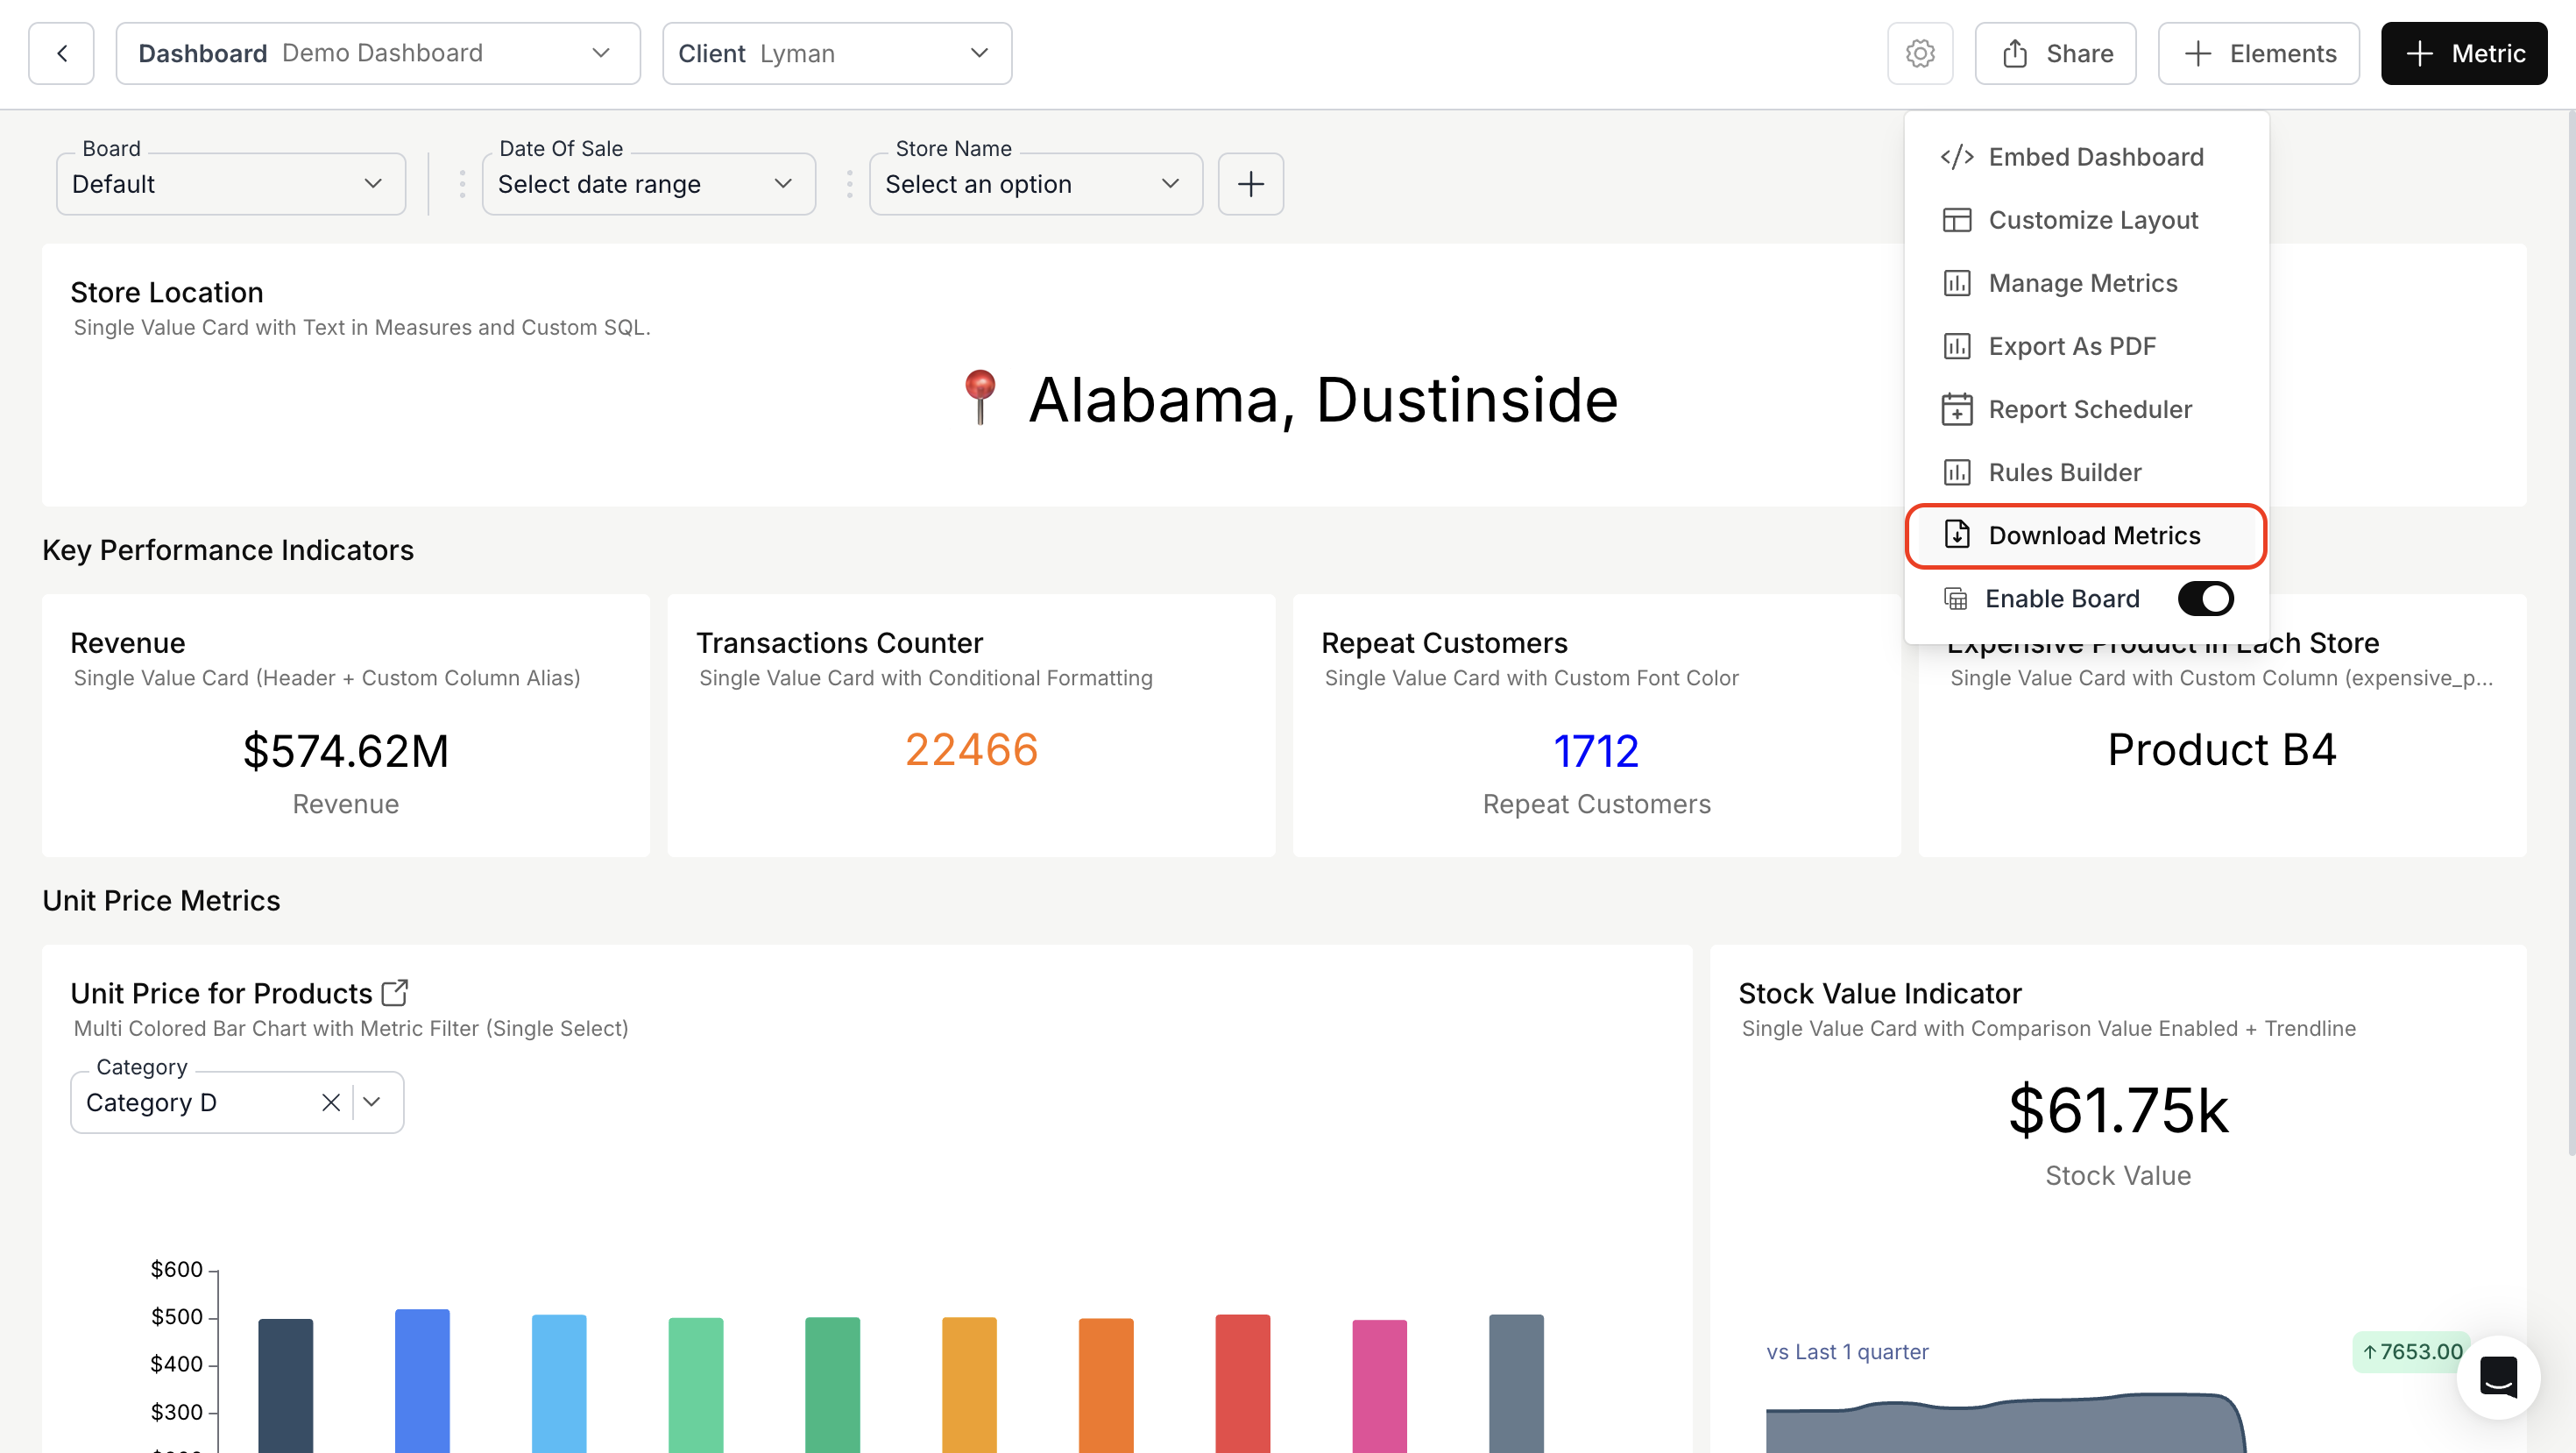
- Single-Click Download for Metrics Data in Embed: End users can now download the underlying data for all metrics with one click by adding the prop:
enable-download-csv="true" - Fullscreen Metrics in Embed: Metrics can now fit fullscreen in embeds using the prop:
shouldFitFullScreen="true"
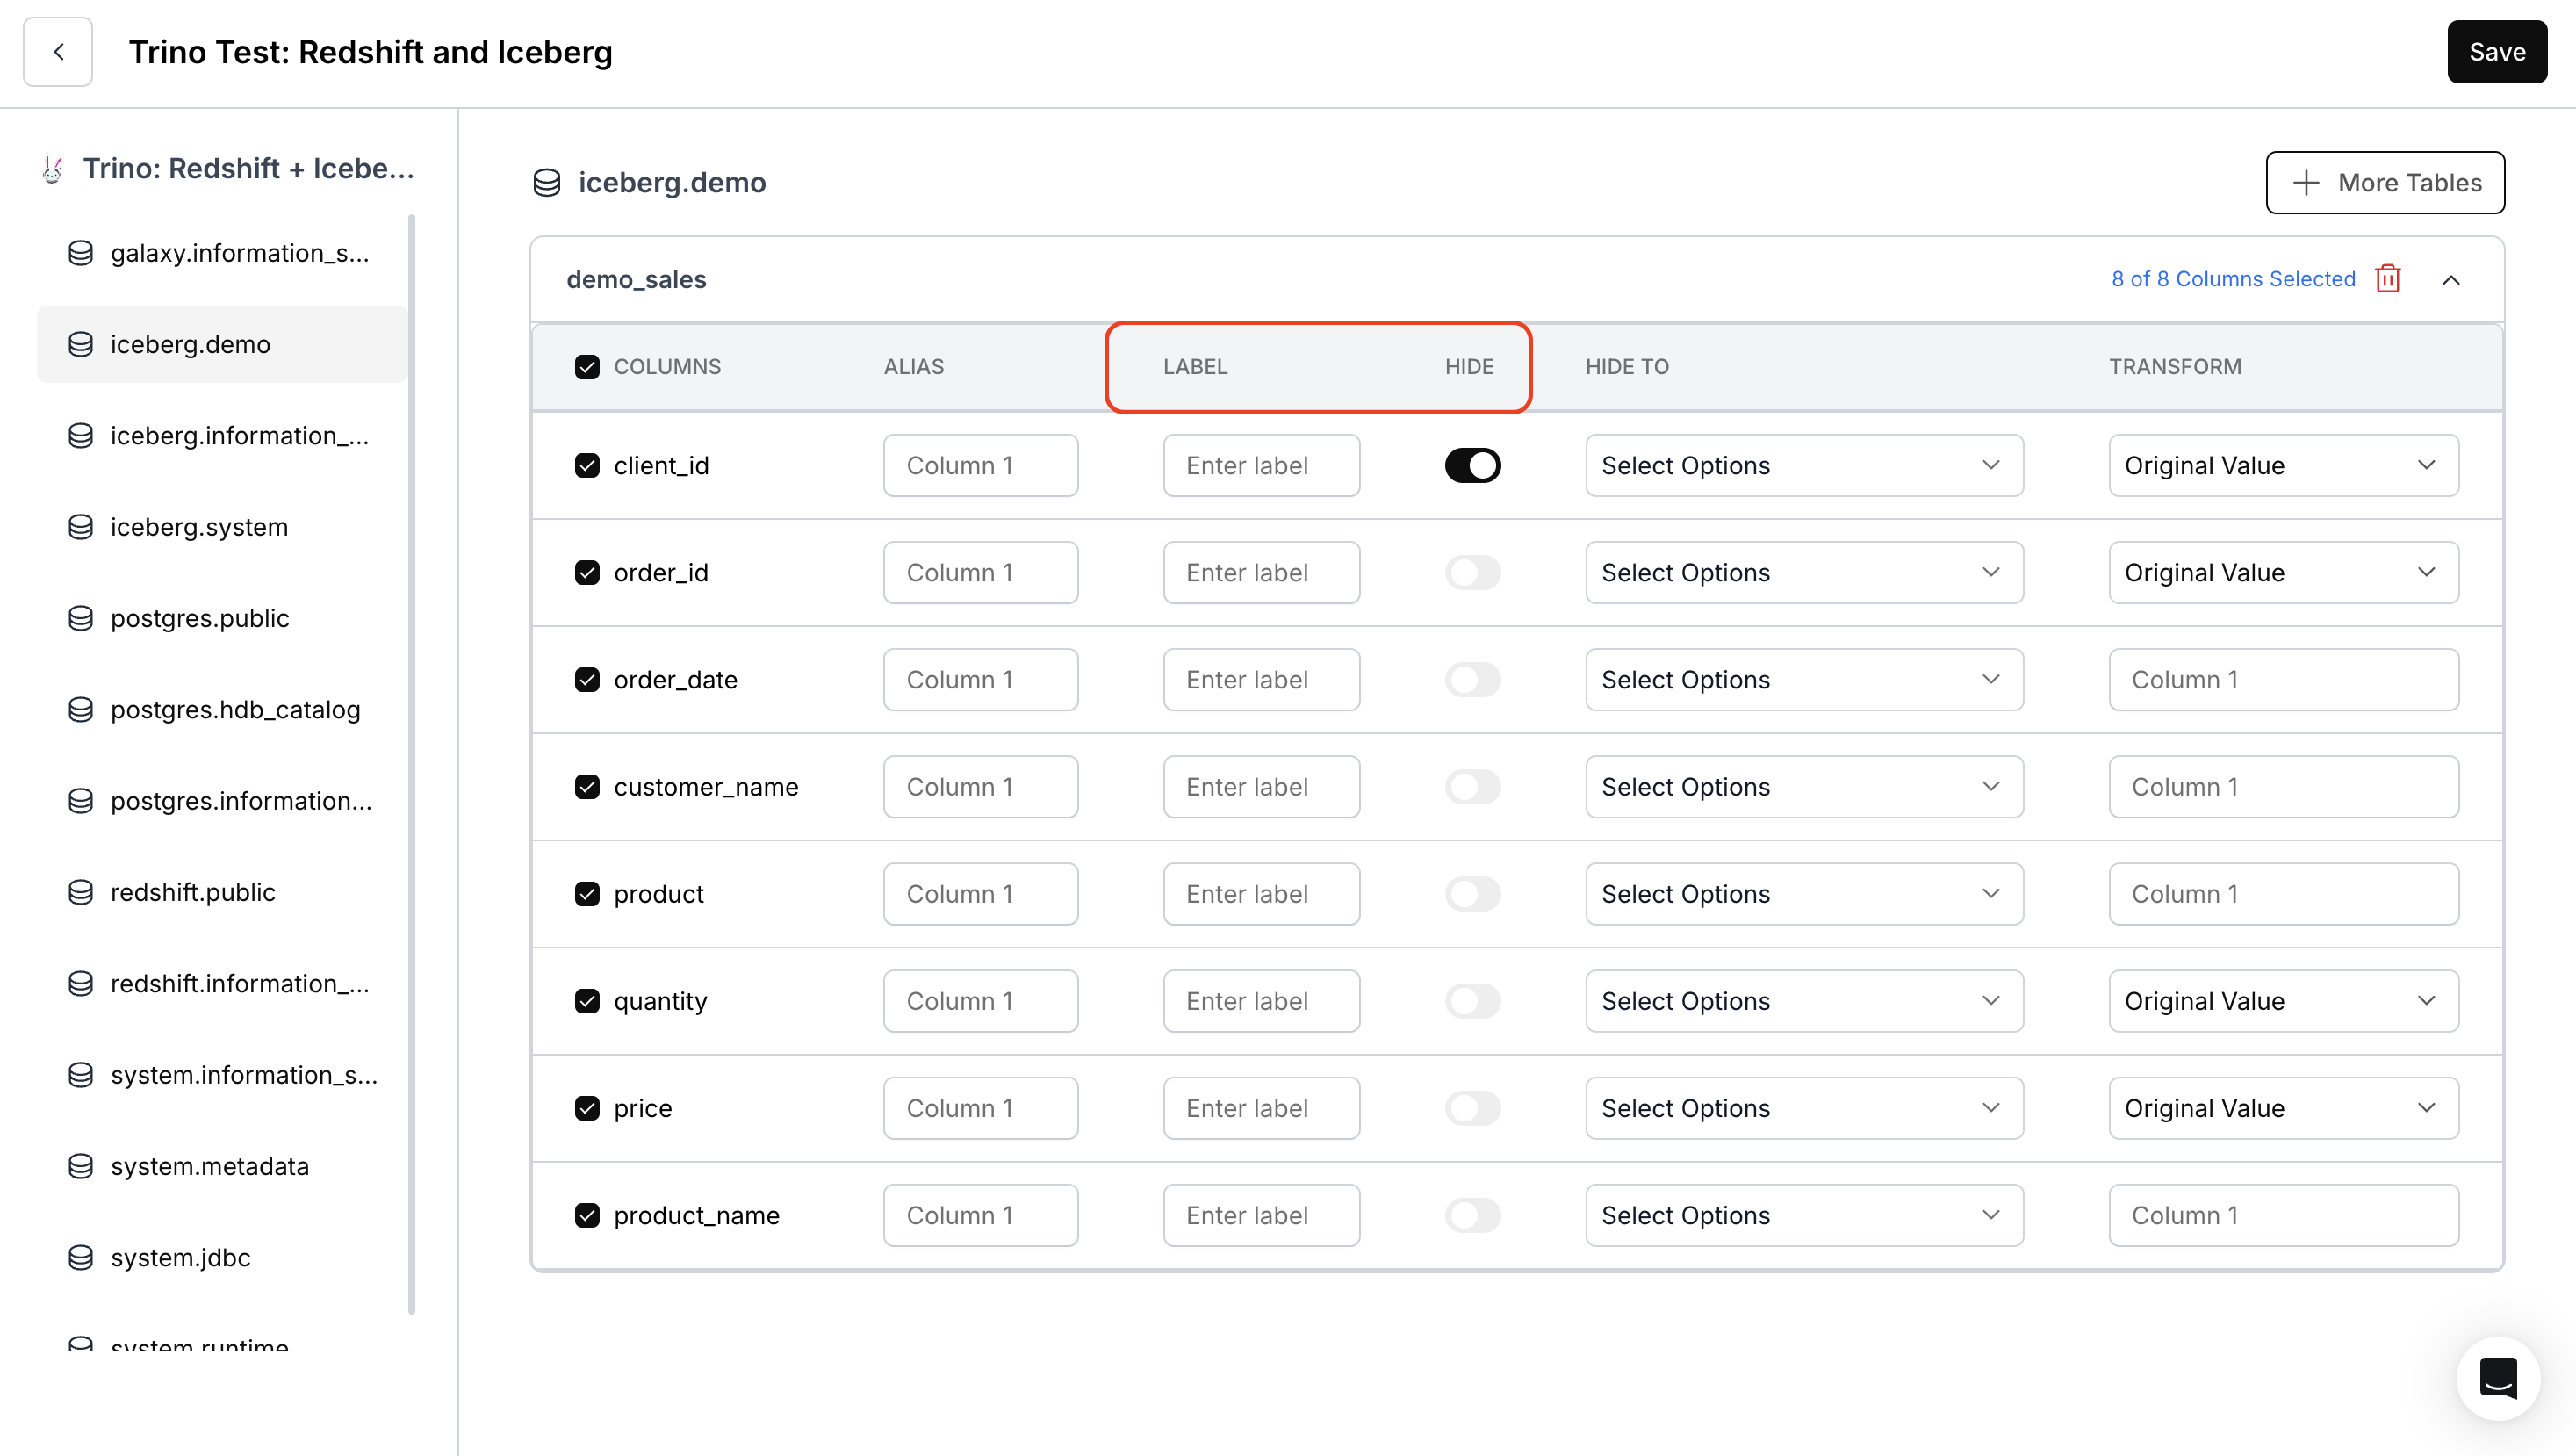
Enhancements:
- Support for Label and Hide Options in Datamart & Create Metric: You can now add labels to columns and hide columns on the create metric page by configuring them in the Datamart layer.
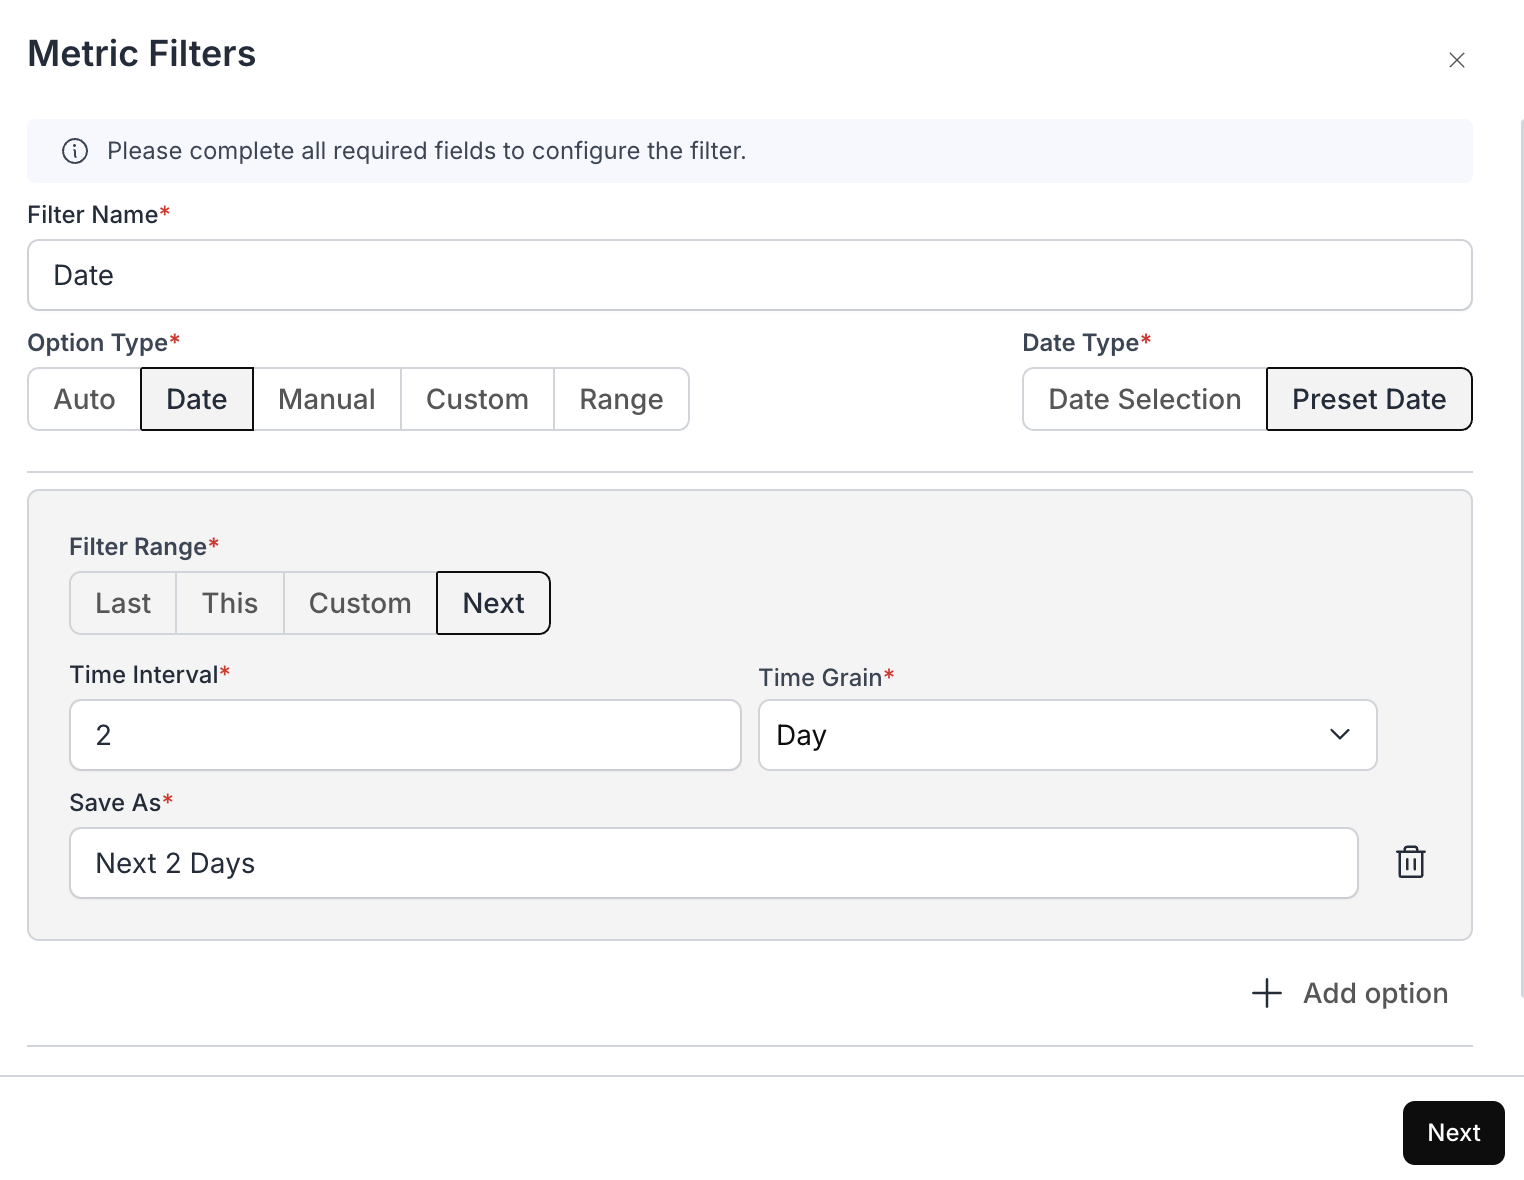
- Variable Value Support for Next Preset Date Filter: Added variable value support for the “Next” preset date option in metric and dashboard filters.
Fixes:
- Removed Background Color from Dashboard PDFs: Dashboard PDF exports no longer include unwanted background colors.
September 16, 2025 Update
September 16, 2025 Update
Features:
- Single Click Download for Metrics Data: Users can now download the underlying data for all metrics with just one click.
Enhancements:
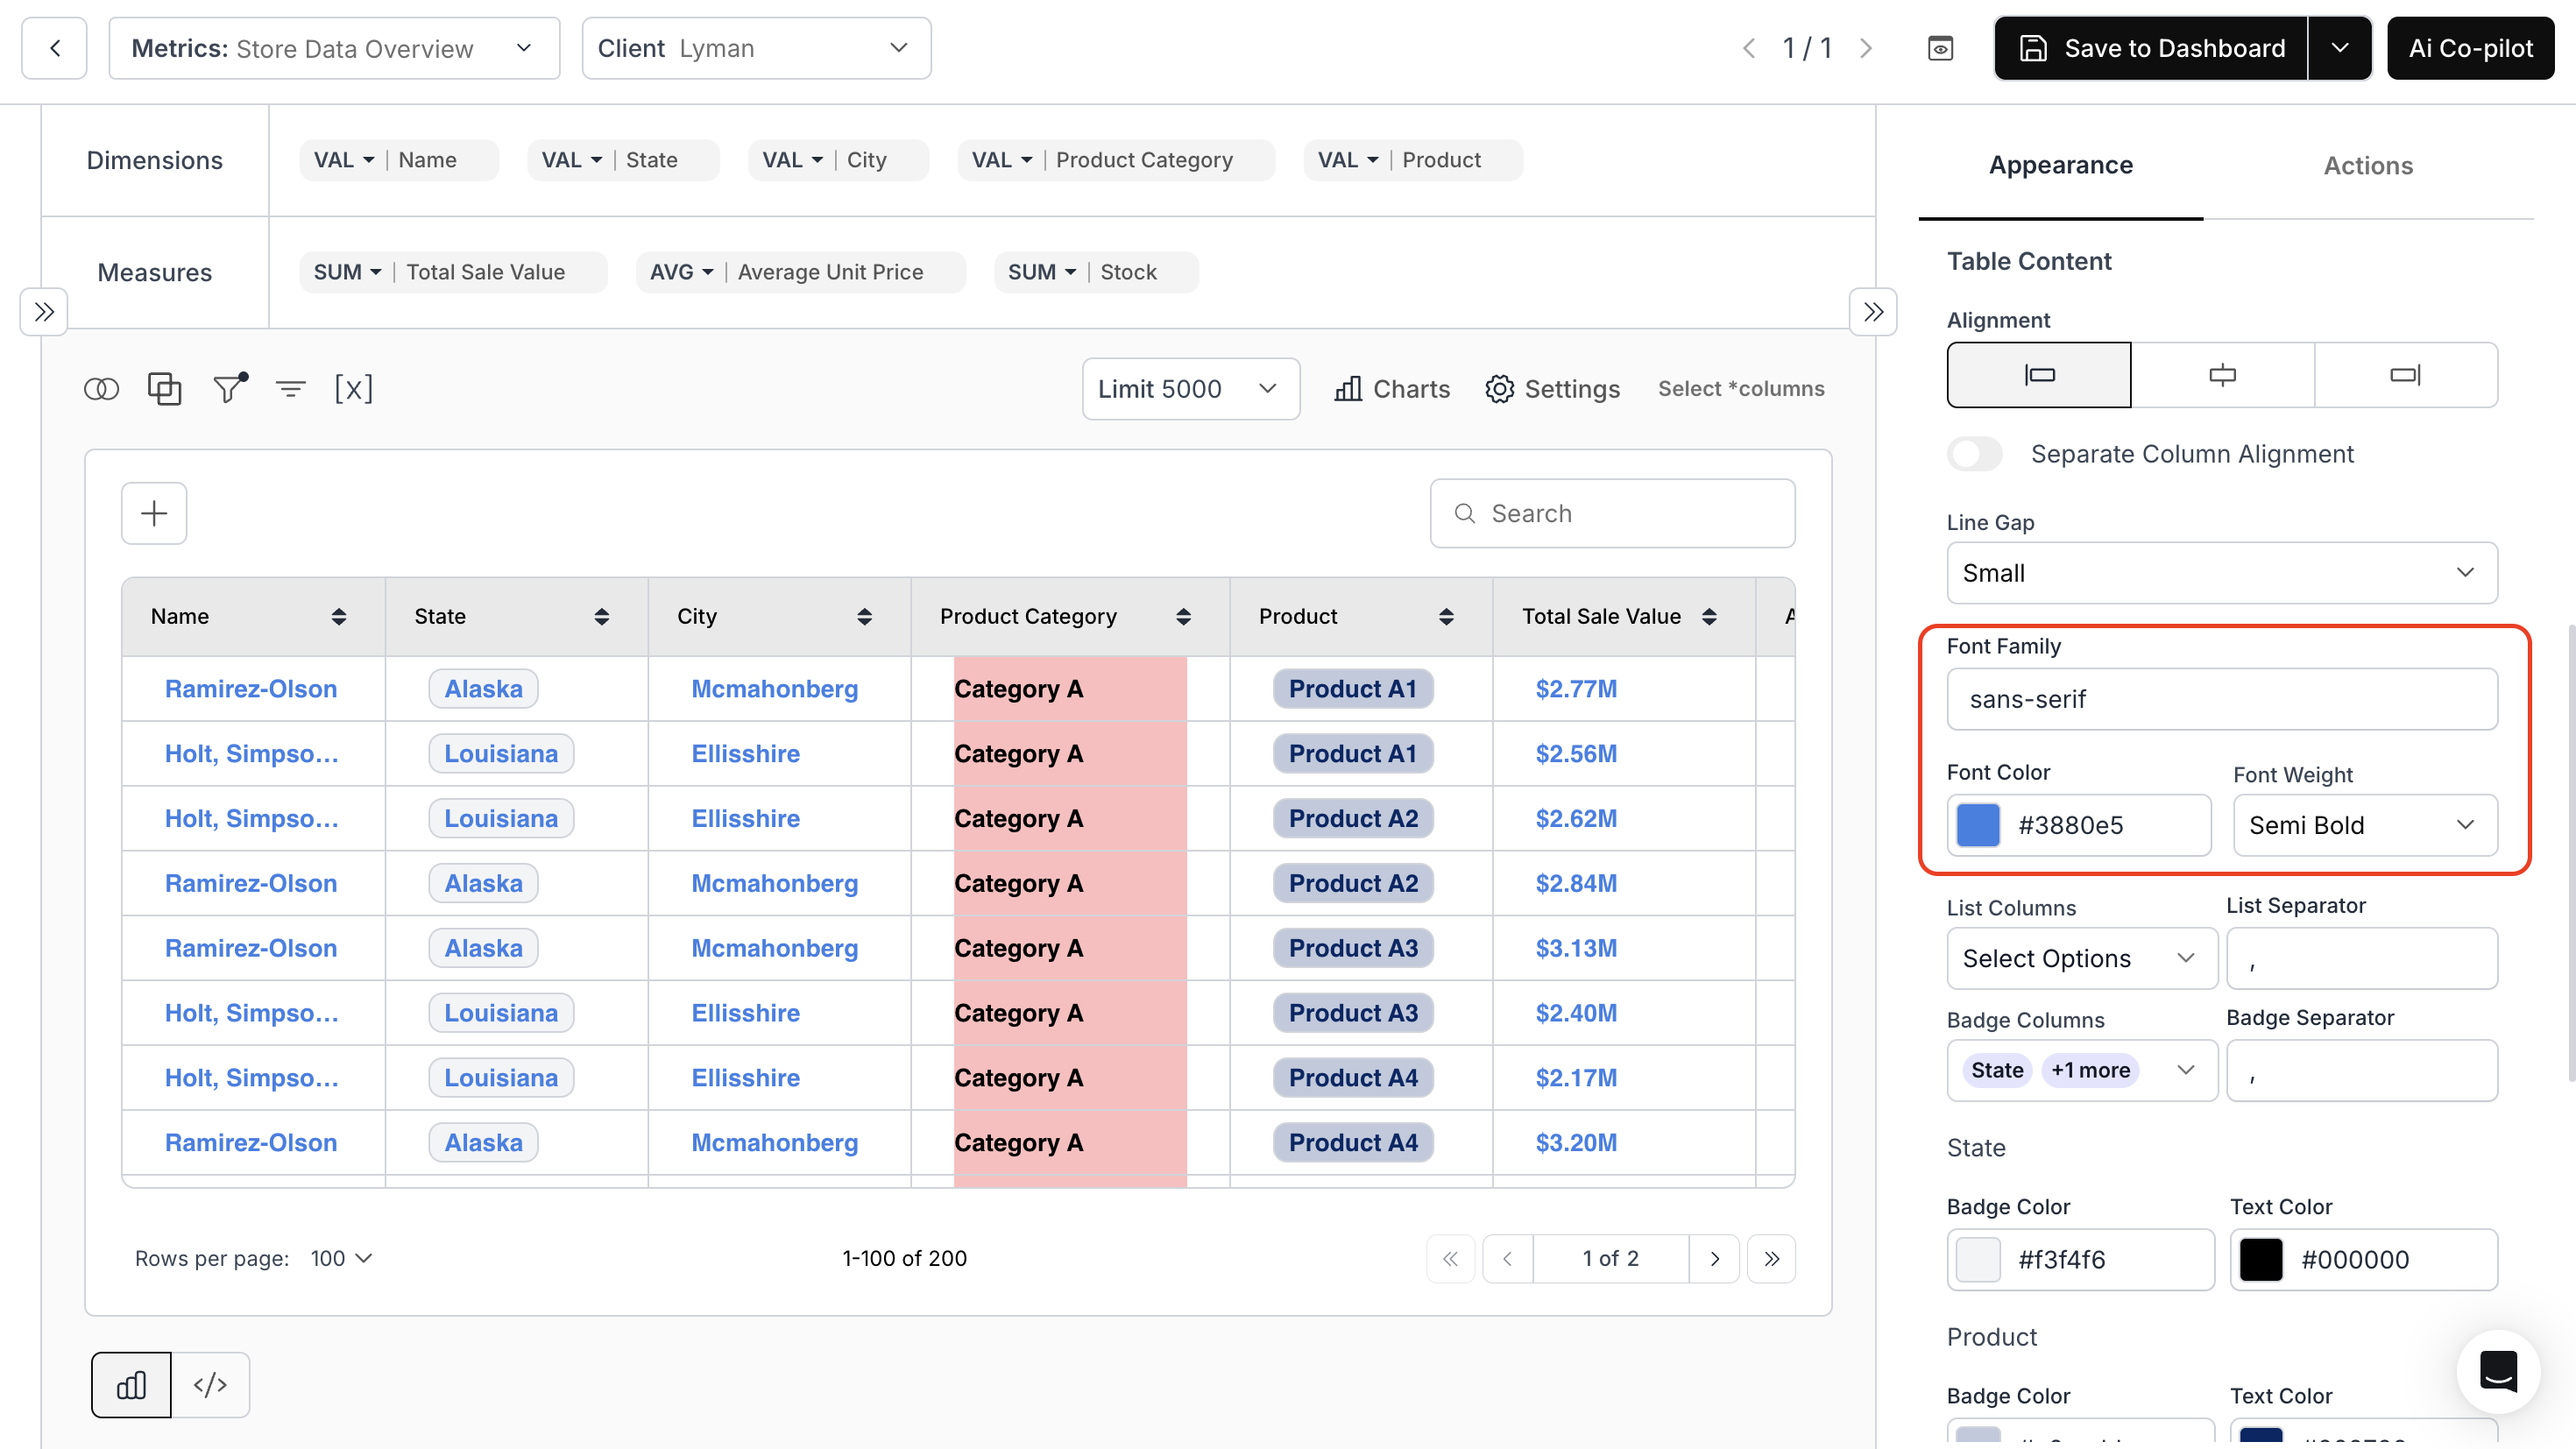
- Customizable Fonts for Table Chart: Added options to configure font family, font color, and font weight in table charts.
- UI Theming for Underlying Data: Introduced settings to customize header text, background color, content text, spacing, and font weight for underlying data.
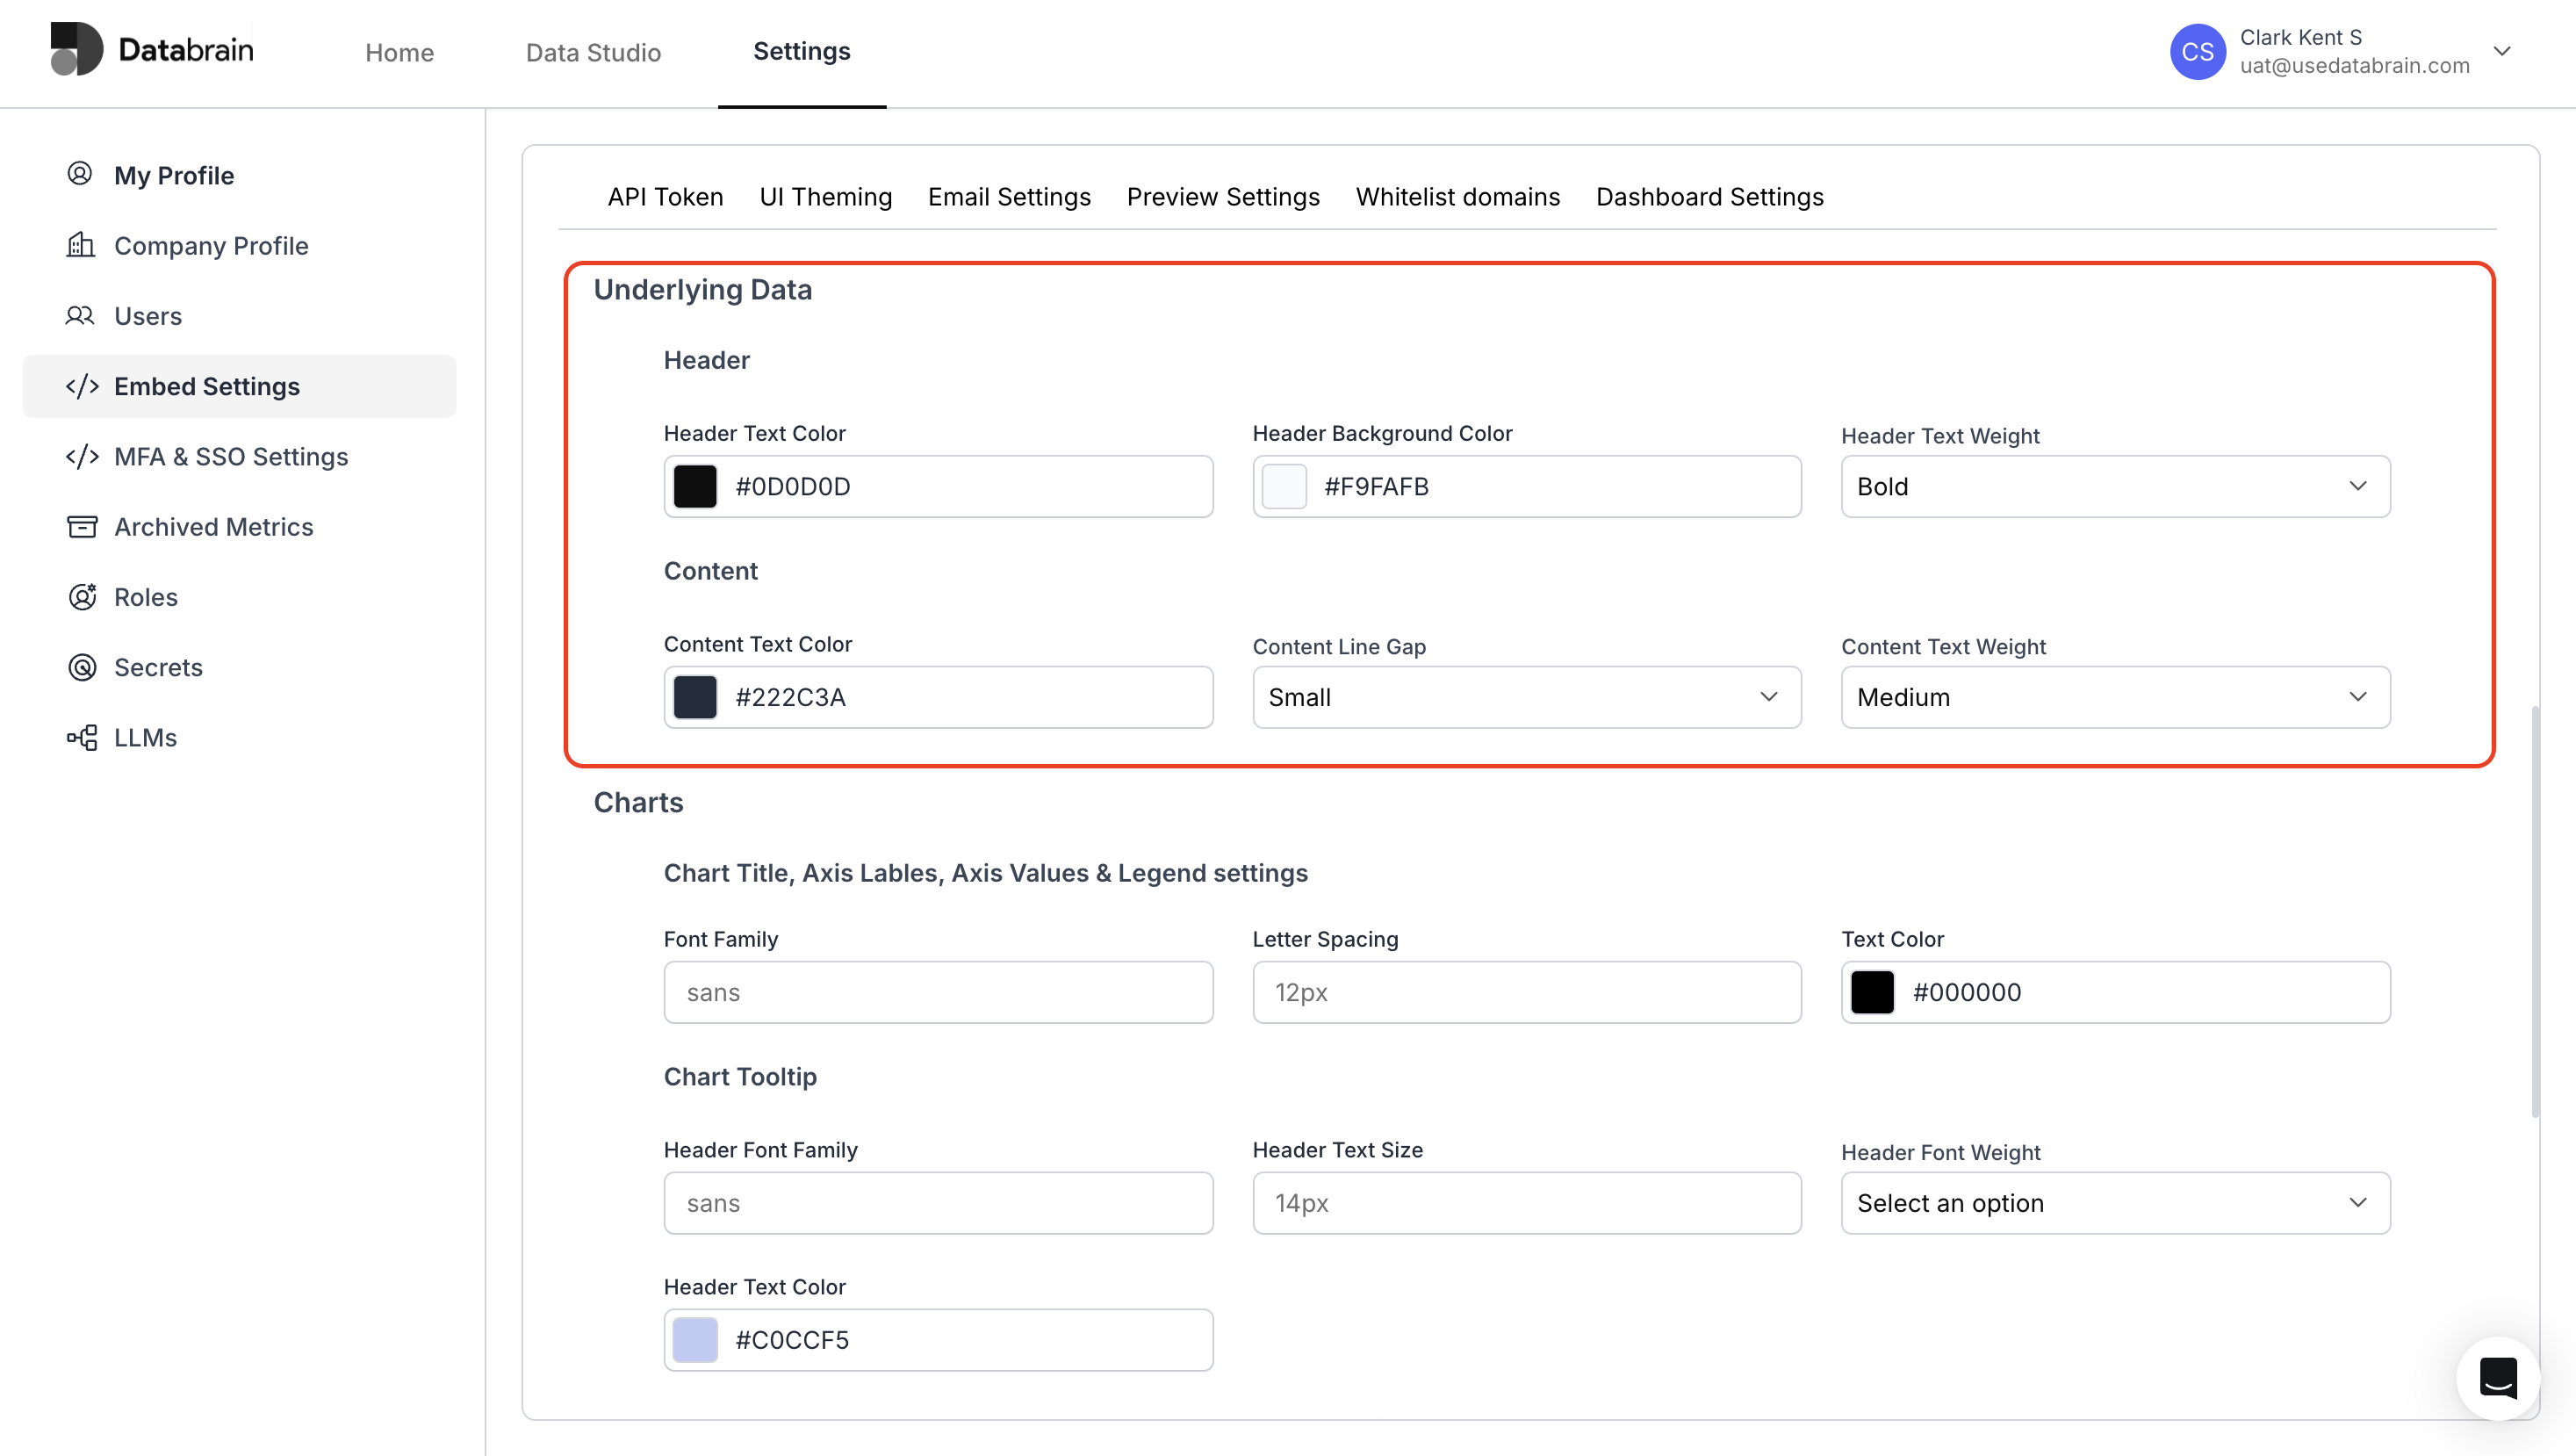
Fixes:
- UI Theming Fixes: Resolved inconsistencies in theme fonts, labels, and background styling in Single Select, Preset Date, and Range dropdowns.
- Metric Filter in Dashboard View: Fixed issues affecting the proper functioning of metric filters in dashboard views.
- Datasource Logo in Dropdowns: Datasource logos are now displayed alongside datasource names in dropdown menus.
- Auto Filter Reset Defaults: Corrected issues where default values in Single Select and Multi Select auto filters were not resetting properly.
September 3, 2025 Update
September 3, 2025 Update
Features:
- Boards: Users can now create multiple views of a dashboard based on applied dashboard filters and easily switch between them.
Boards.mp4
Enhancements:
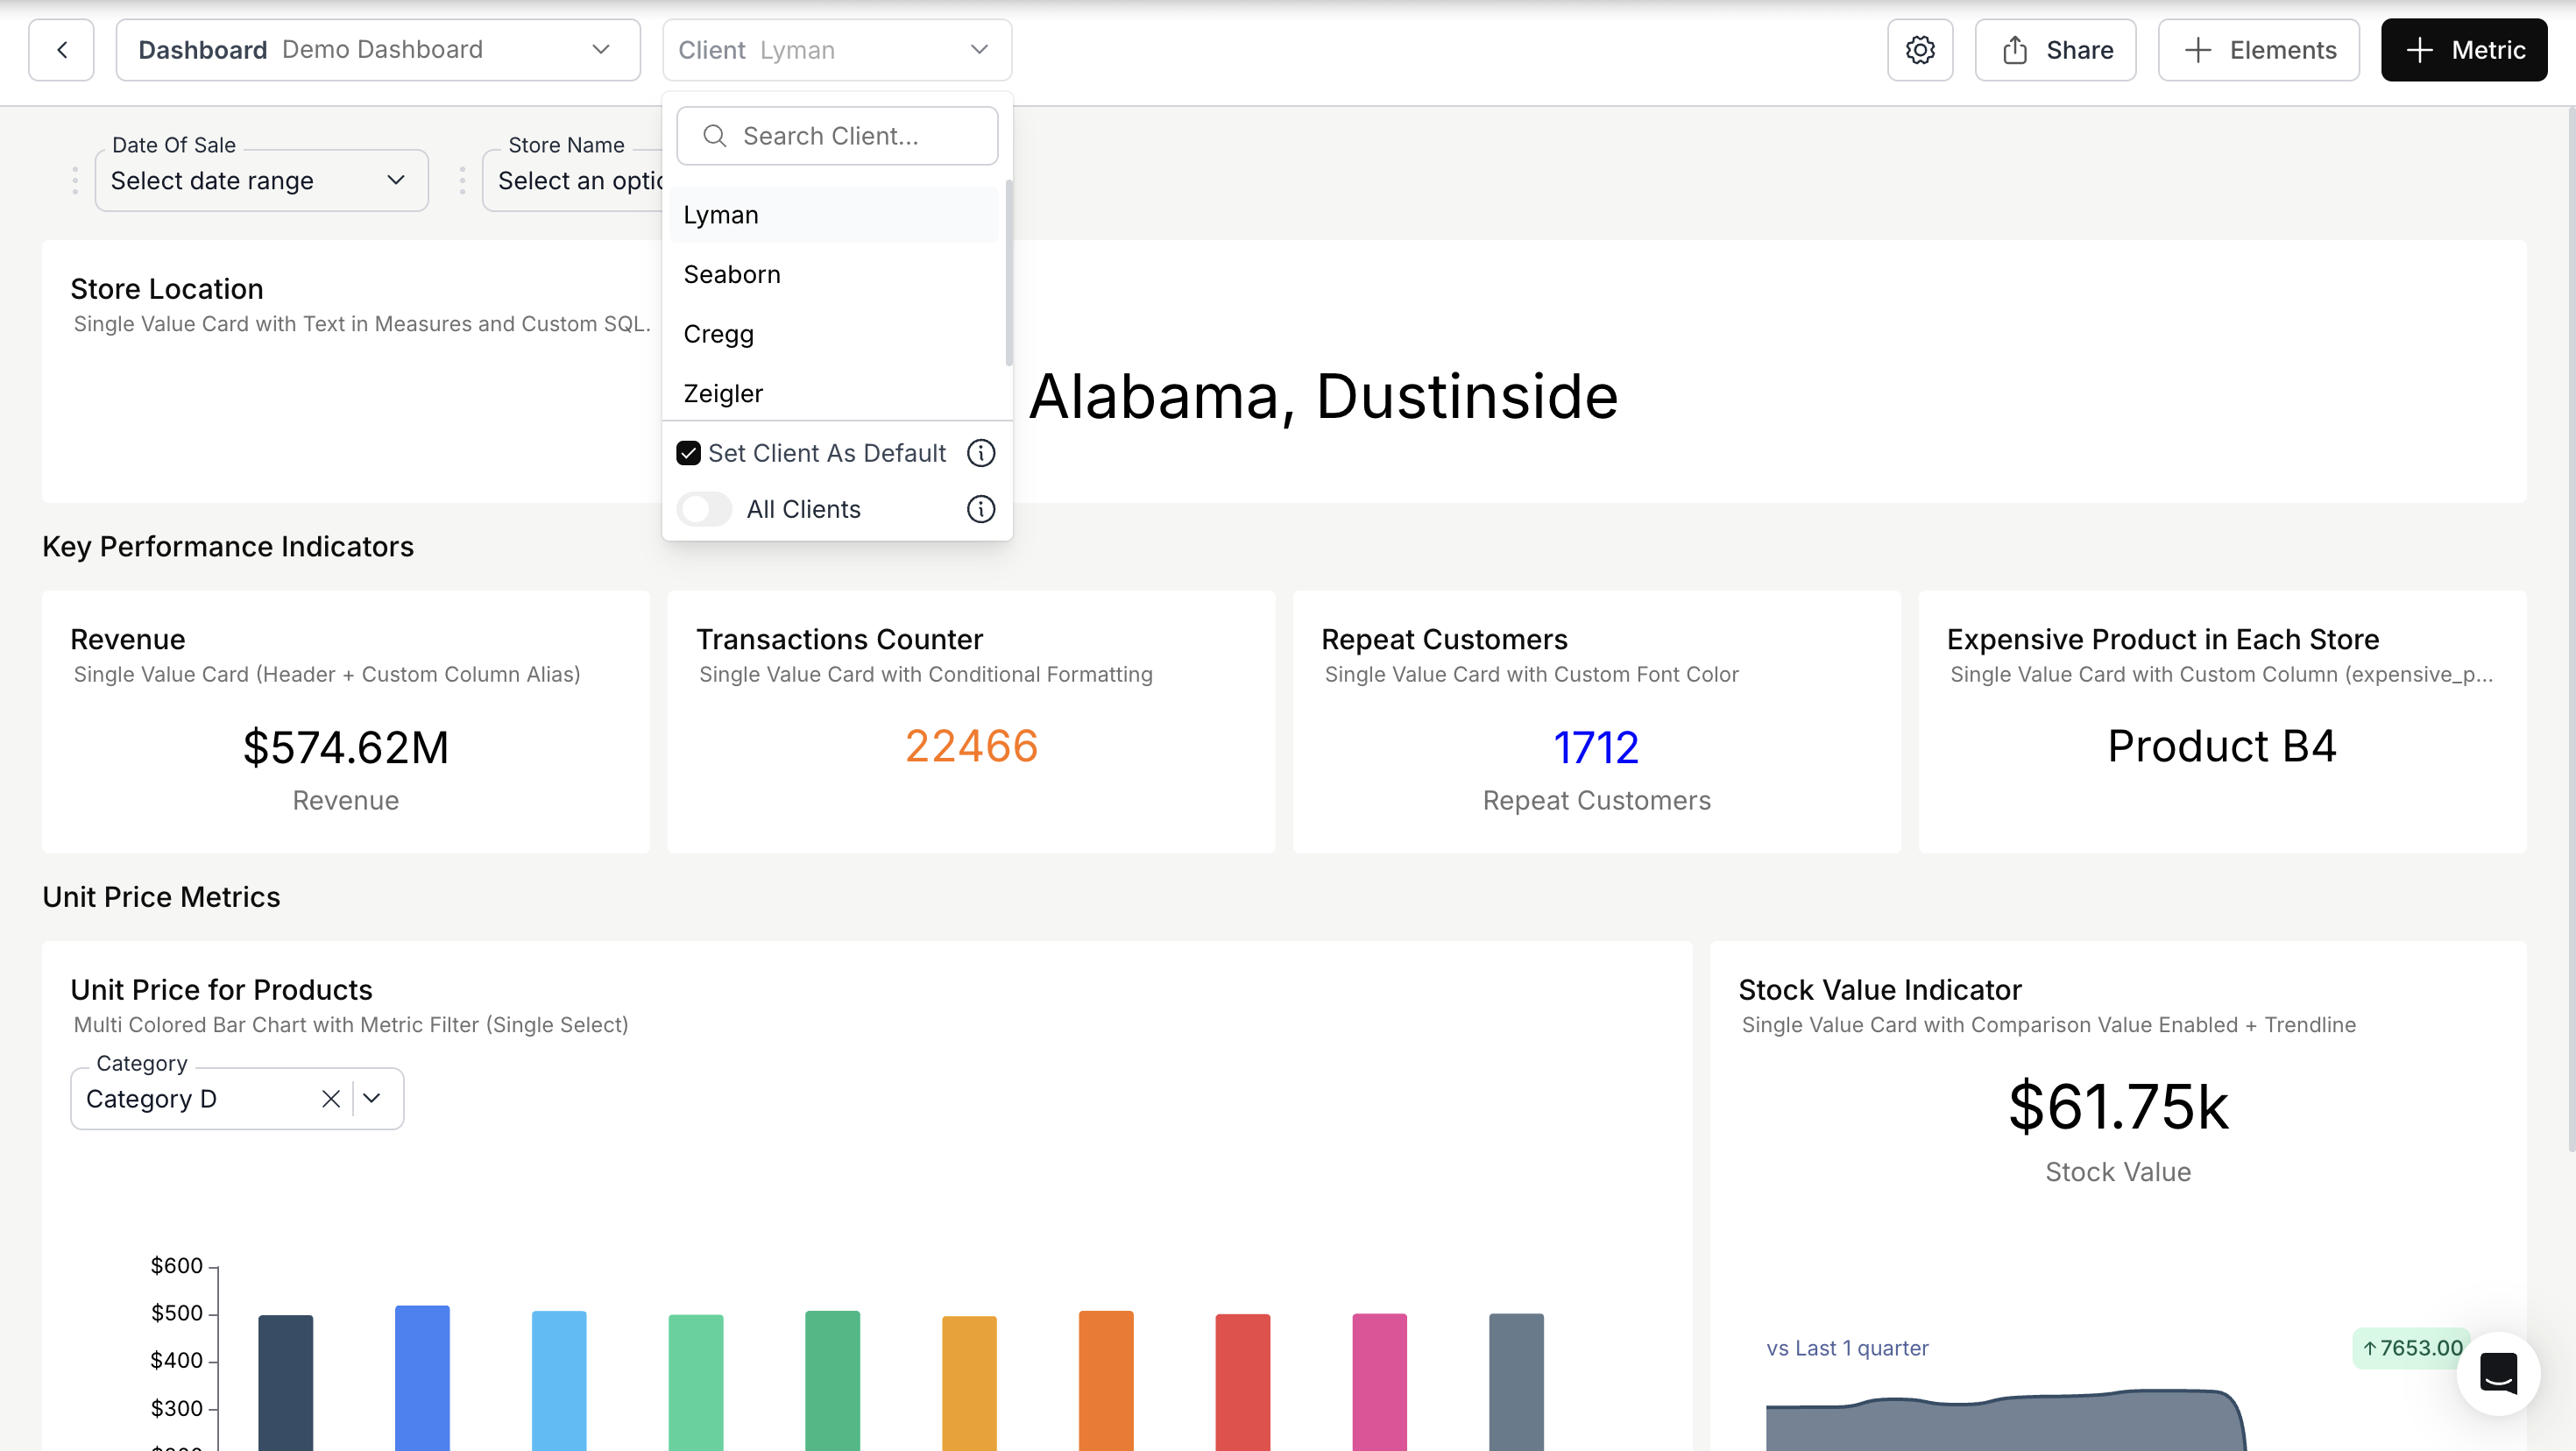
- Set Default Client Per Dashboard: Users can set a default client for each dashboard.
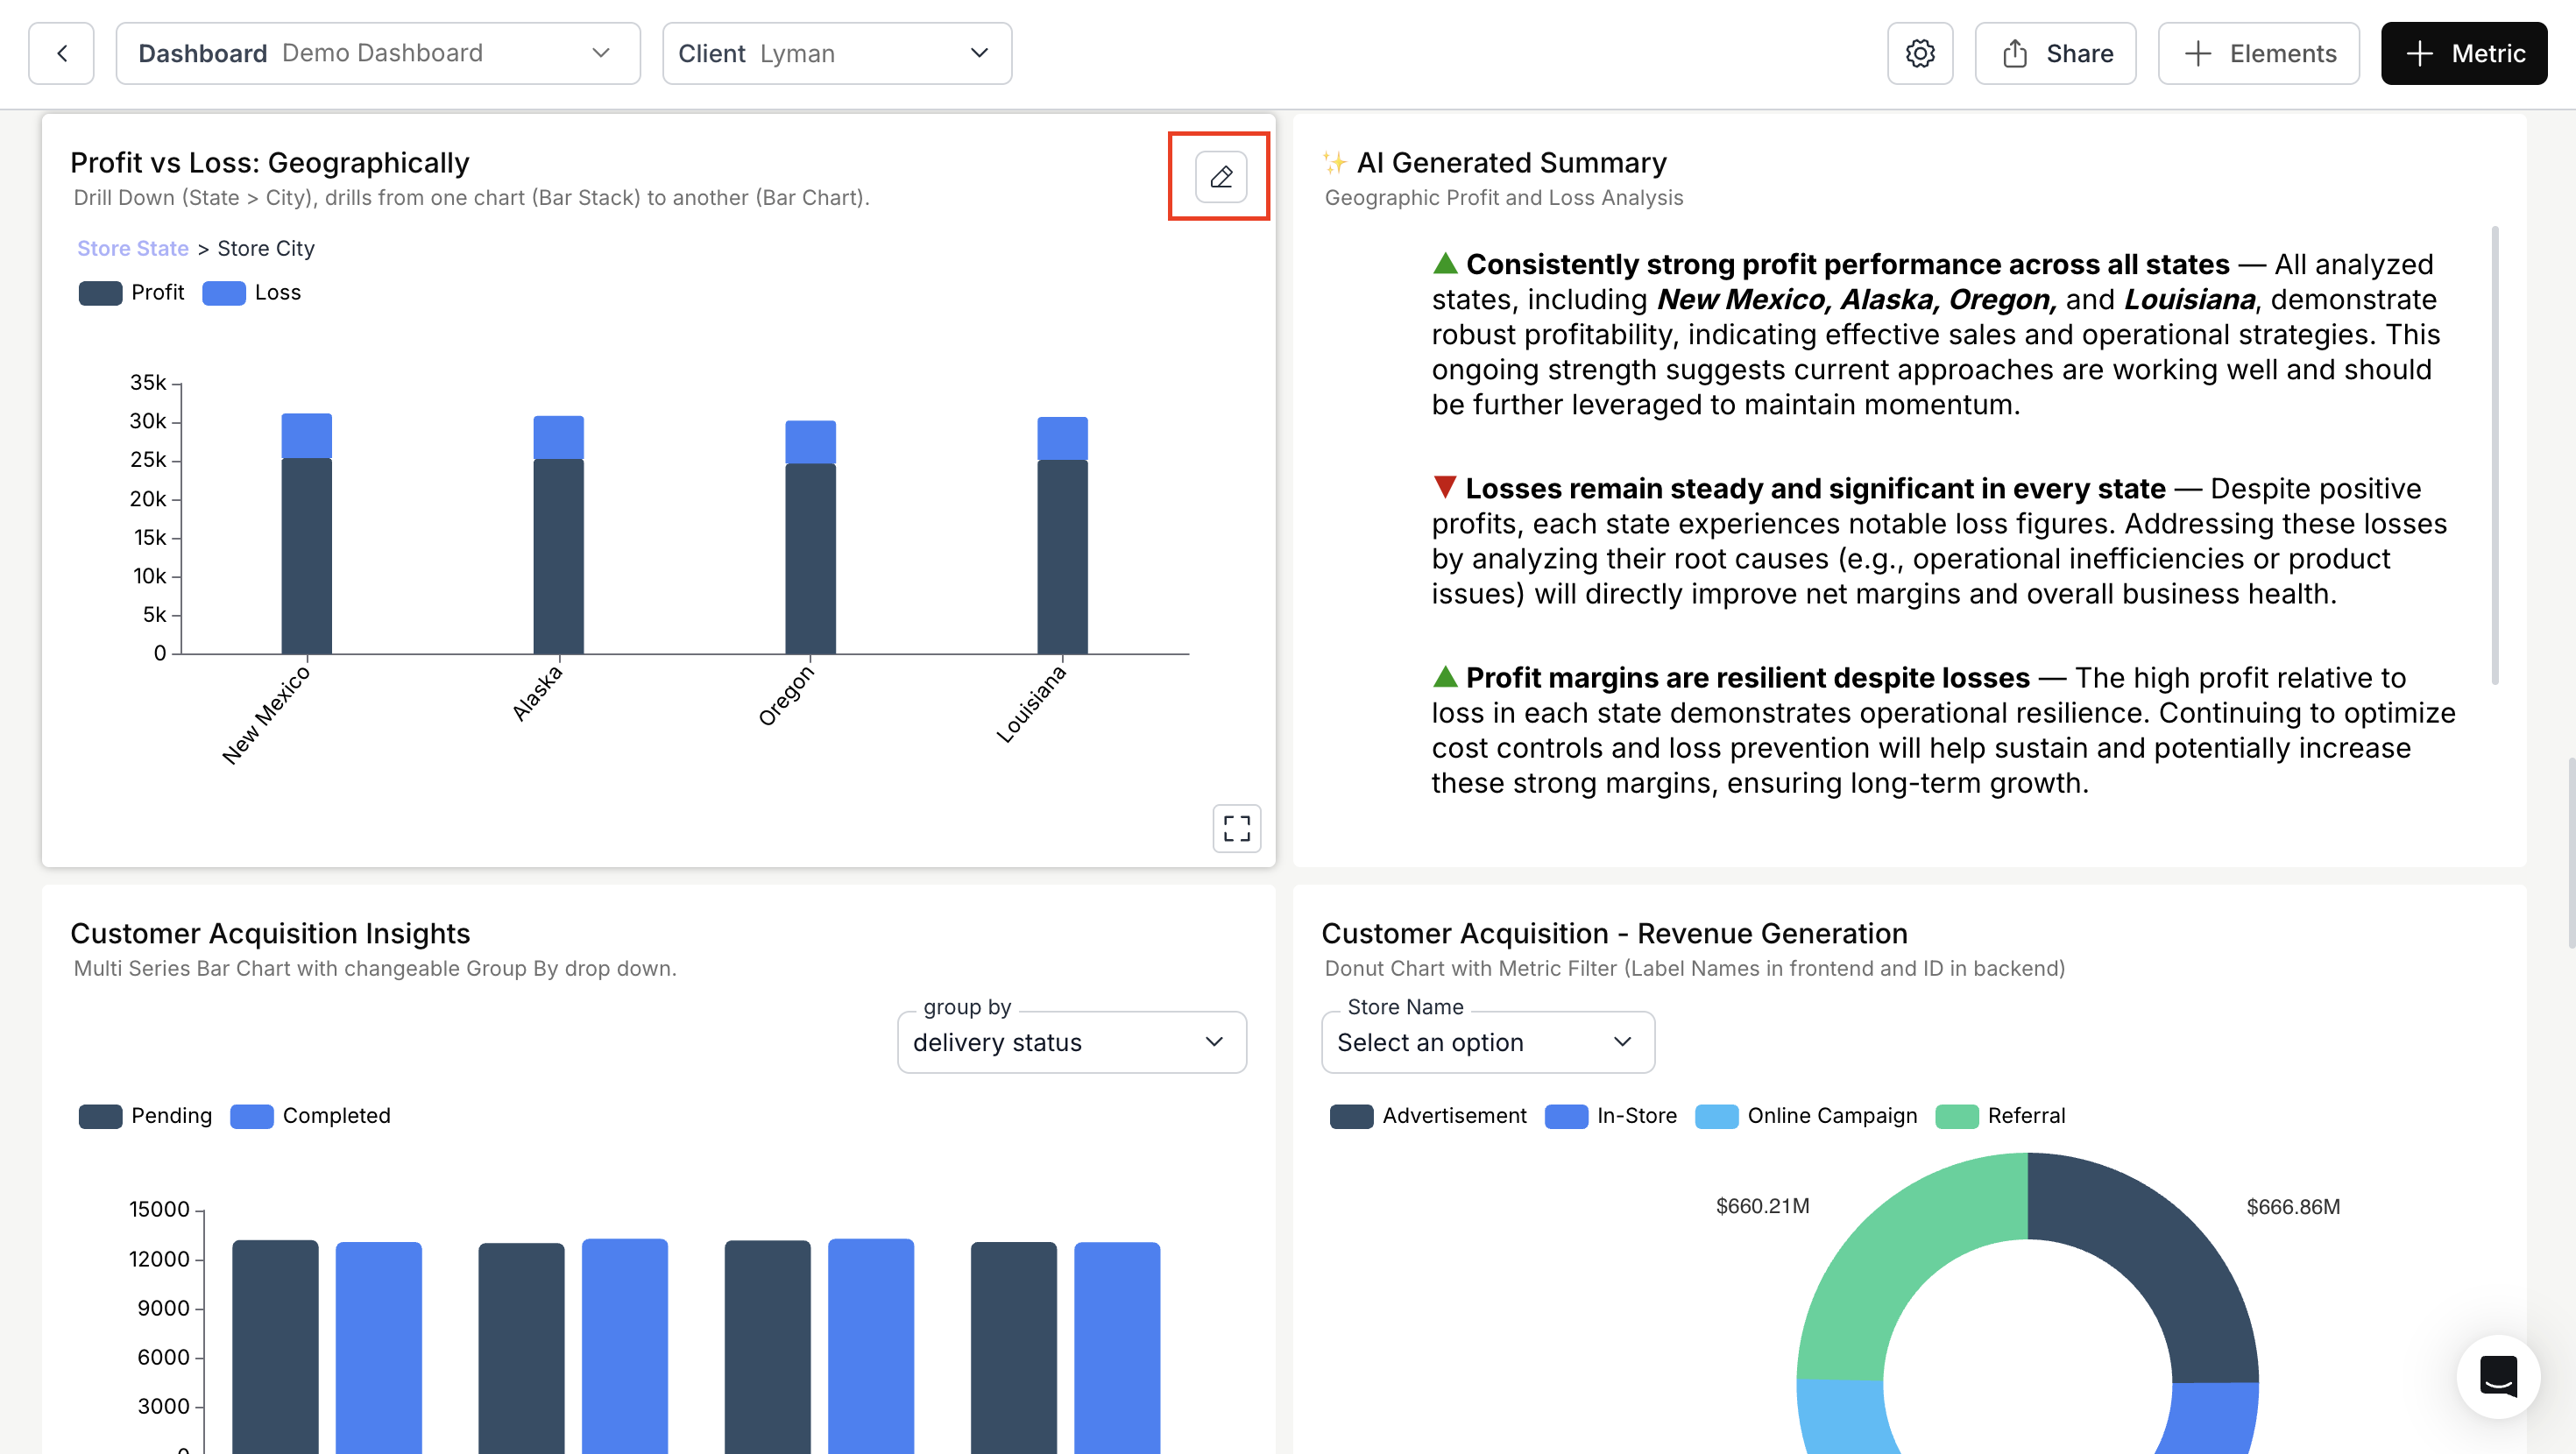
- Edit Metric: Users can edit a metric by clicking the edit icon next to the metric name.
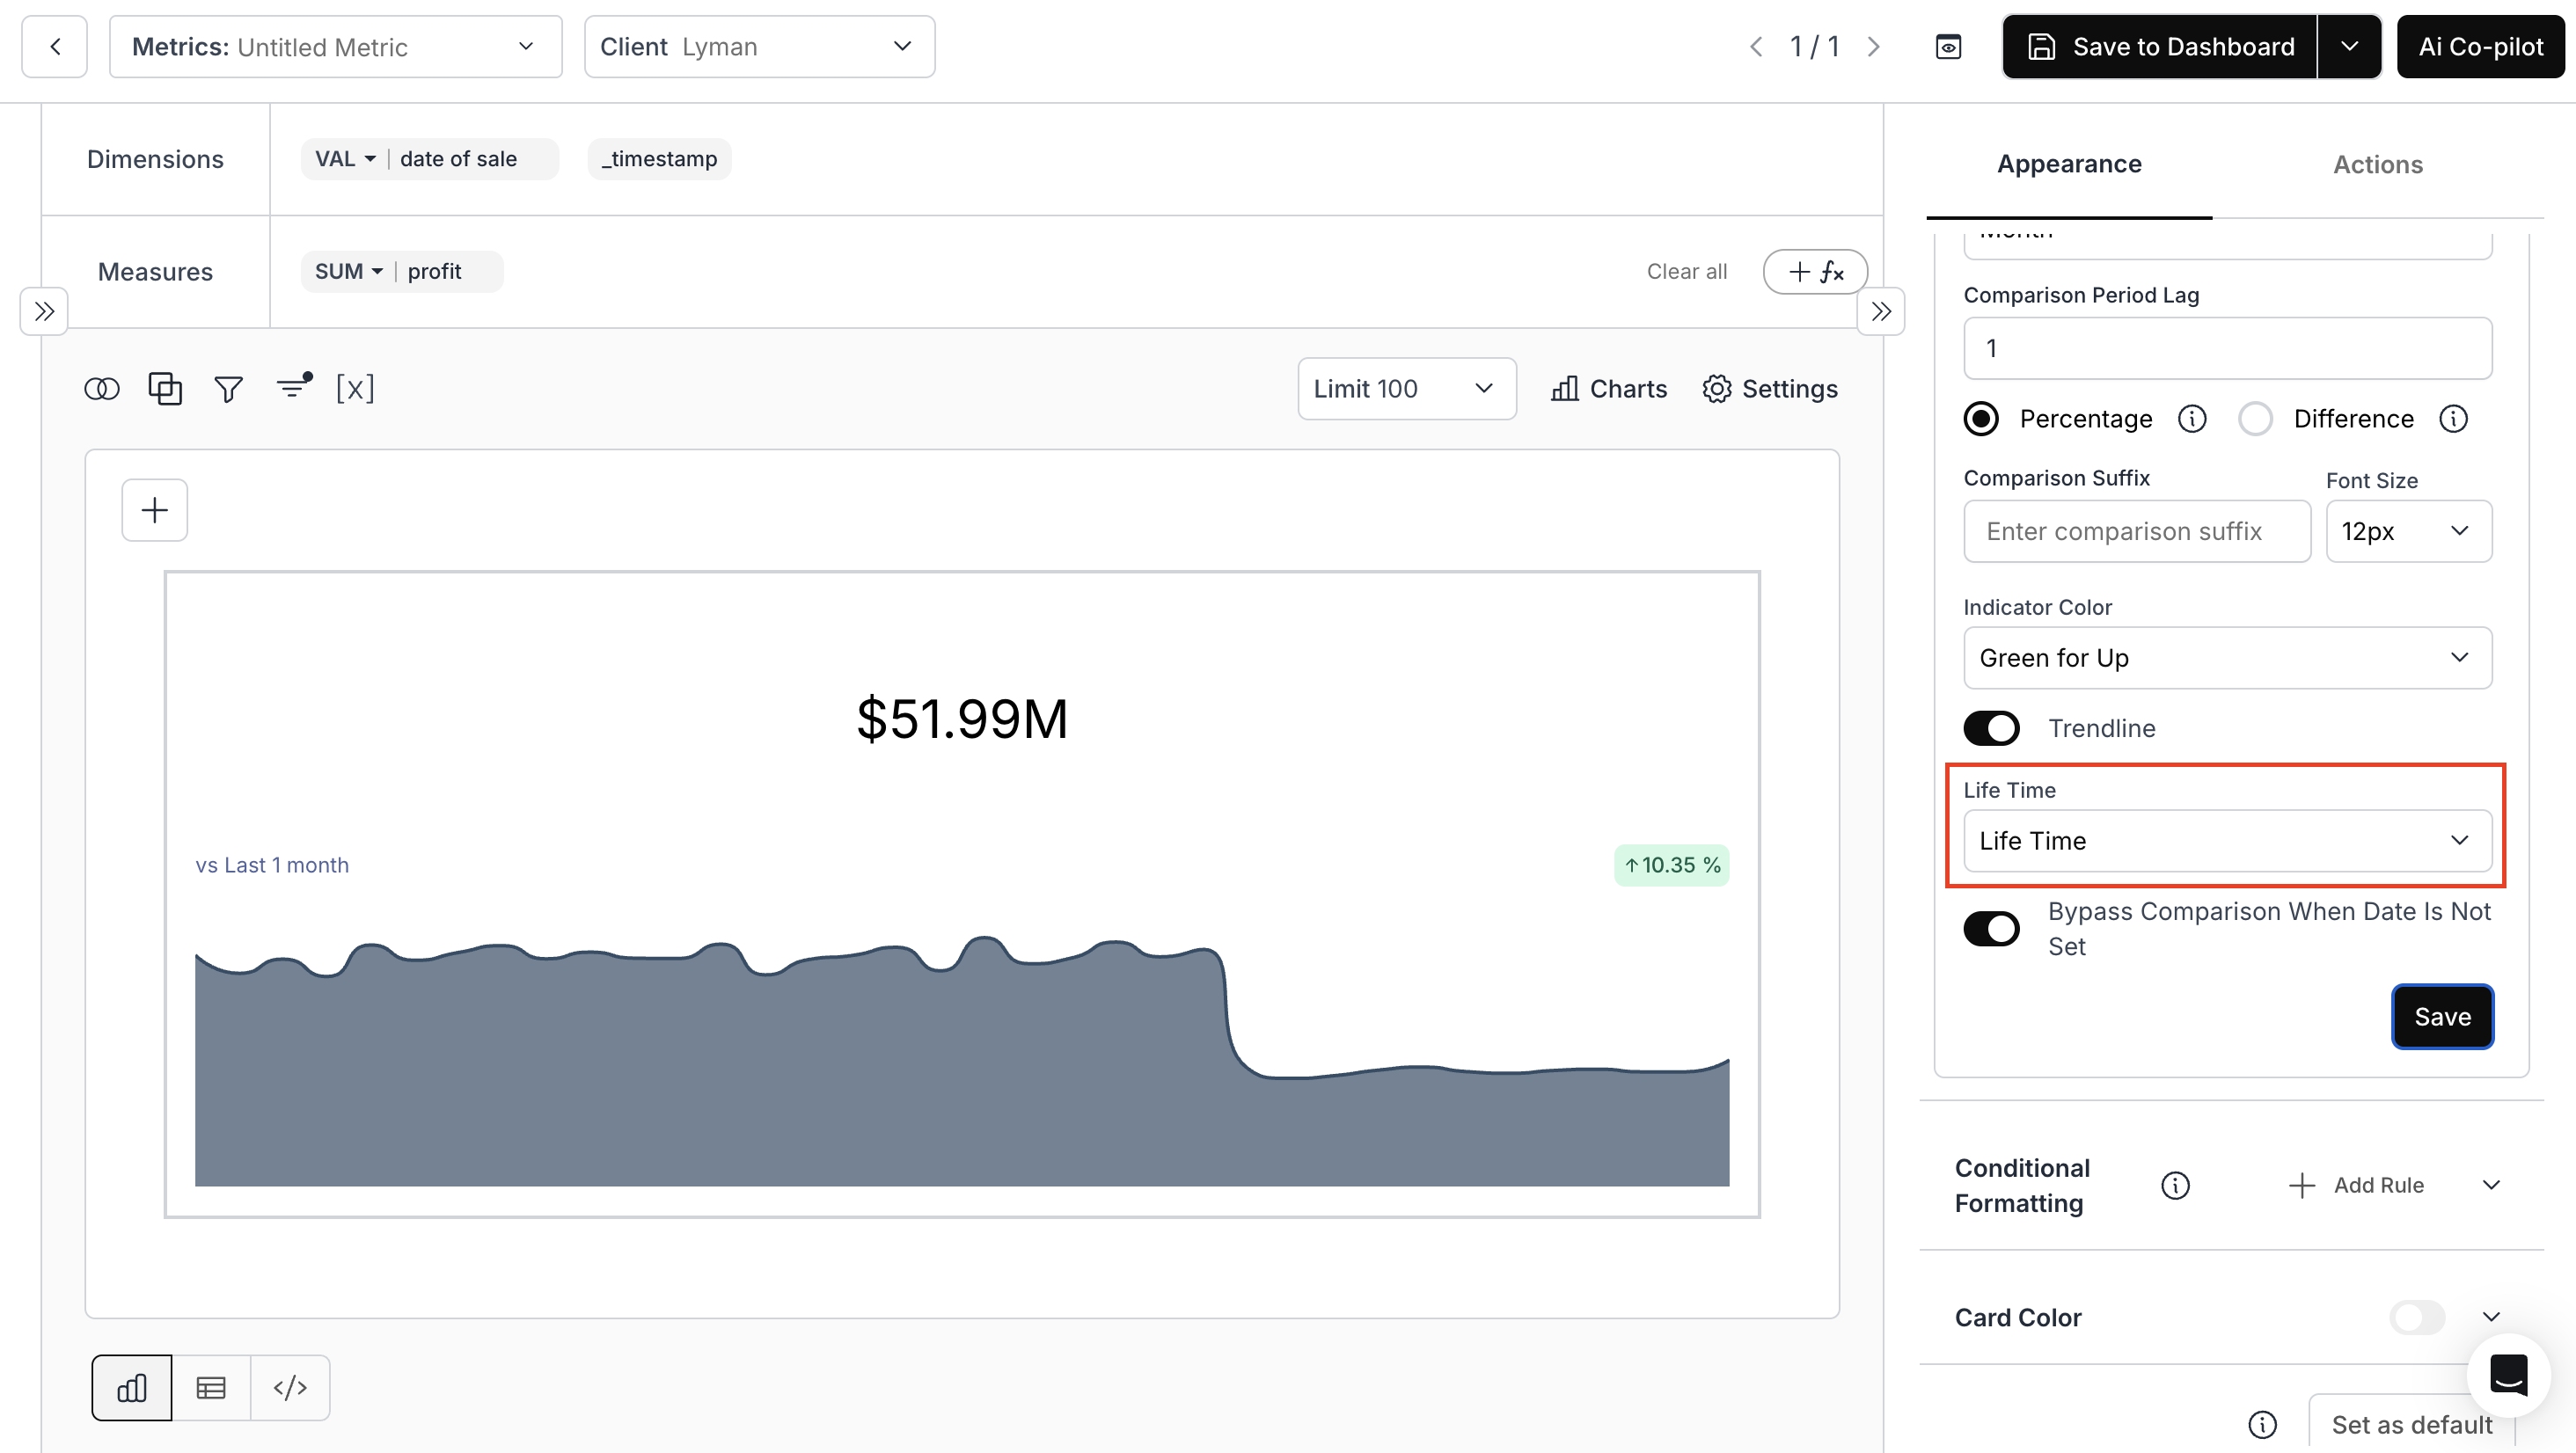
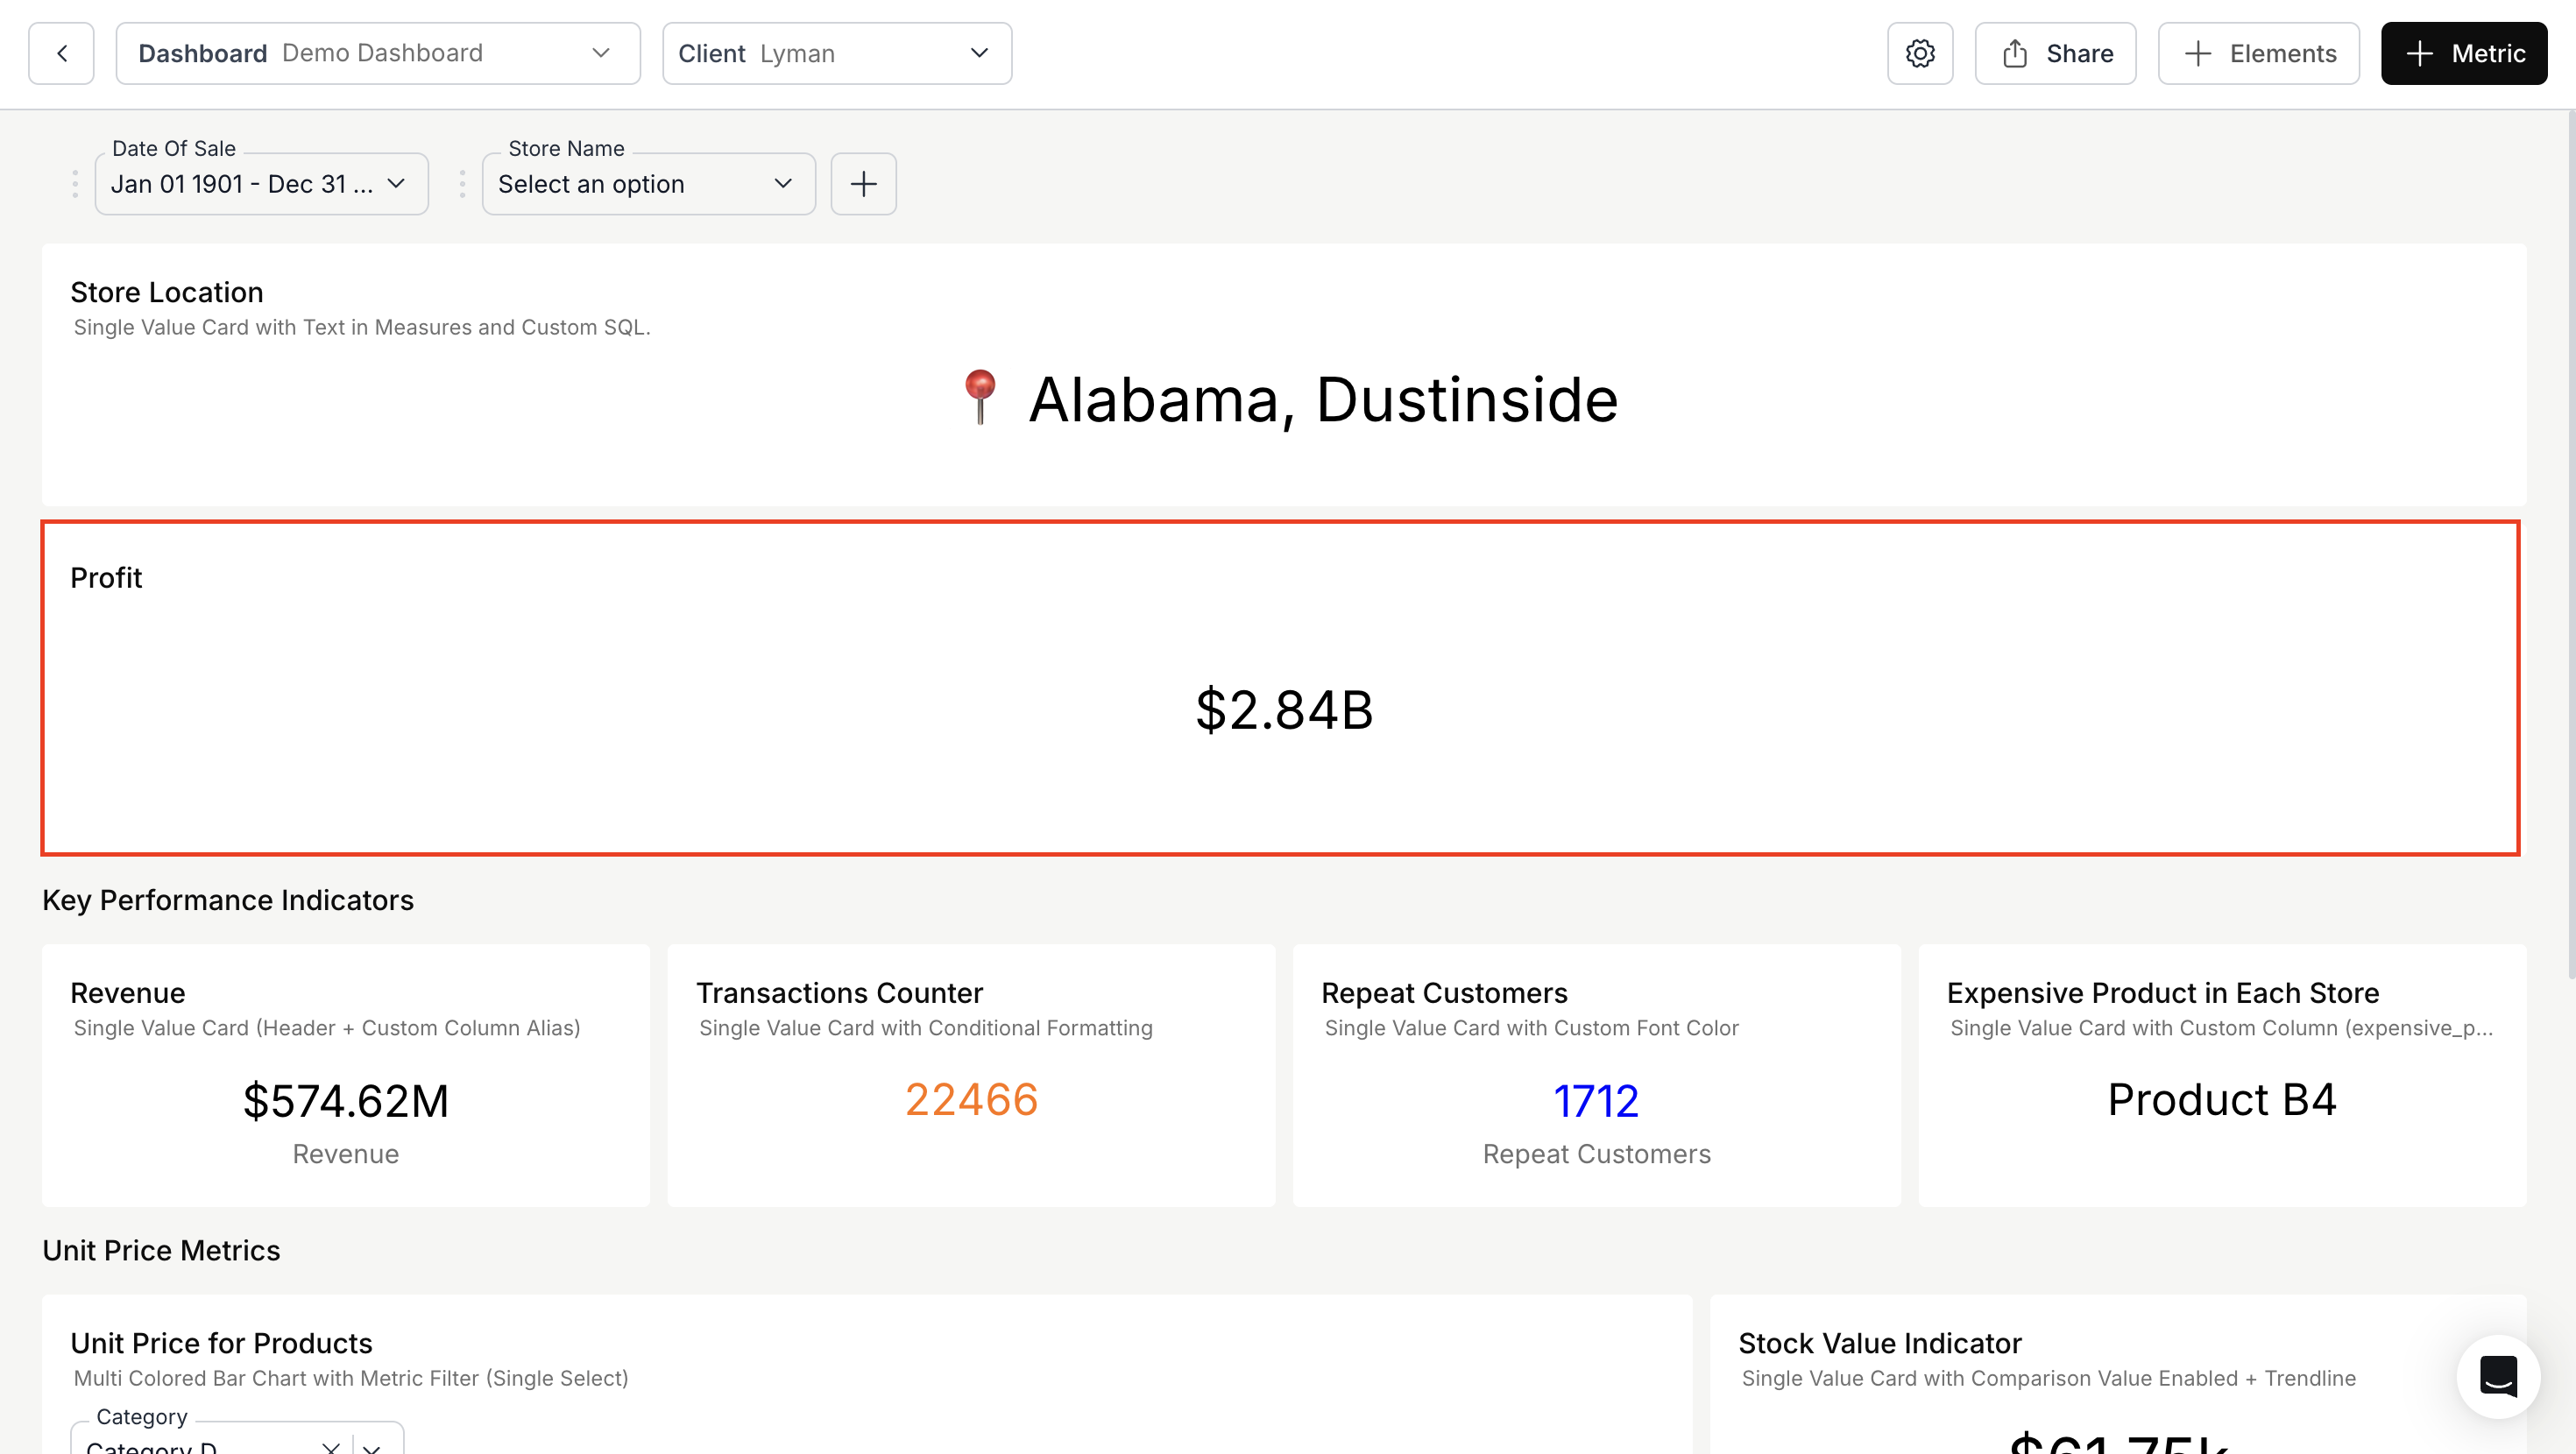
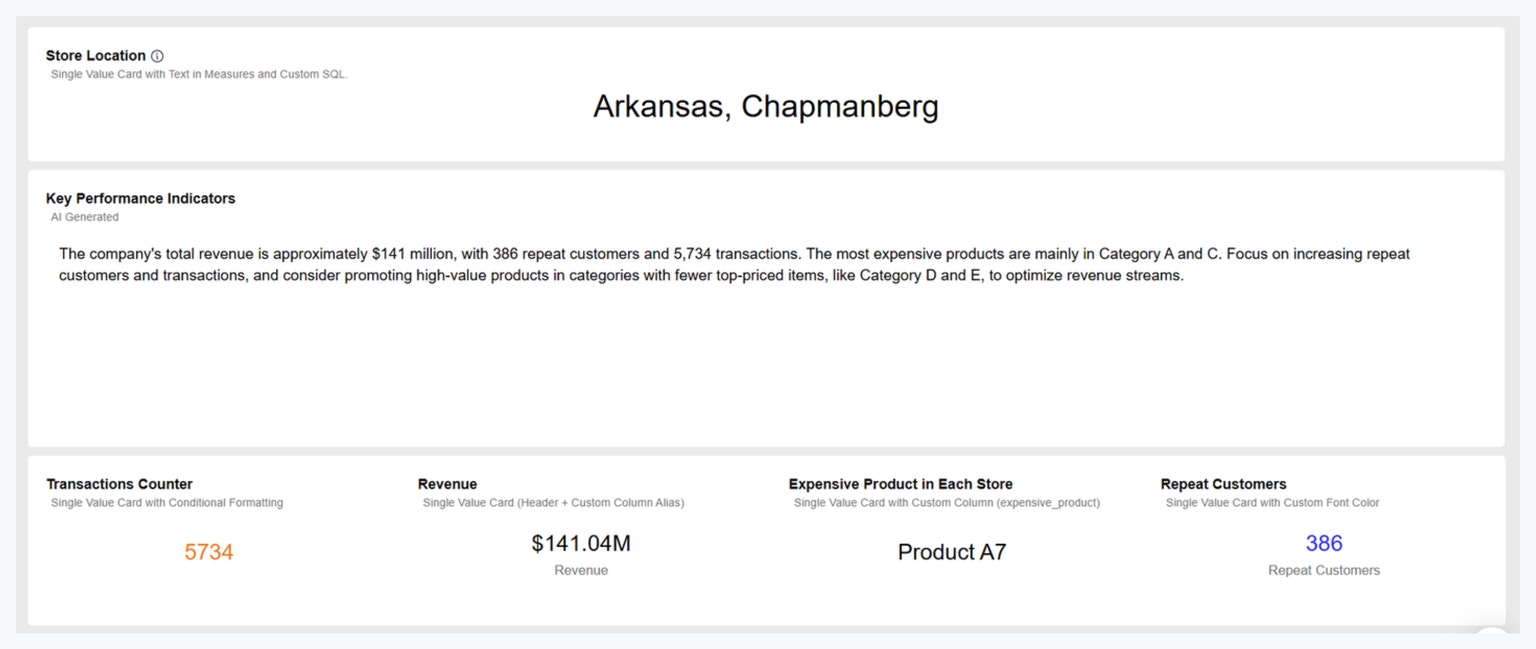
- Lifetime Option in Single Value Card: A new option, Lifetime, has been added to Single Value Cards to perform aggregate calculations without comparisons.
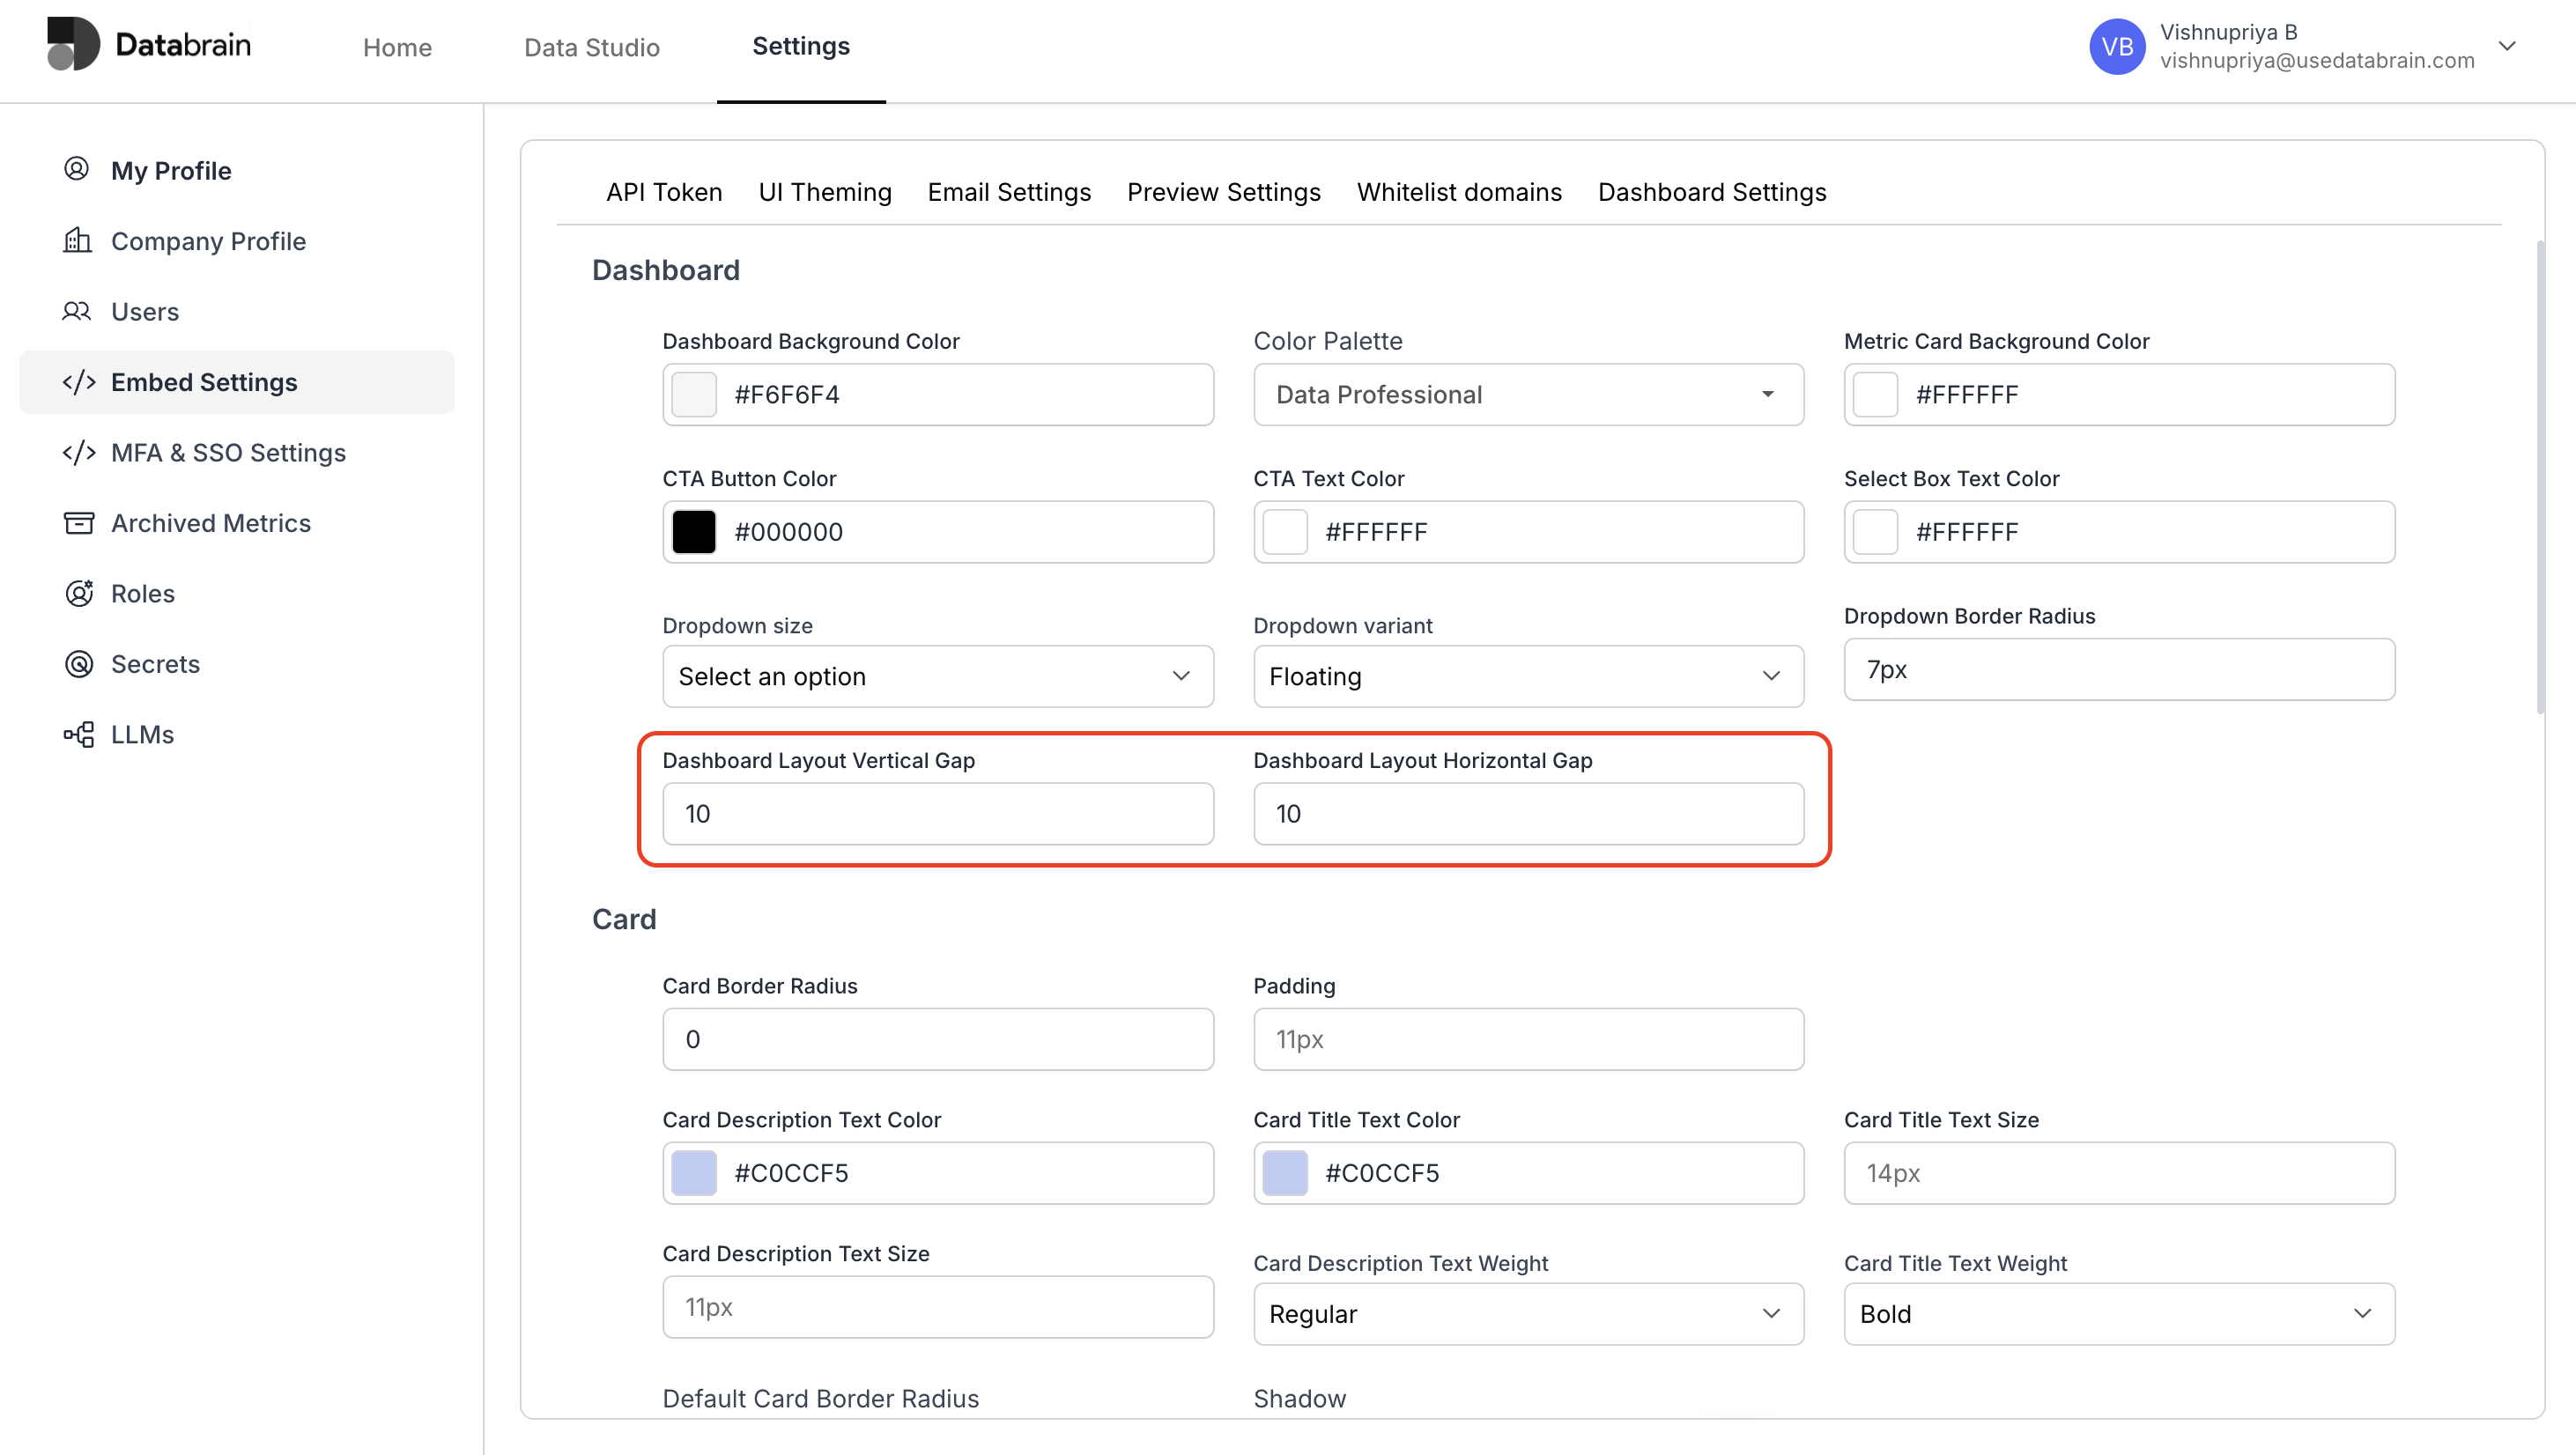
- Customize Dashboard Layout in UI Theming: Users can now configure vertical and horizontal gaps for dashboard layouts in the UI Theming page.
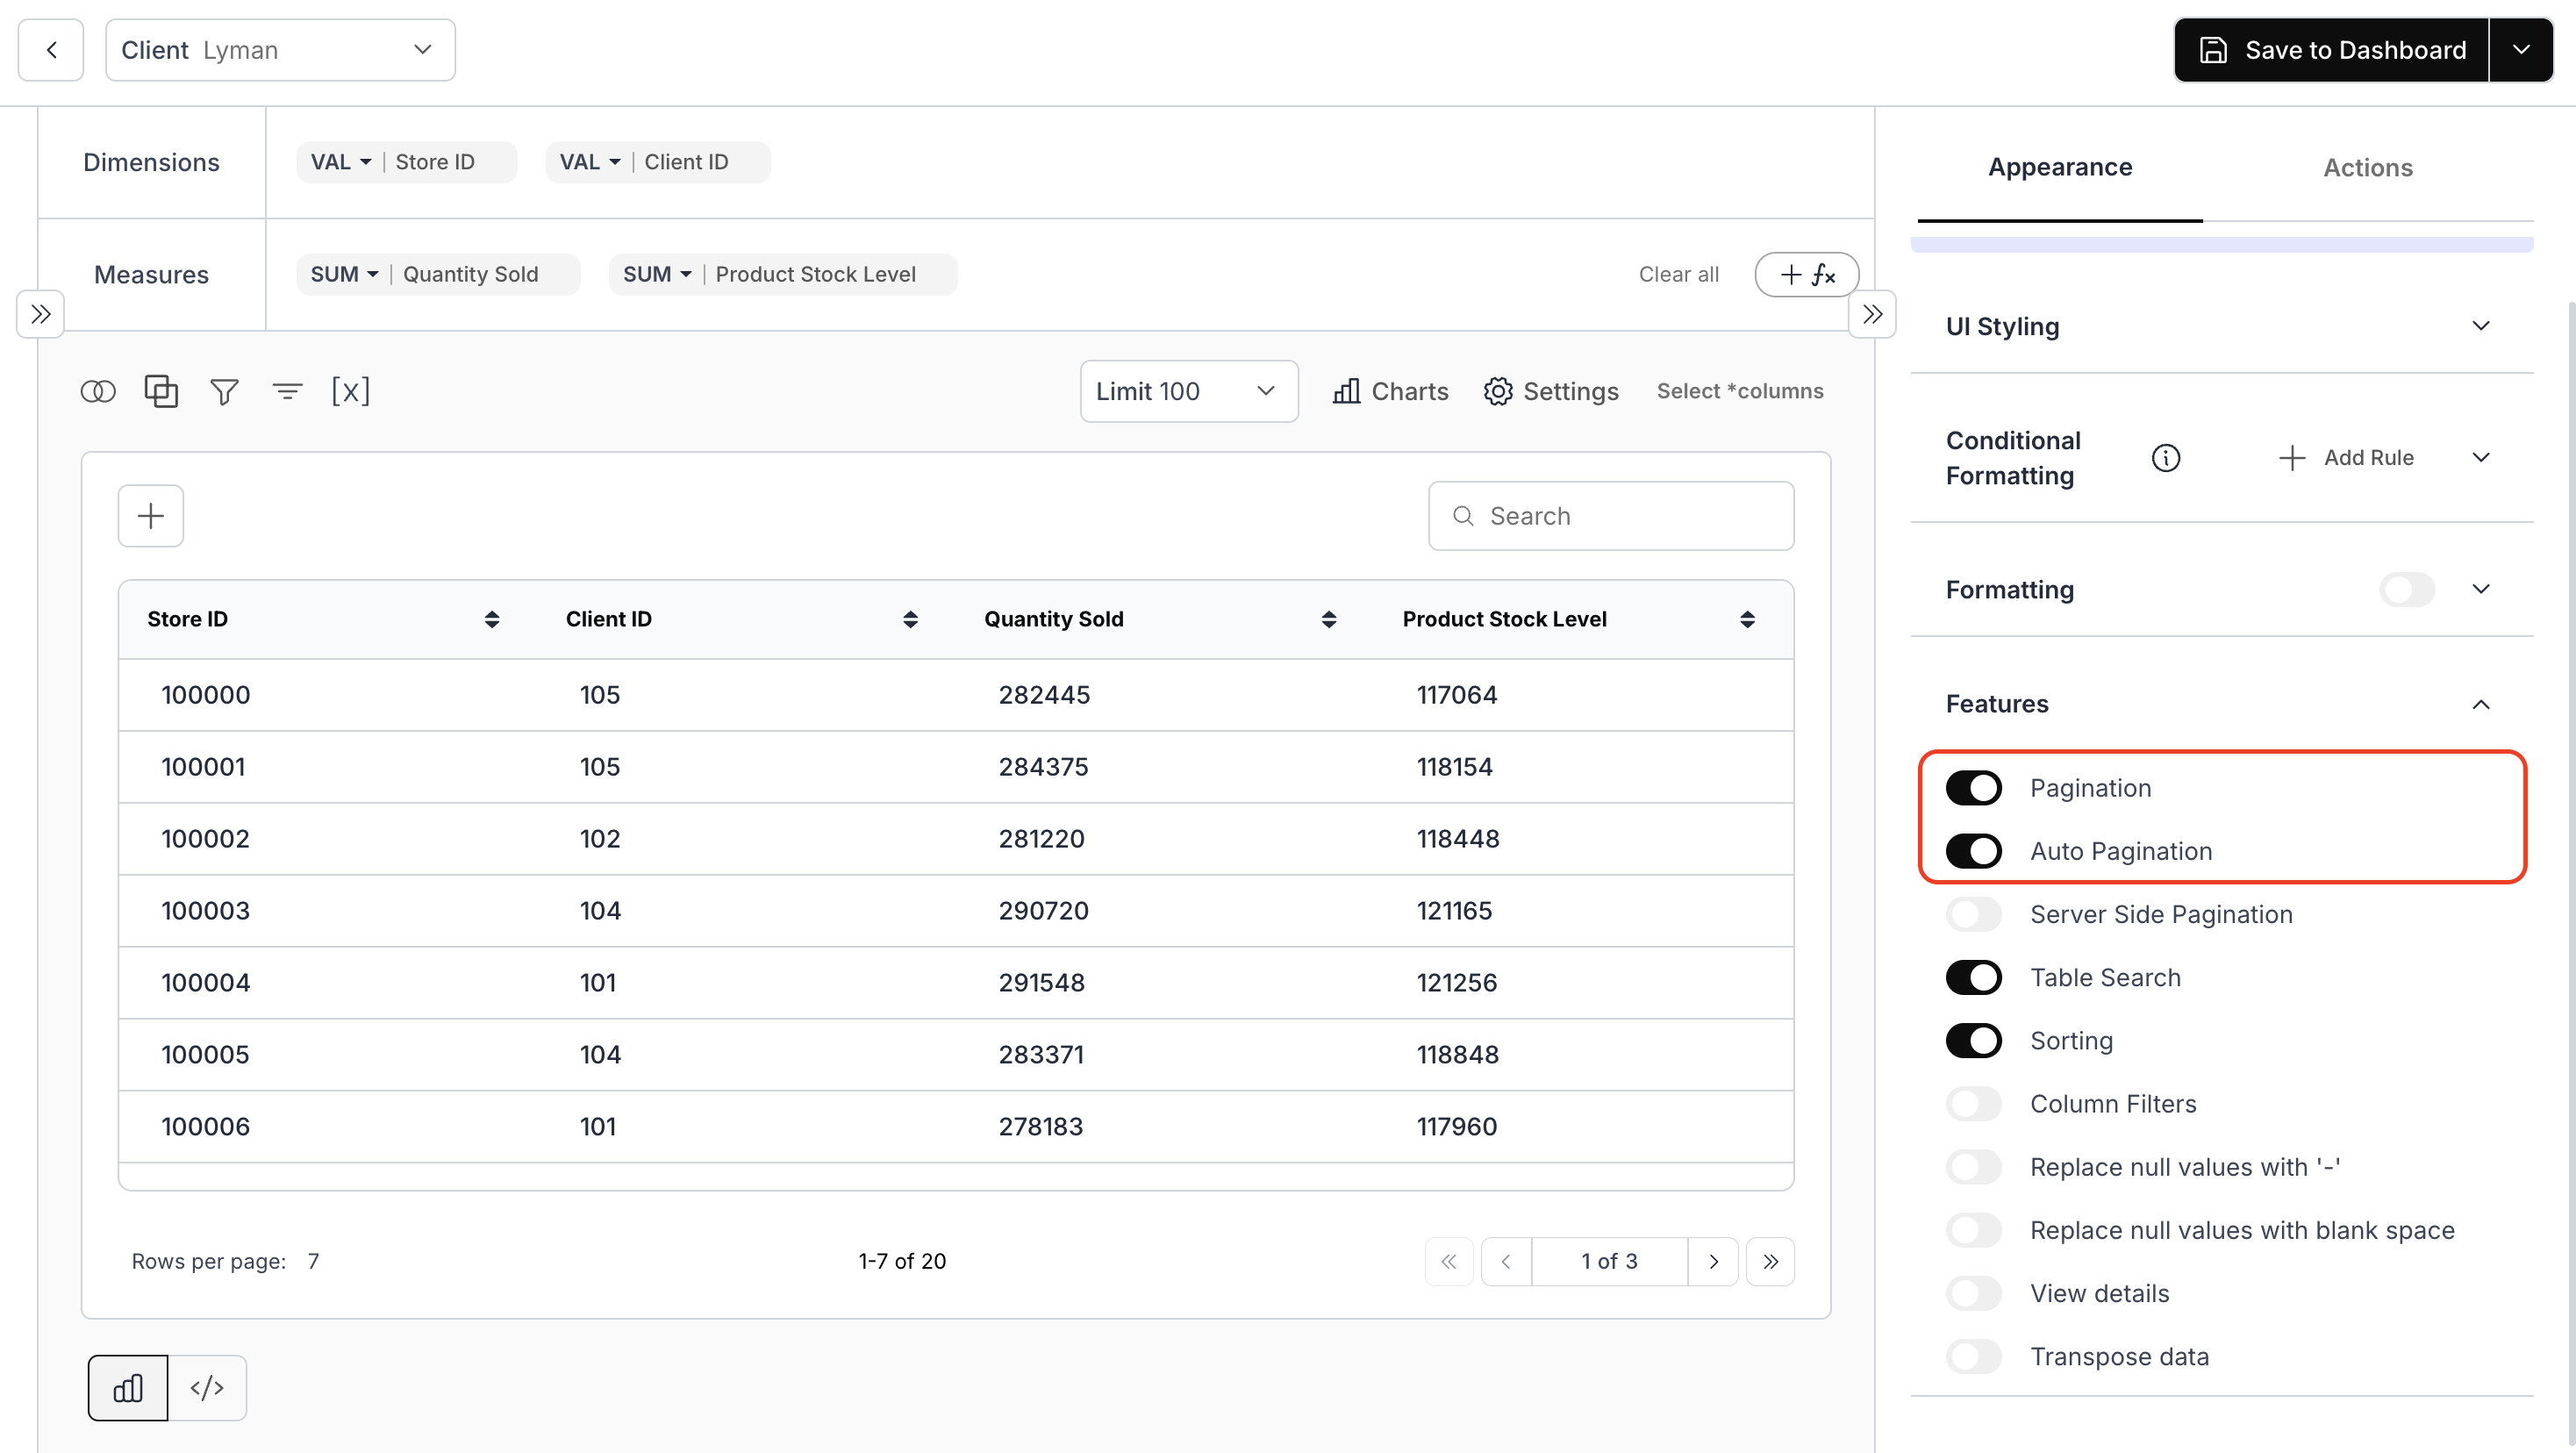
- Height-Based Auto Pagination in Table Charts: Table charts now support automatic pagination based on height, adjusting the number of rows dynamically.
- Prop for Breadcrumb (Drill Down) Color and Font Family: Users can now add color and font family to breadcrumbs when drill down is enabled in embed.
- Prop to Change Badge Color of Multi-Select Filter: Introduced a property for pill color in the multi-select badges in embed.
Fixes:
- Updated Results Table for No Data: The image displayed when a query returns no results in the Query Builder has been updated.
- Drill-Down Issue with Unselected Dimensions: Fixed an issue where an unselected dimension appeared in the drill-down hierarchy.
- Date Filter Font Consistency: Fixed font inconsistencies in date-based metric filters.
August 20, 2025 Update
August 20, 2025 Update
Features:
- Rules Builder: Users can now hide or unhide metrics based on selected charts.
Rules Builder.mp4
Enhancements:
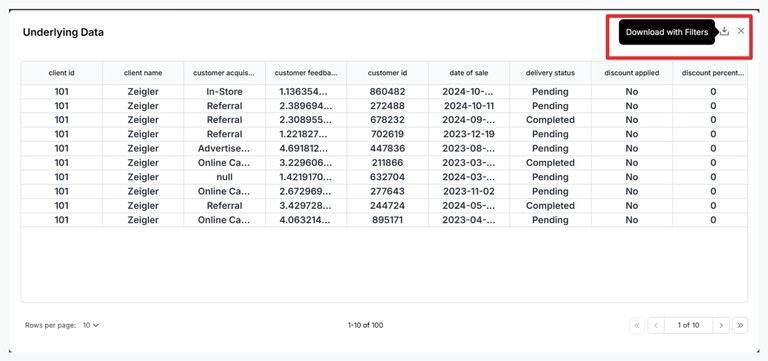
- Download Properties & Full-Screen Mode in Embed Options: Added the ability to download data without applying filters to the underlying data and introduced a full-screen option for an improved user experience.
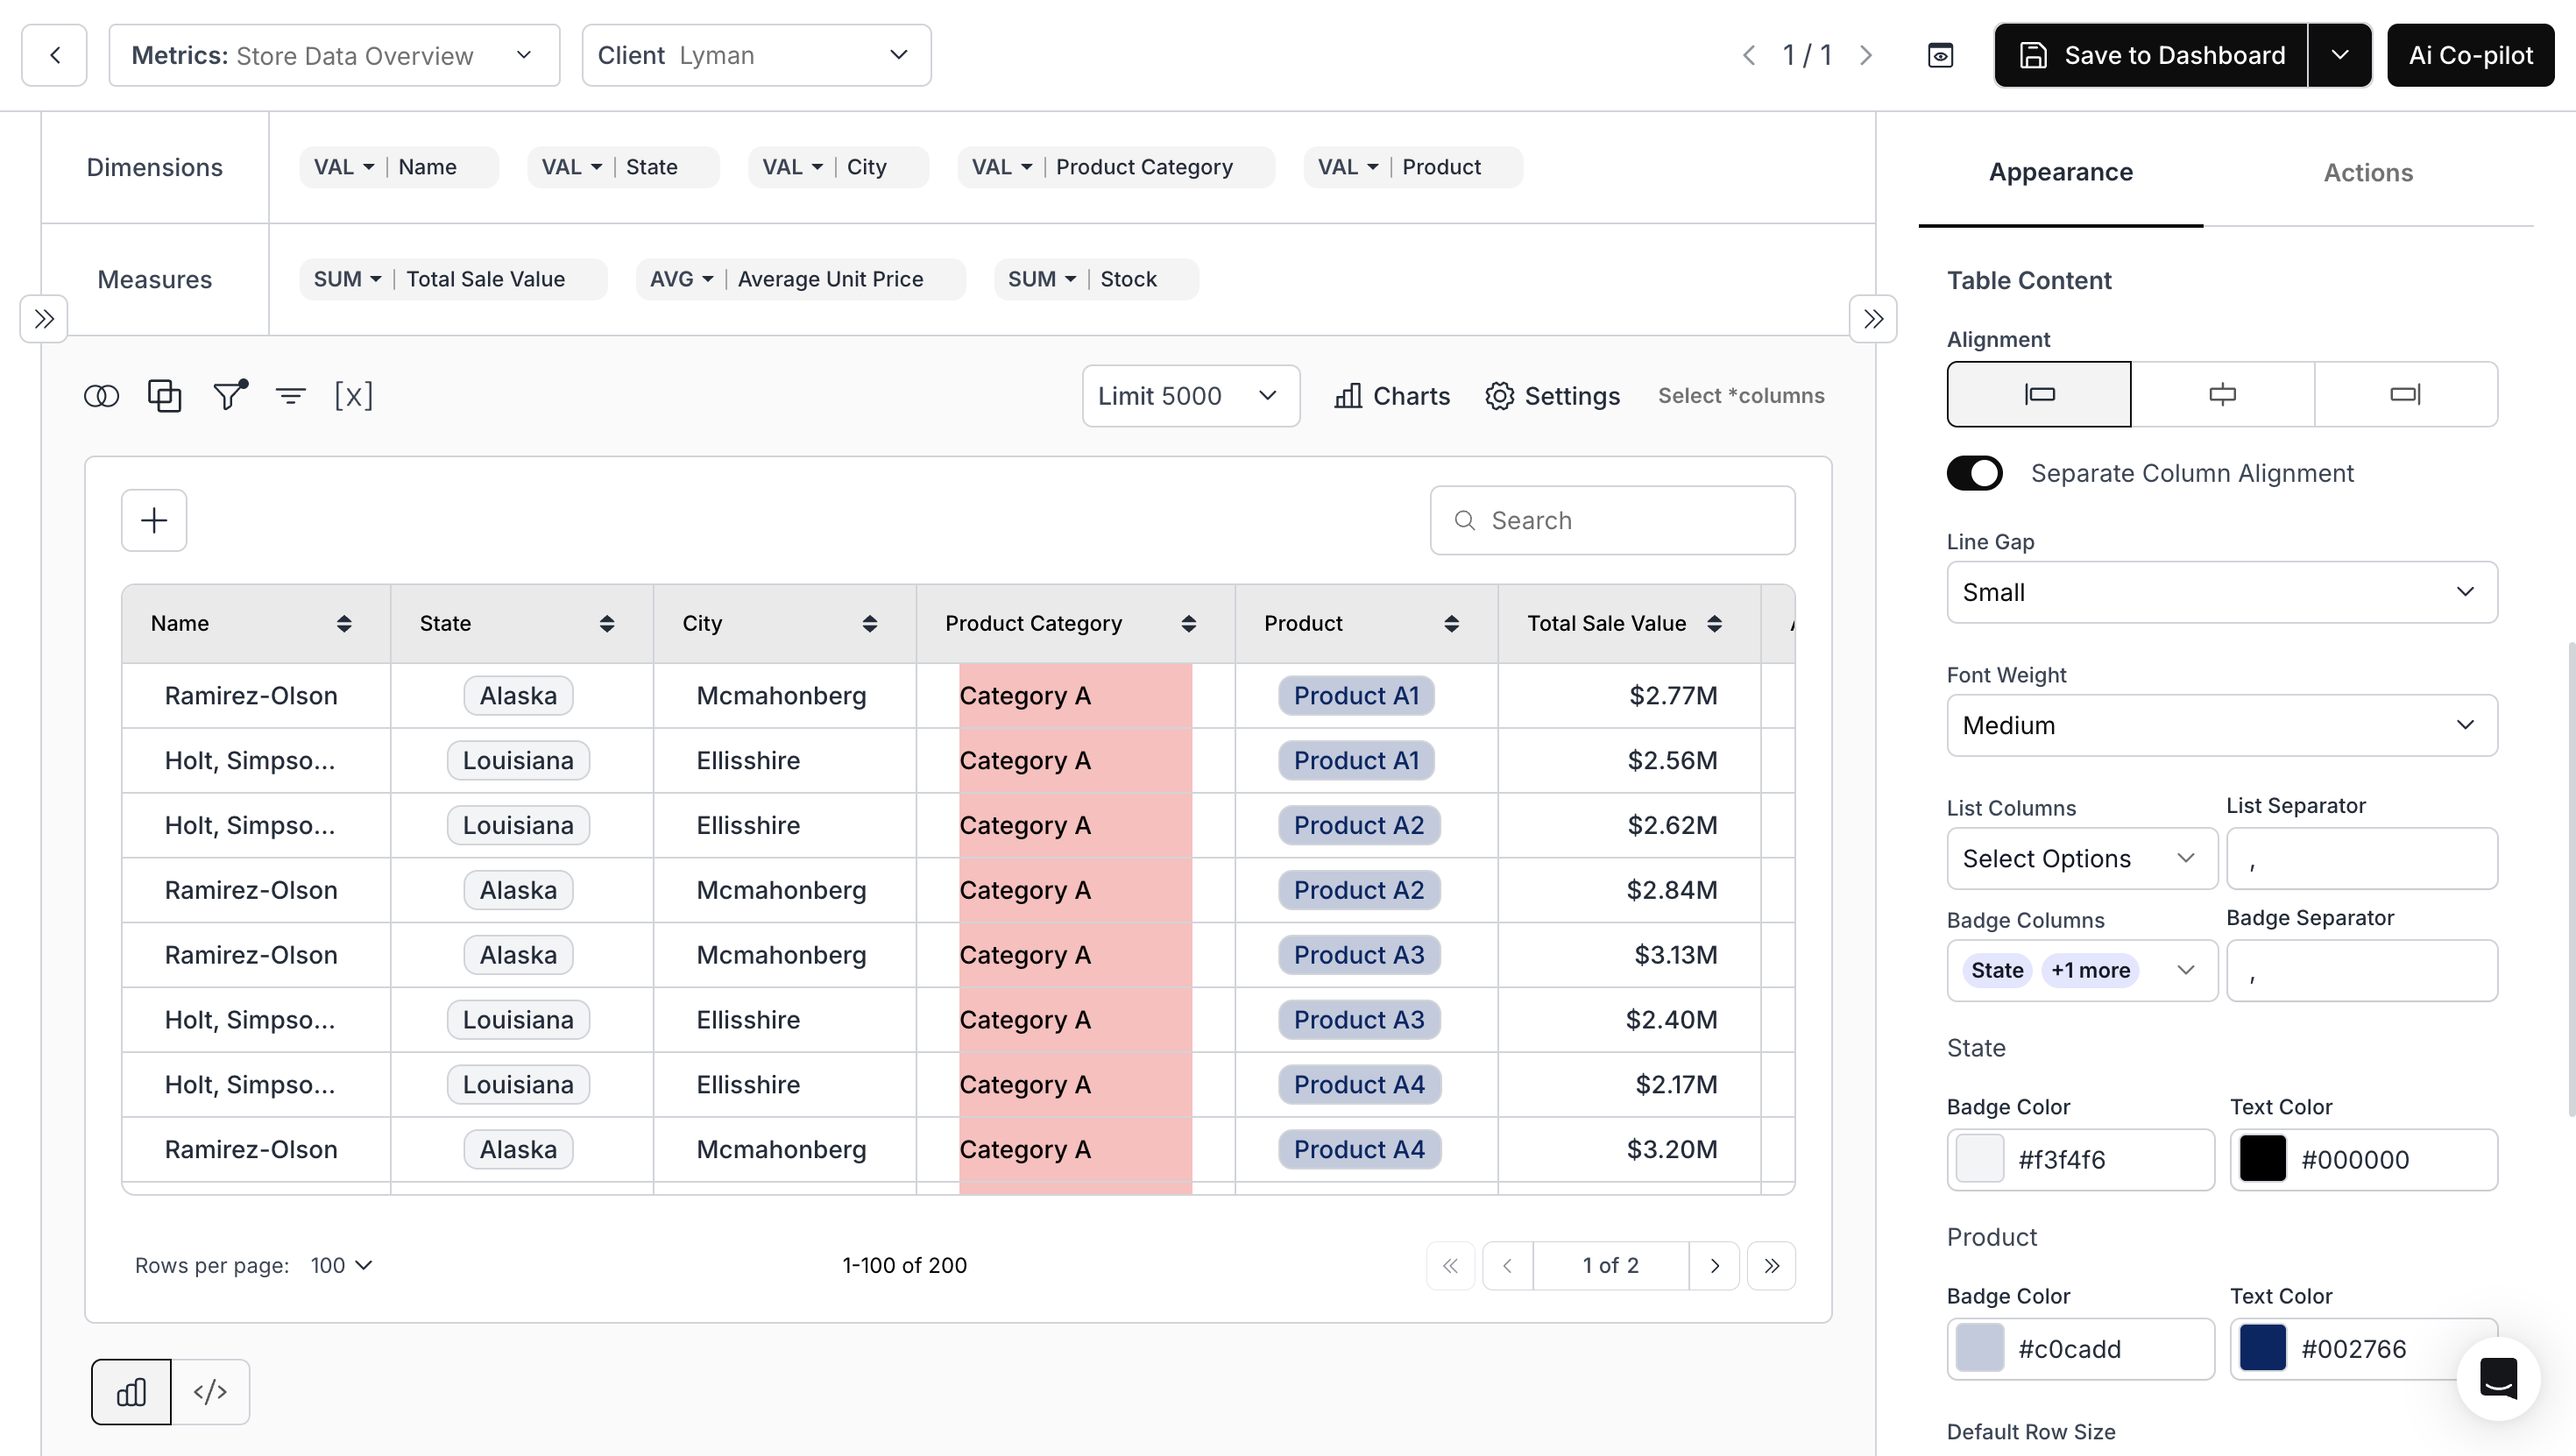
- Separate Alignment for Table Chart Columns: Users can now align table chart columns individually as Left, Center, or Right.
- ‘Next’ Support in Dashboard & Metric Date Filters: Users can now preset future date ranges using the Next option.
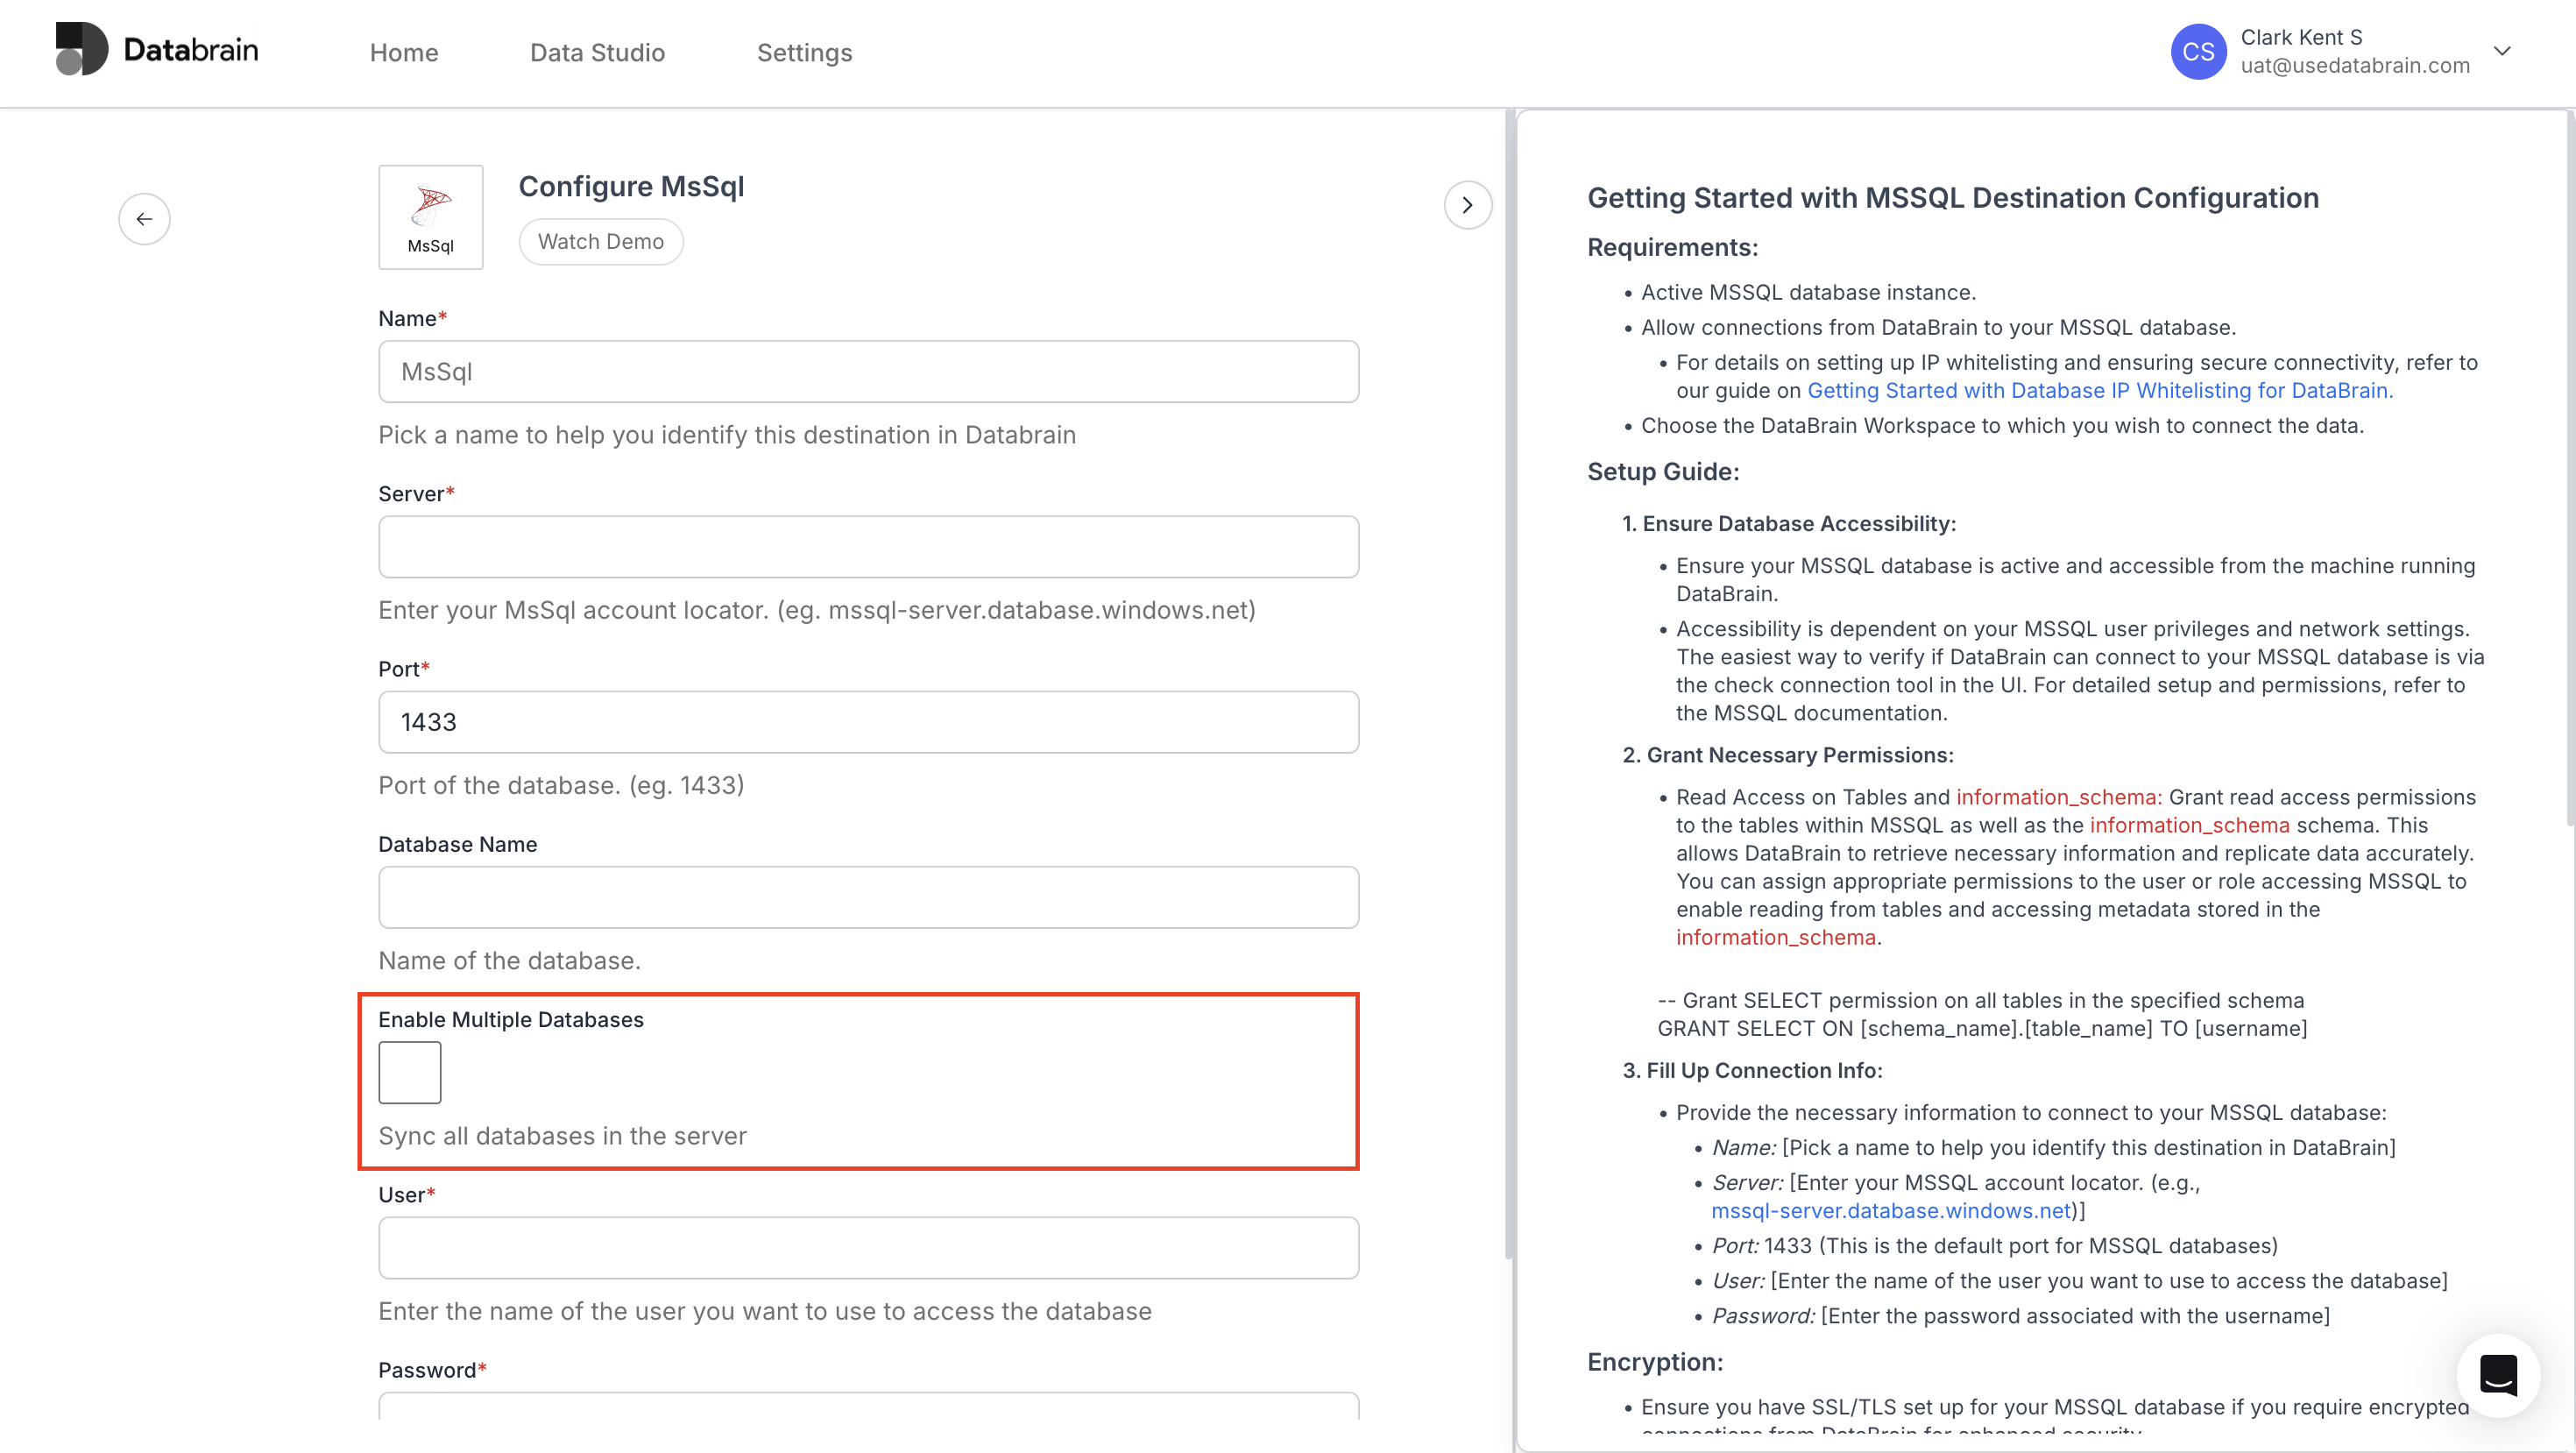
- Multi-Database Support: Added support for multiple databases when configuring data sources.
Fixes:
- Metric Filter Apostrophe Issue: Resolved an issue where multi-select filters with values containing an apostrophe (
') were not working correctly. - Redshift Column Aliases: Fixed an issue where column aliases containing
#caused errors. - Dashboard Filter Defaults: Fixed an issue with the Auto and Manual options in the default value setting of dashboard filters.
August 1, 2025 Update
August 1, 2025 Update
Enhancements:
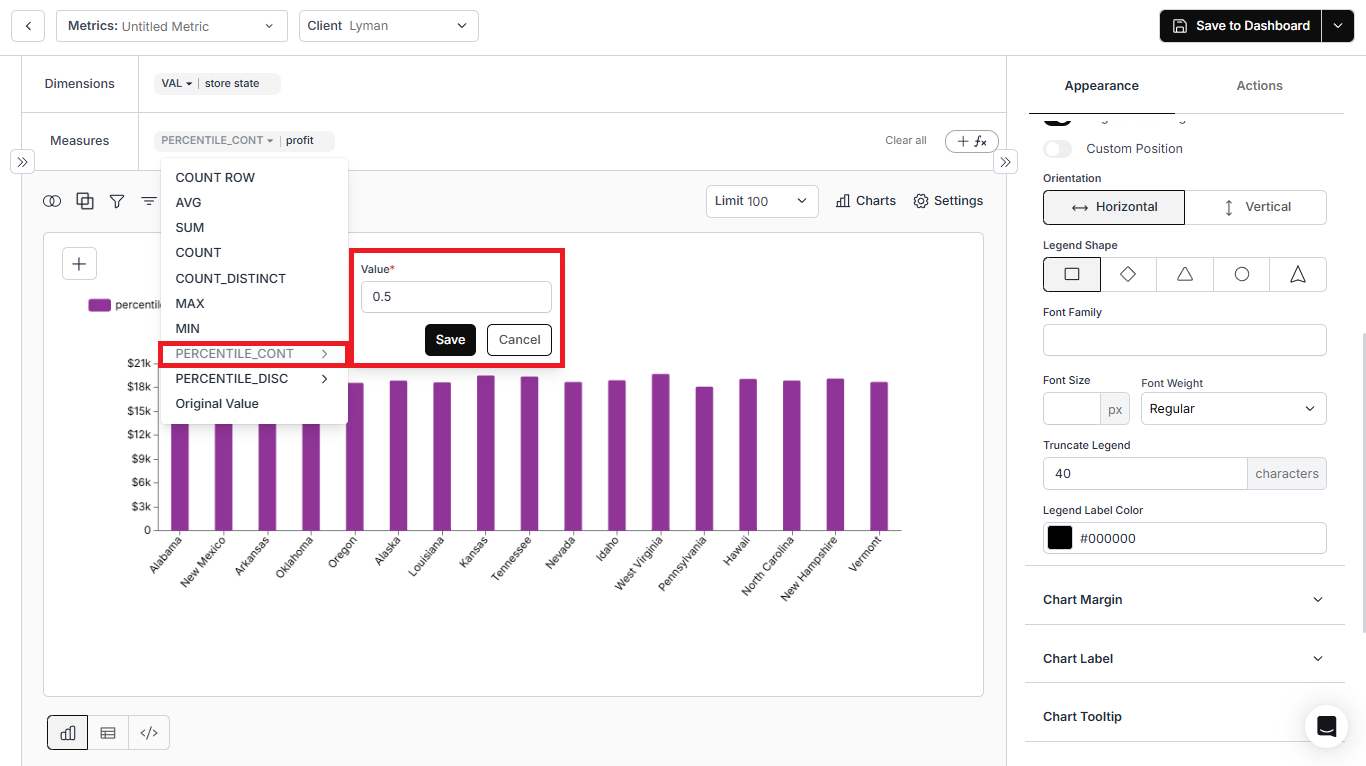
- ‘percentile_cont’ and ‘percentile_disc’ Functions for Measures: You can now calculate continuous and discrete percentiles using these new functions.
- Download Dashboard as PDF: Users can now download dashboards in PDF format.
- Dropdown Multi-select Filter for String Columns in Table Chart: A dropdown multi-select filter can now be added to any string column in a table chart.
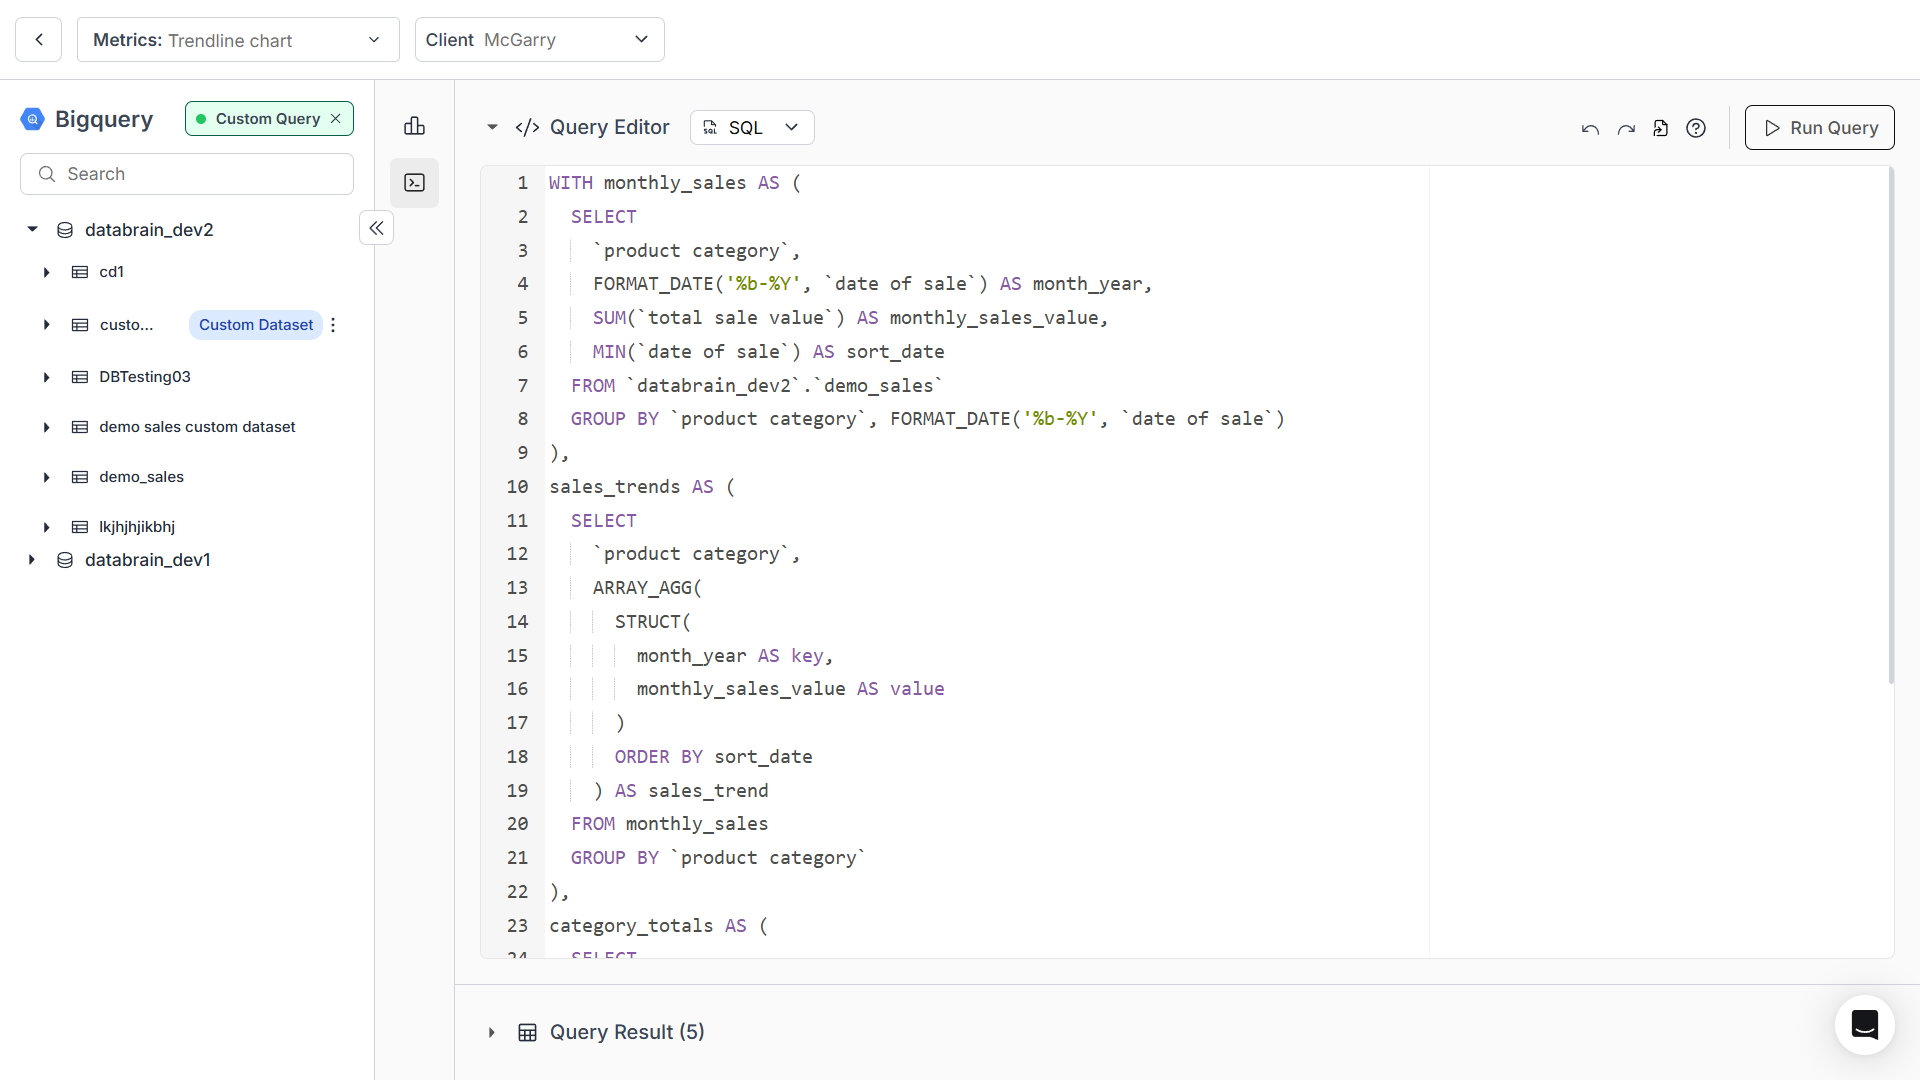
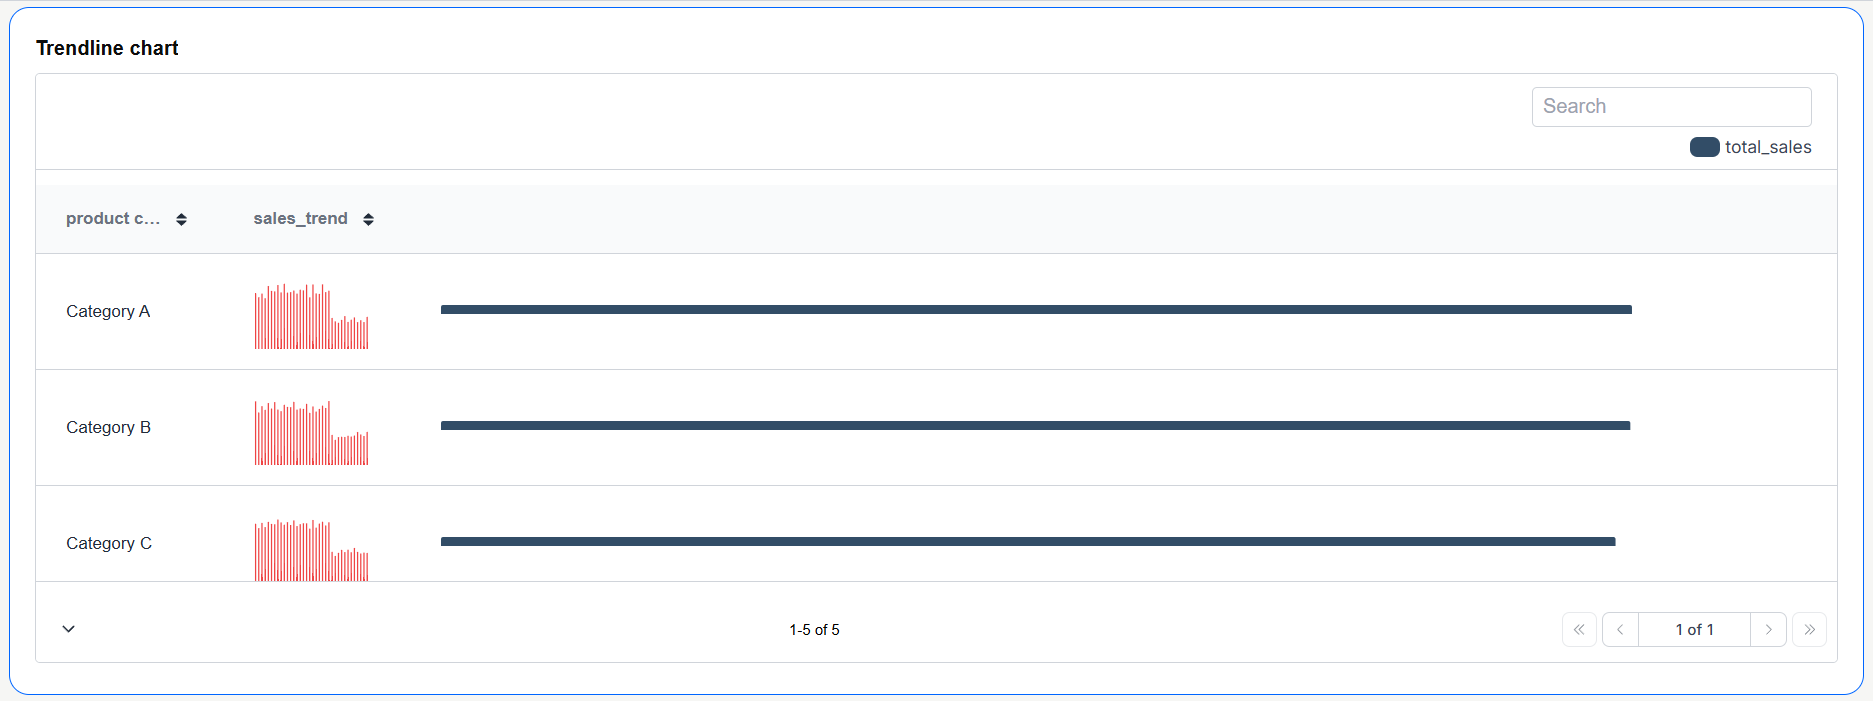
- Trendline Support: We have introduced trendline functionality in table charts using custom SQL.
Fixes:
- Default option for LLMs: You can now set any LLM as the default option.
- Metric Filter Styling Issue: Fixed font and font size inconsistencies in date-type metric filters.
- Underlying Data Download in OpenSearch: Resolved issues related to downloading underlying data in OpenSearch.
July 17, 2025 Update
July 17, 2025 Update
Features:
- API Endpoint for Datamart: Users can now perform CRUD operations on datamarts using the API endpoint.
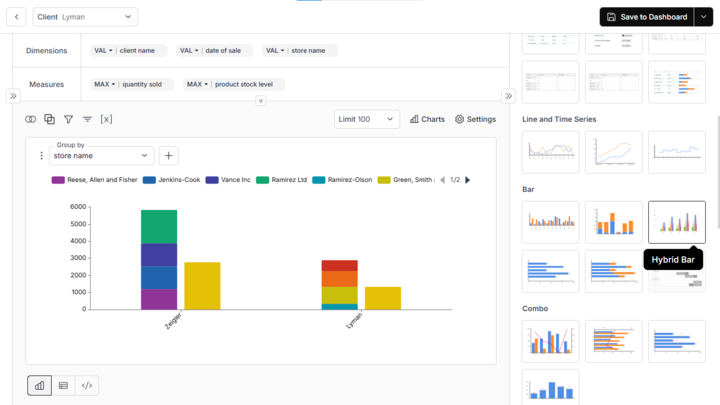
- Hybrid (Stacked + Bar) Chart: A new chart type, Hybrid Bar, has been introduced.
Enhancements:
- Metric Filter Interaction: Improved workflow for switching between ‘Apply On’ and ‘Filter Options’ in Metric Filters for smoother navigation.
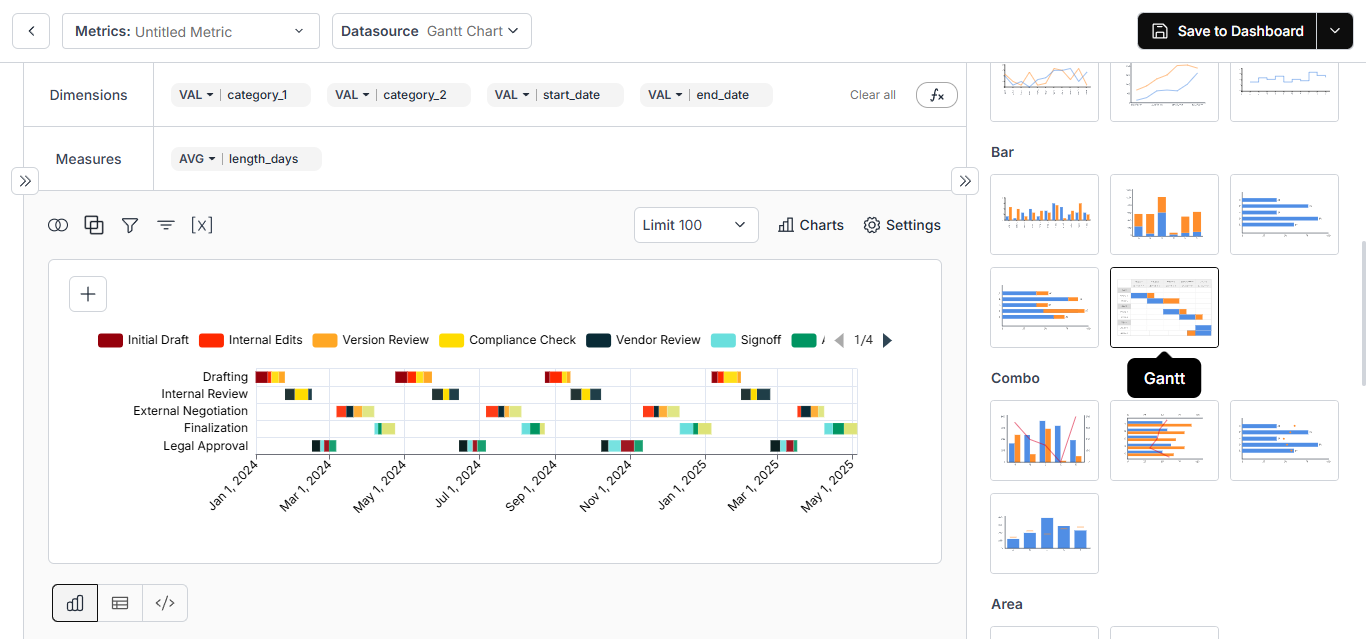
- Gantt Chart Styling: Added bar styling options for Gantt Chart, including Bar Height, Top Radius, and Bottom Radius.
Fixes:
- Hide App Filter in Filter Box: The App Filter is now hidden in the dashboard filter box to enhance security and ensure proper functionality.
- Elastic Search: Fixed an issue that occurred when creating custom datasets.
July 10, 2025 Update
July 10, 2025 Update
Features:
- Gantt Chart: Introducing the Gantt Chart for enhanced timeline-based visualization of tasks and projects.
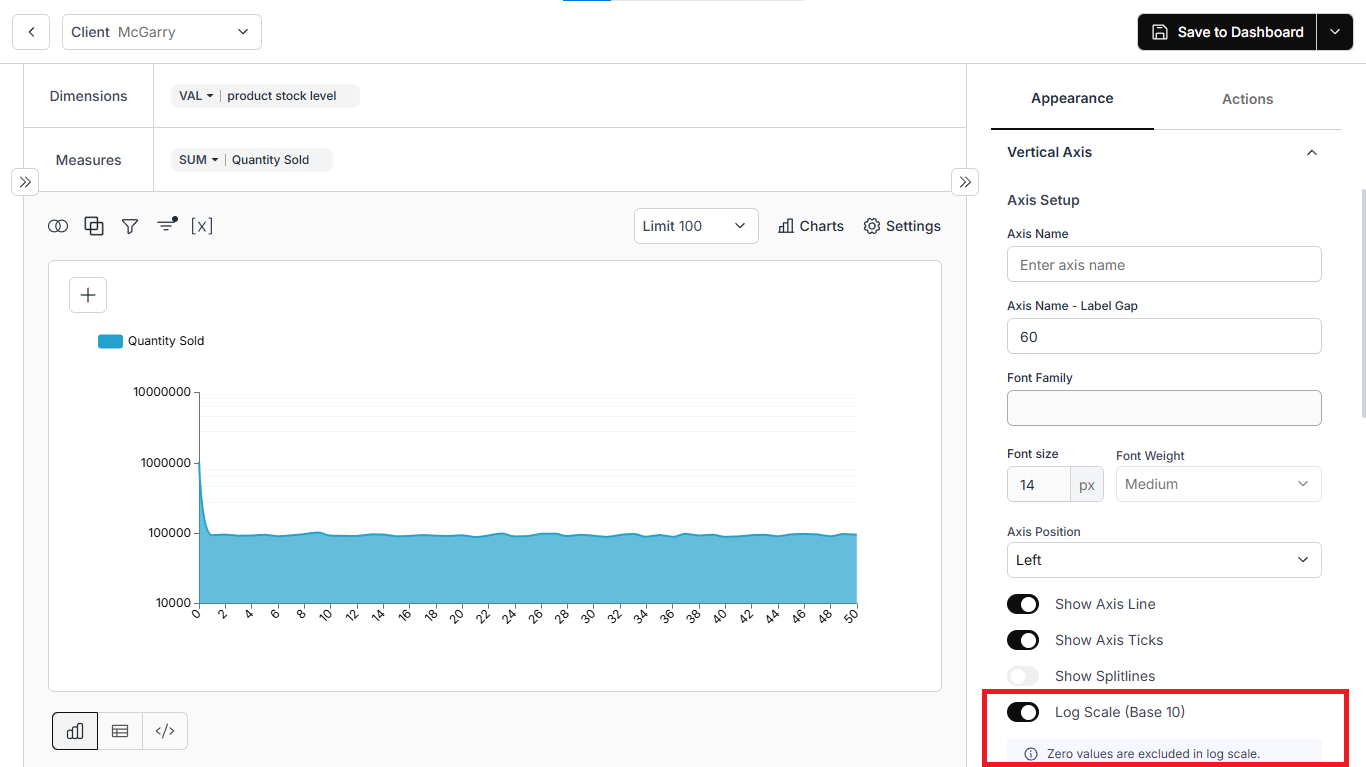
- Y Axis - Log Scale: Added the ability to convert the Y-axis to a logarithmic scale for improved visualization of wide-ranging values.
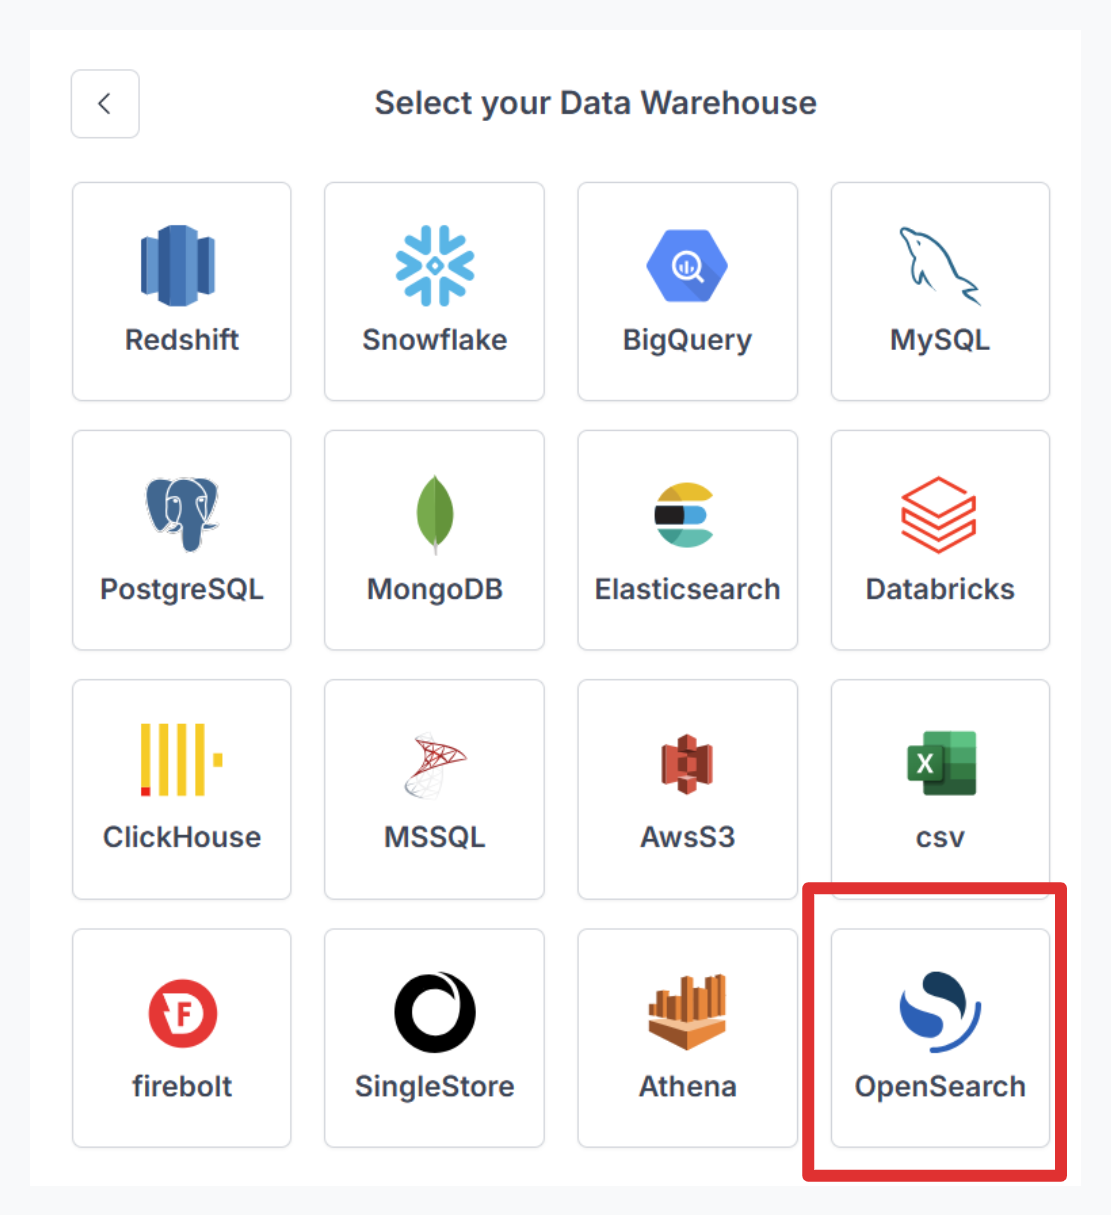
- New Data Source - OpenSearch: Now supporting OpenSearch as a data source, expanding your integration options.
- Optional Variable Filters: Variable filters can now be made optional using square brackets in code blocks for greater flexibility.
Optional Variable Filter.mp4
- Click Action on Single Value Card: Enable interactive experiences by configuring click actions on Single Value Cards.
Enhancements:
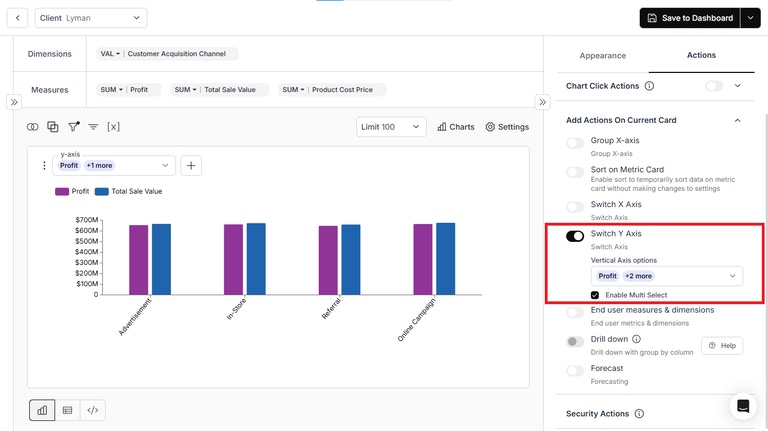
- Multi-Select Y-Axis: You can now enable multi-selection for the Y-axis in bar, line, and area charts.
- Underlying Data Download: Added support to download filtered underlying data for deeper offline analysis.
- Badge Color in Table Chart: Introduced the ability to set badge colors in table chart conditional formatting.
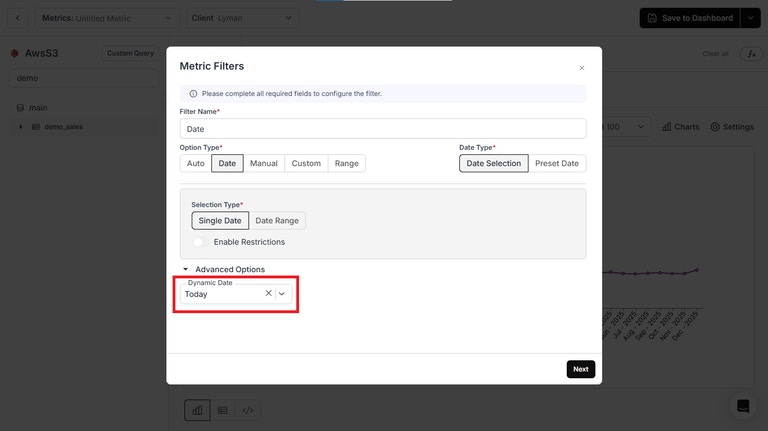
- Default Dynamic Dates in Filters: Set default values like Today, Tomorrow, and Yesterday in single-date filters.
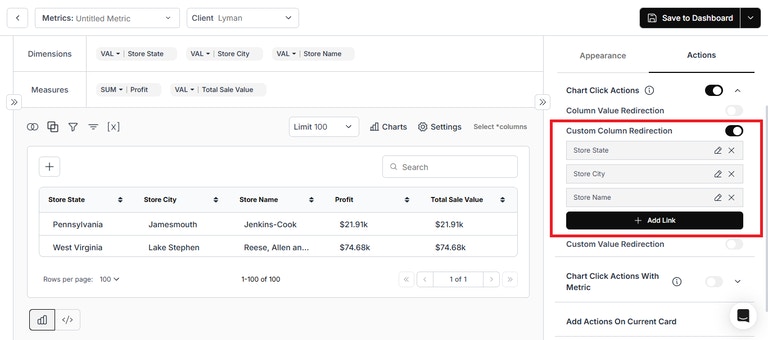
- Multi-Column Click Actions in Table Charts: Configure click actions for multiple columns in table charts.
Fixes:
- Switch Select Default Value: Resolved inconsistencies in Switch Select options by setting a default value.
- Dynamic Properties in Descriptive Elements: Fixed loading issues in dynamic properties across footnote, title, description, and long description.
- Athena Load Time Disparity: Addressed inconsistencies in load time between Query Editor and Chart Builder for Athena data source.
- Dashboard Filter: Ad the ability to clear default values in dashboard filters.
- Scheduled Reports: Fixed formatting issues in PDF exports for scheduled reports.
June 9, 2025 Update
June 9, 2025 Update
Enhancements:
- Drill Down Revamp: We’ve updated the UI of Drill Down Feature to ensure better clarity and visibility.
Drill Down_Revamp.mp4
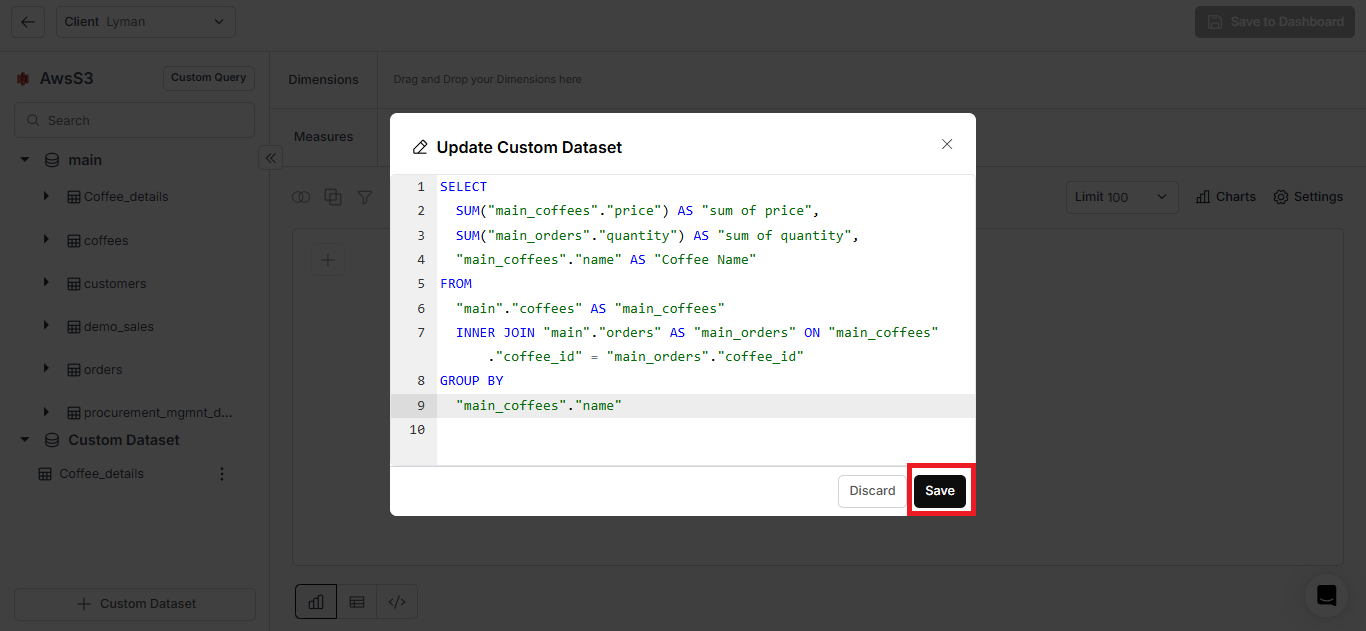
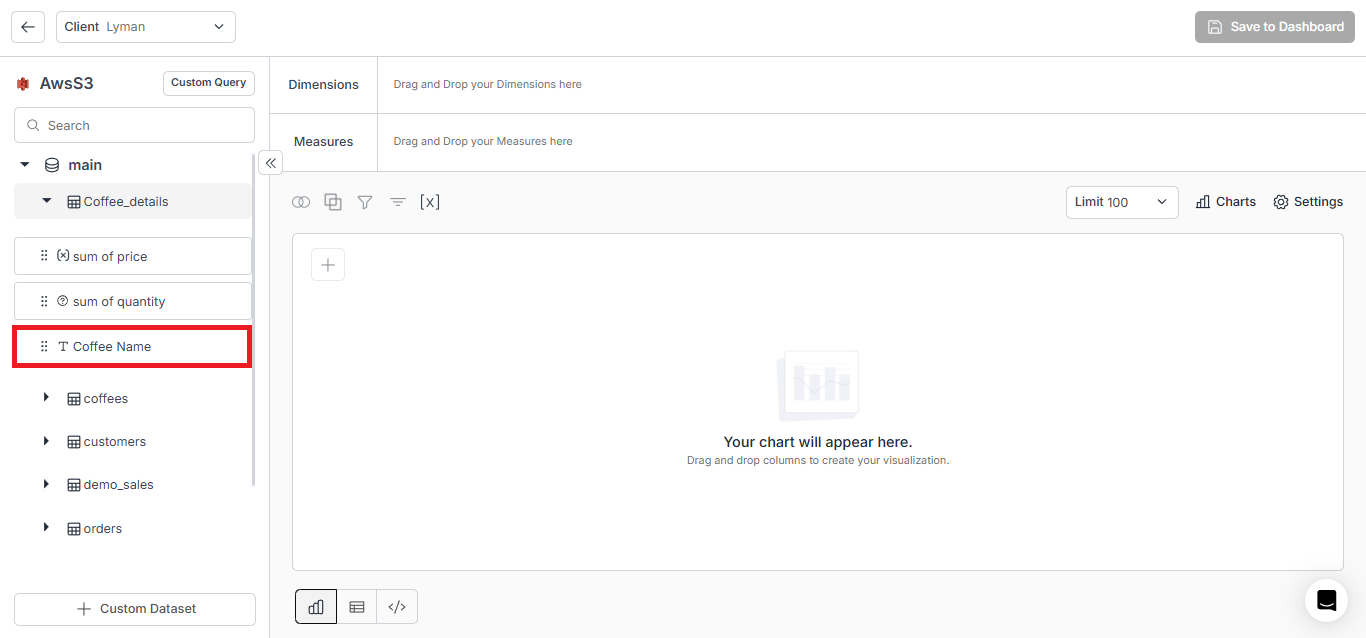
- Custom SQL Revamp: We’ve enhanced the Custom SQL interface to offer a cleaner editing experience and improved validation feedback for better query building. Users can write custom SQL queries and save them as Table Chart, Table Chart with Dynamic Table, New Chart or Custom Dataset.
SQL Rvamp 2.0.mp4
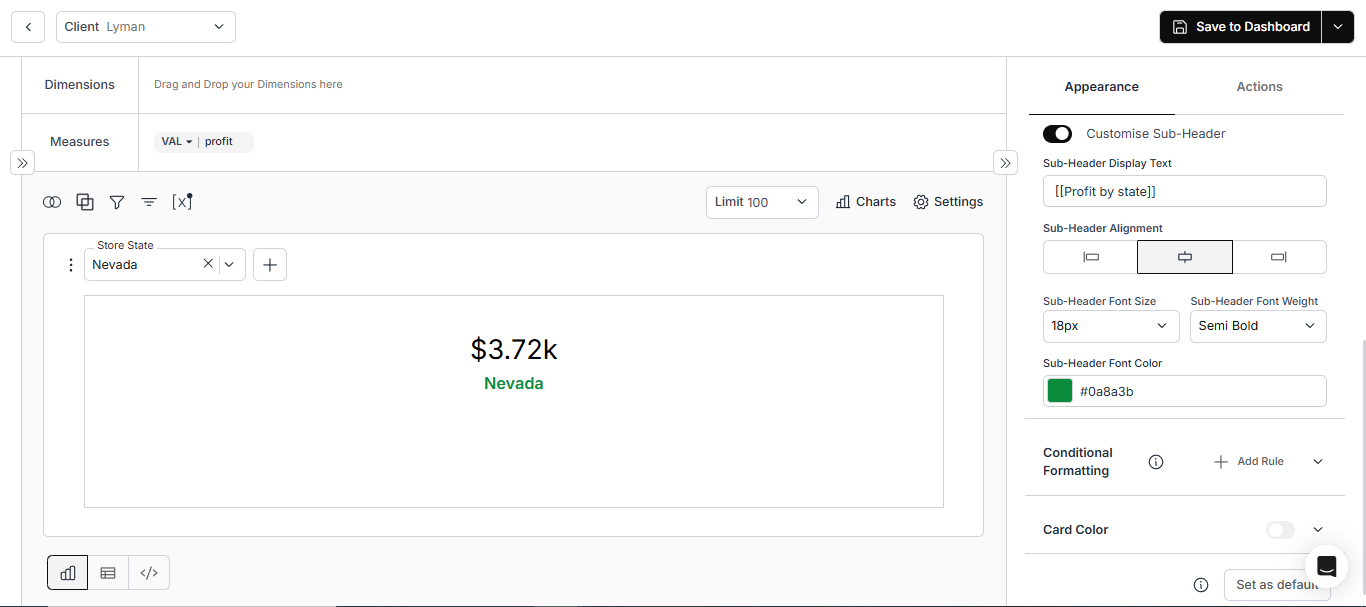
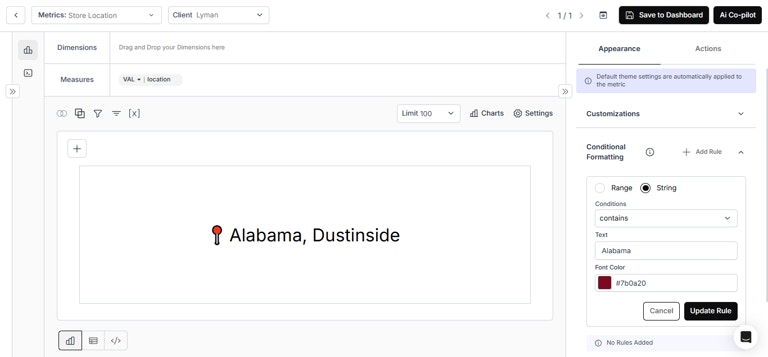
- Single Value Card: We’ve added alignment and font options, along with dynamic property support for sub-header text in the Single Value Card. String-based conditional formatting support has also been introduced.
- Metric Border Color: Users can now specify the metric border color globally from the UI Theming page.
Fixes:
- Filter Disappearance on Sync in Metric Page: Resolved an issue with the variable metric filter for the Redshift data source.
- Custom Columns in Simple Filter: Fixed an issue where custom columns were not appearing in the simple filter.
May 20, 2025 Update
May 20, 2025 Update
Enhancements:
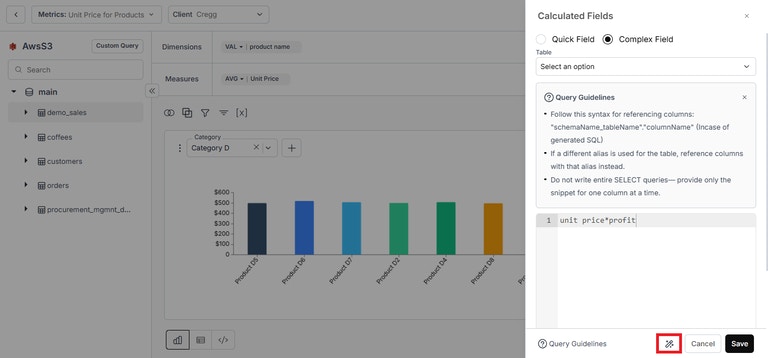
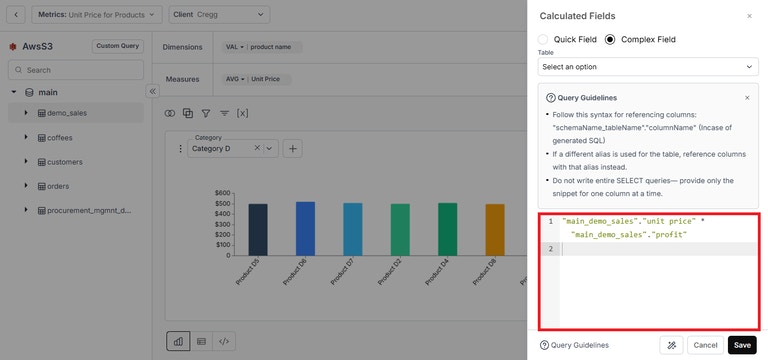
- Syntax Validation for Calculated Fields: We’ve added an icon to validate the syntax of SQL queries when creating calculated fields.
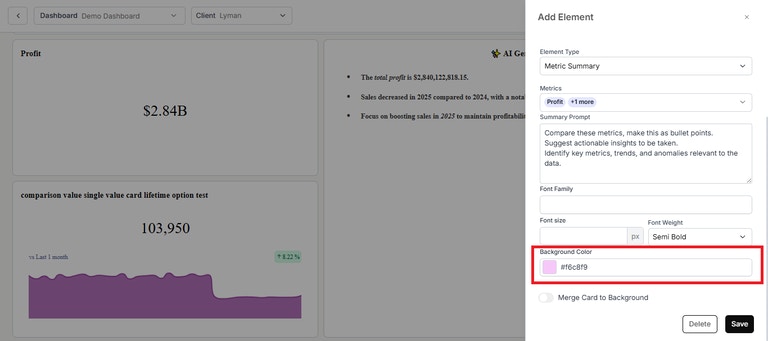
- Background Color Option for Metric Summary: You can now set a background color for the metric summary card.
- Letter Spacing, Line Height in Metric Summary Prompt: You can now specify letter spacing (in px) and line height in the metric summary prompt.
AI Summary_ Line Height.mp4
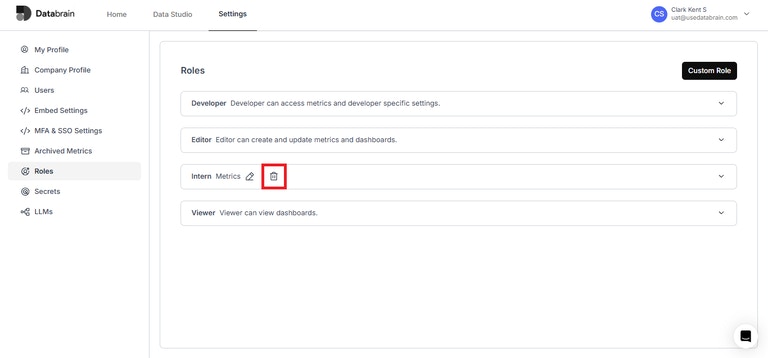
- Delete Option for Custom Roles: A delete option is now available for custom roles.
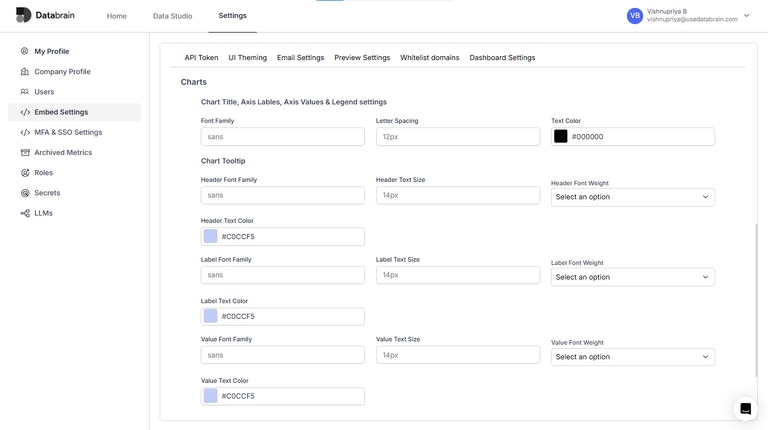
- Chart settings for chart title, axis labels, axis values, and legend have been added globally under the ‘UI Theming’ section on the Embed Settings page.
Fixes:
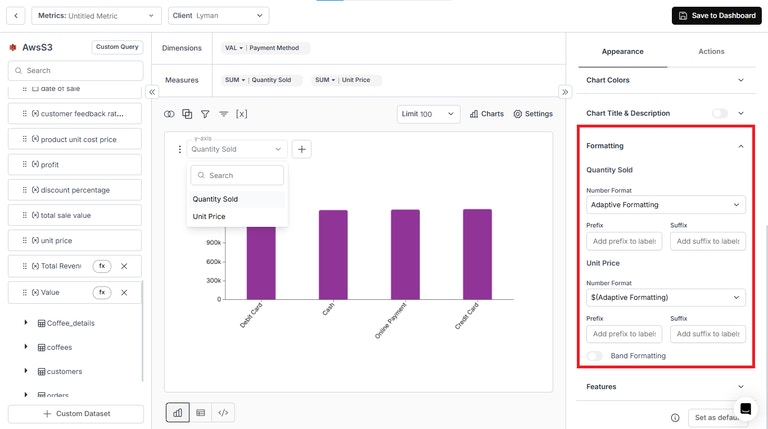
- Switch Y Axis Enablement with Individual Number Formatting: When the “Switch Y-Axis” option is enabled, each measure now correctly applies its own number formatting settings.
May 5, 2025 Update
May 5, 2025 Update
Enhancements:
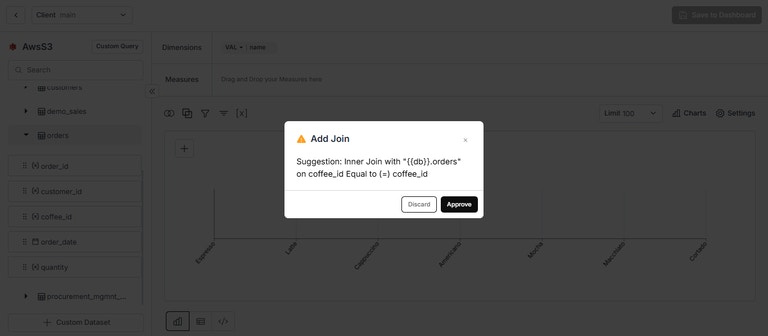
- Auto-suggest Joins on Create Metric with AI: You can now automatically join data using AI suggestions.
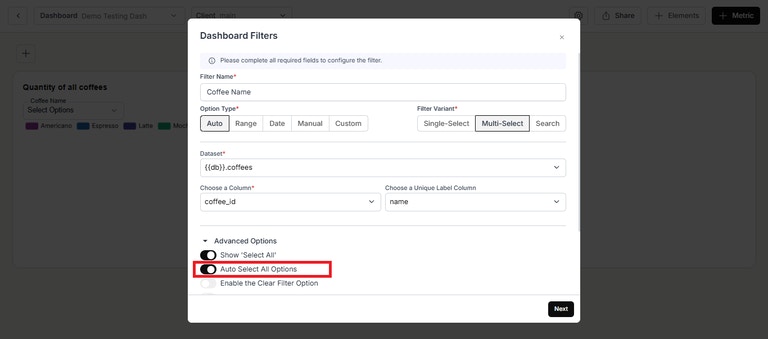
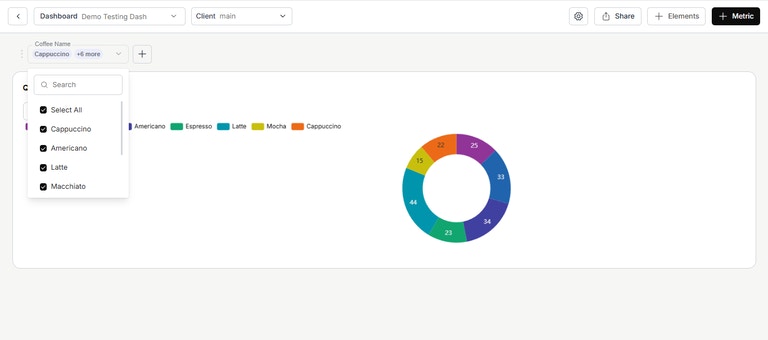
- Auto-Select All in Multi-Select Filters: We’ve added a toggle to automatically select all values in metric and dashboard filters by default.
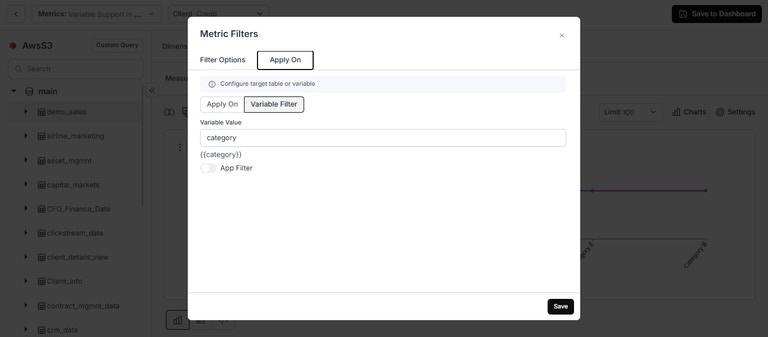
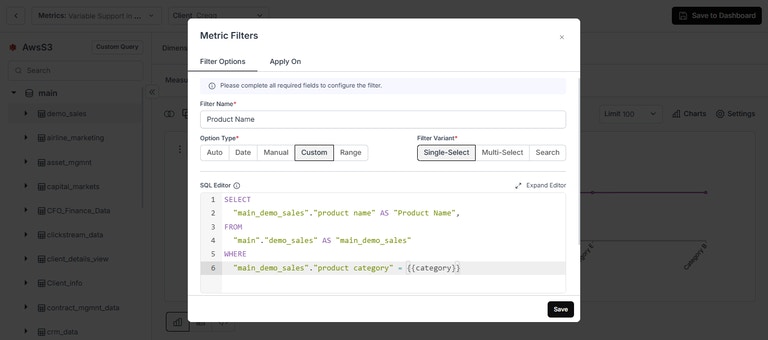
- Variable Support in Custom Query of Metric Filter: You can now pass the variable value from one metric filter into the custom query of another — for example, using the “Product Category” filter value in the “Product Name” filter.
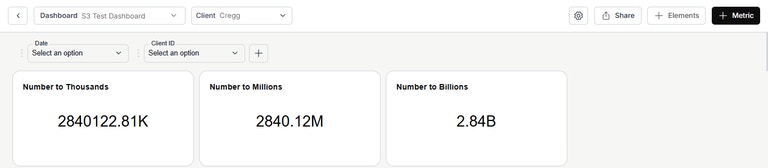
- New Number Formatting Options: We’ve introduced new number formatting options like “Thousands,” “Millions,” and “Billions”.
April 21, 2025 Update
April 21, 2025 Update
Enhancements:
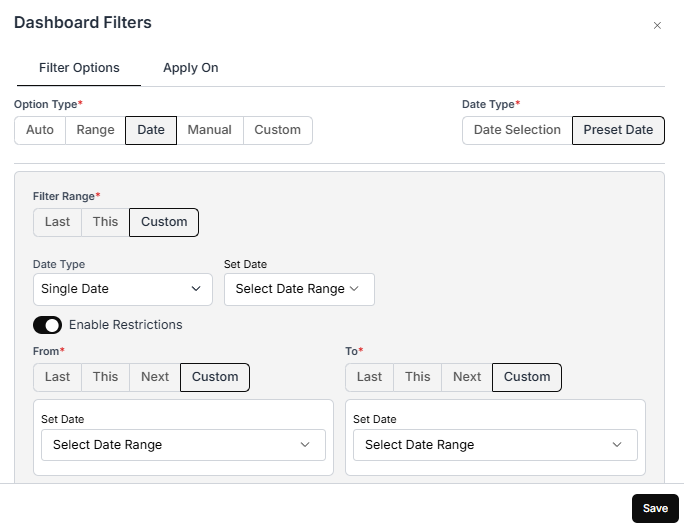
- Date Restriction Feature in Preset Date Dashboard Filters: We have added an “Enable Restrictions” toggle to the Preset Date Dashboard filter, similar to the Metric Filter.
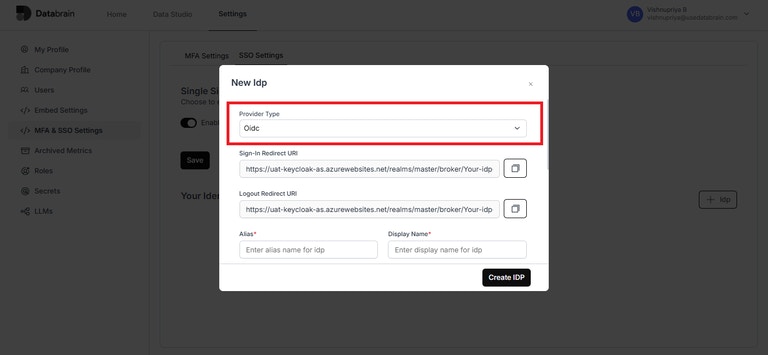
- OIDC Identity Provider (IDP) Support: Users can now create an OIDC-based IDP for Single Sign-On (SSO) under MFA & SSO Settings
Fixes:
- Dashboard UI Fix: Resolved an issue where the ‘Reset’ button overlapped with other UI elements on the dashboard page.
- Report Scheduling: Added user prompts for improved clarity and guidance during report scheduling.
April 16, 2025 Update
April 16, 2025 Update
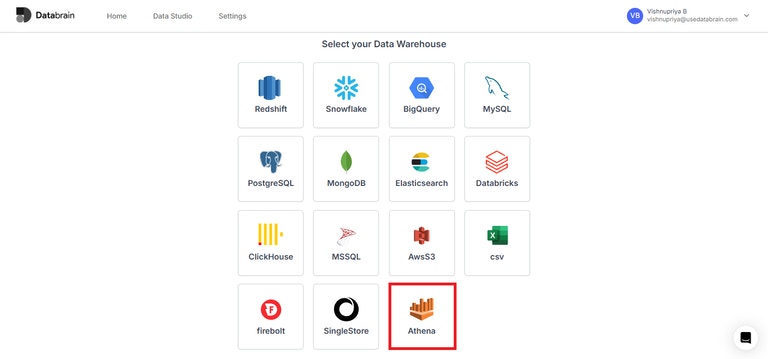
Features:
- New Data Source – Athena: We’ve added support for a new data source: Athena.
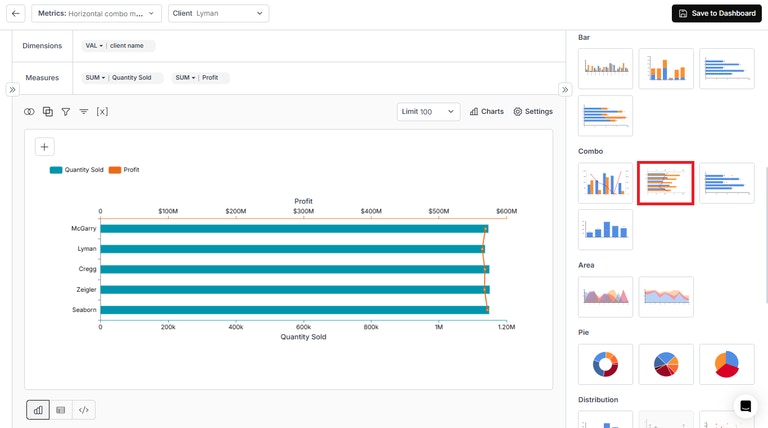
- Horizontal Combo Chart: A new chart type has been introduced, similar to the combo multi-scale chart but arranged horizontally.
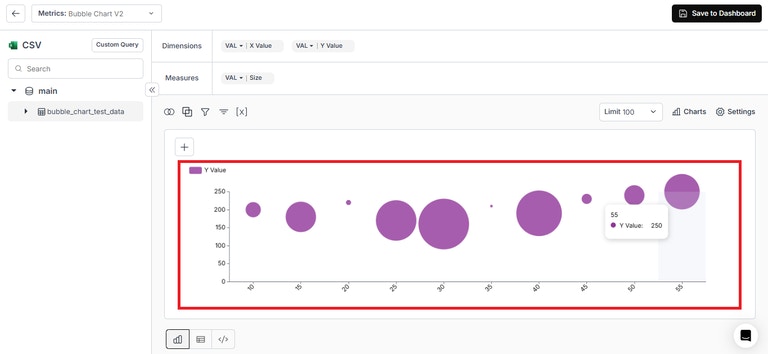
- Bubble Chart V2: The updated version of the Bubble Chart now allows users to specify bubble size. You can now set a measure for bubble size and drag & drop measures into dimensions.
Enhancements:
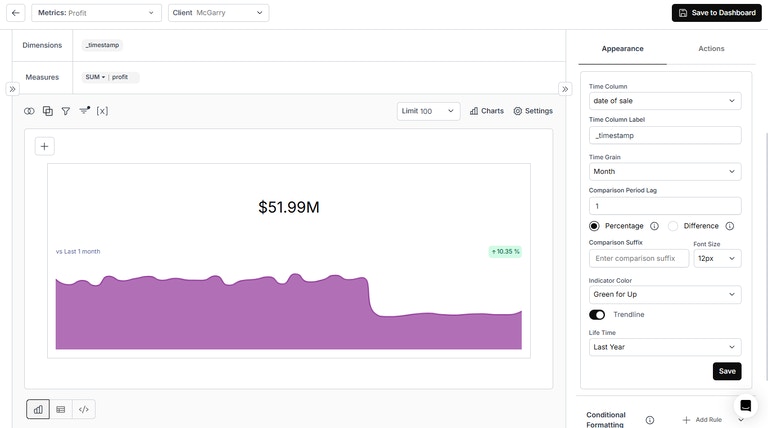
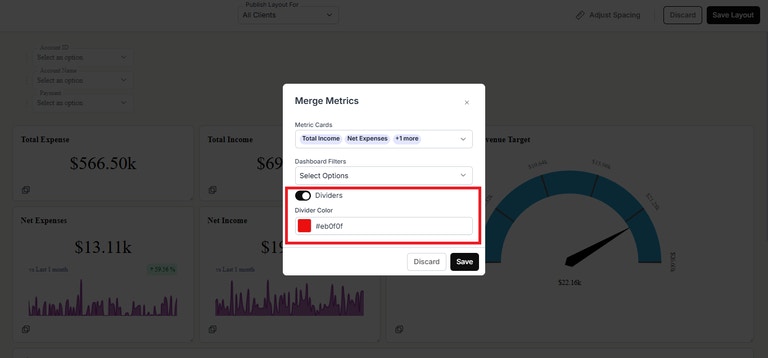
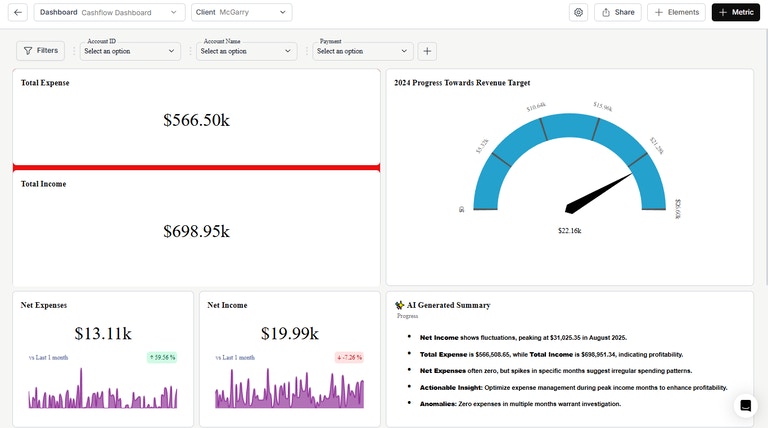
- Date Range Mapping for Single Value Card Comparison: Single value cards now automatically reflect the selected dashboard date filter range. If “Lifetime” is chosen, the card uses the comparison value set in its settings.
- Grid Dividers in Merge Metric: Users can now add grid dividers between different metrics and enhance them with background colors.
Fixes:
- Resolved an issue with the preset date dashboard filter in Firebolt.
April 10, 2025 Update
April 10, 2025 Update
Features:
- Add Alignment Option for Single-Value Card: You can now align the value in Single-Value Cards.
Navigate to Settings > Appearance > Customizations > Alignment for more control over layout.
Enhancements:
- Table Chart Minimum Height: Reduced the minimum height of Table Charts in dashboards for better space utilization and layout flexibility.
Fixes:
- Download Array Datatype Column Values: Fixed an issue where array-type column values were not downloaded correctly.
- Single Value Card Resizing: Resolved inconsistencies in resizing behavior for Single-Value Cards.
- Progress V2 Number Formatting: Addressed incorrect number formatting on upper limit when using dynamic properties.
- Combo Chart Duplicate Axis: Fixed an issue where duplicate axes appeared in Combo Charts.
April 4, 2025 Update
April 4, 2025 Update
Enhancements
- Complex Sort in Metrics: Added a feature to generate SQL for custom sorting beyond the default lexicographical ASC and DESC provided by SQL.
Advanced Sort.mp4
- Role Permissions for Metric Elements: Introduced an option to manage role-based permissions for metric elements.
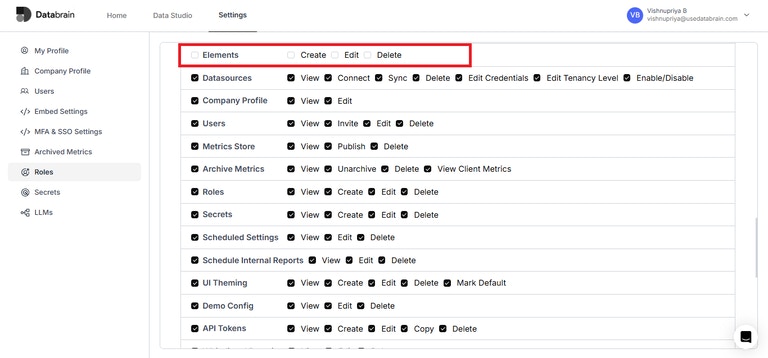
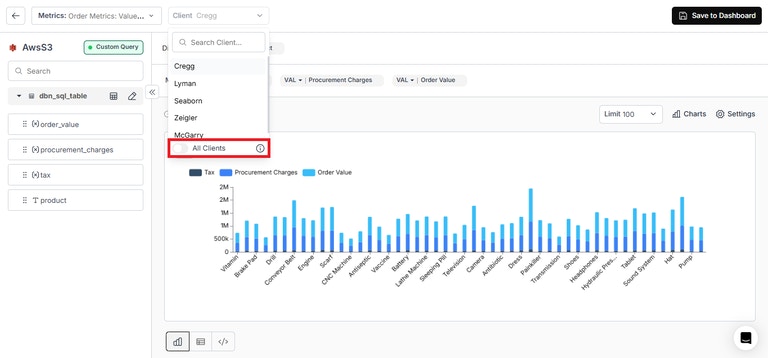
- “All Clients” Option: Added an “All Clients” selection on the metric creation page.
- Transpose Data in Table Charts: Introduced a toggle to switch rows and columns in table charts.
Transpose Data.mp4
March 31, 2025 Update
March 31, 2025 Update
Enhancements
- Metric Expression Support in Elements: We have introduced metric expression support in elements, allowing users to compute values using metric ID.
Custom Value Redirection.mp4
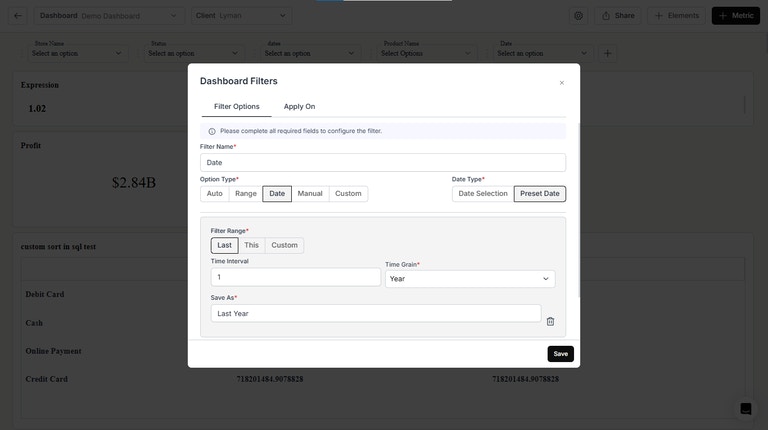
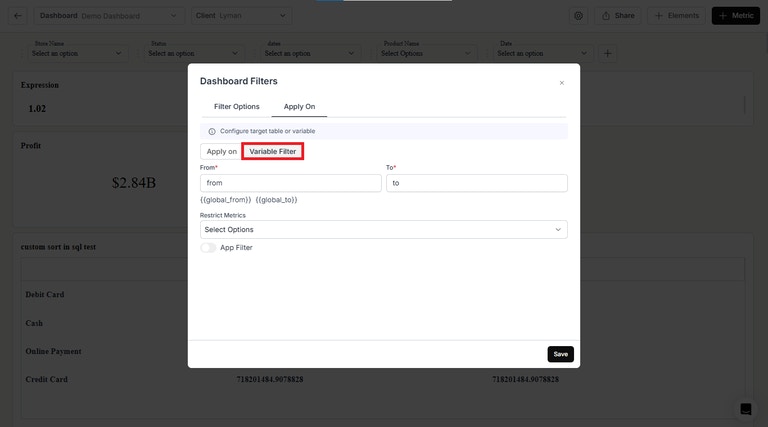
- Added Variable Filter for Preset Date Filter: Implemented a variable filter in the preset date option for dashboards.
Fixes
- Improved Pagination on the Explore Data Page: Fixed an issue where pagination did not display correctly, ensuring a smoother navigation experience.
- UI Update: Resolved an issue with tooltips for better usability.
March 27, 2025 Update
March 27, 2025 Update
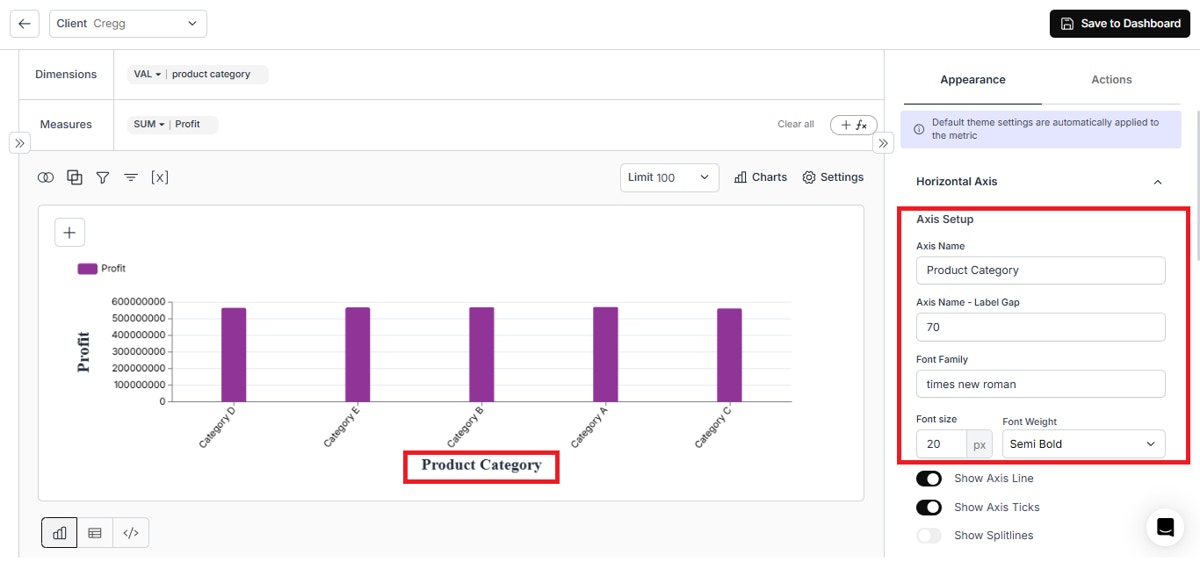
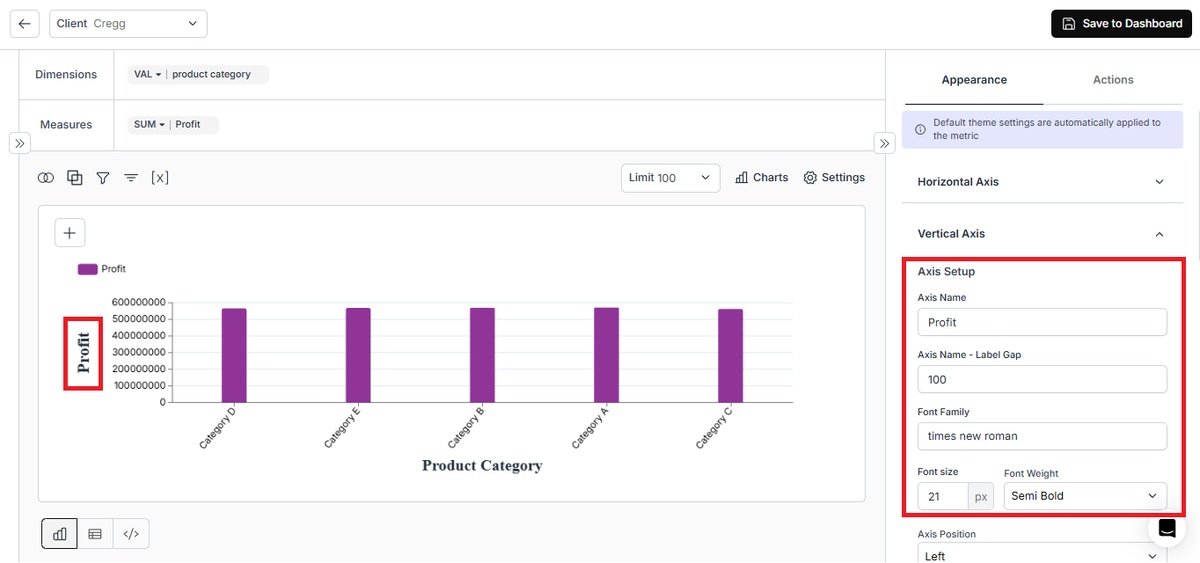
Enhancements
- Font Style Options in Axis Charts: Added Font Family, Font Size, and Font Weight options for horizontal and vertical axis names
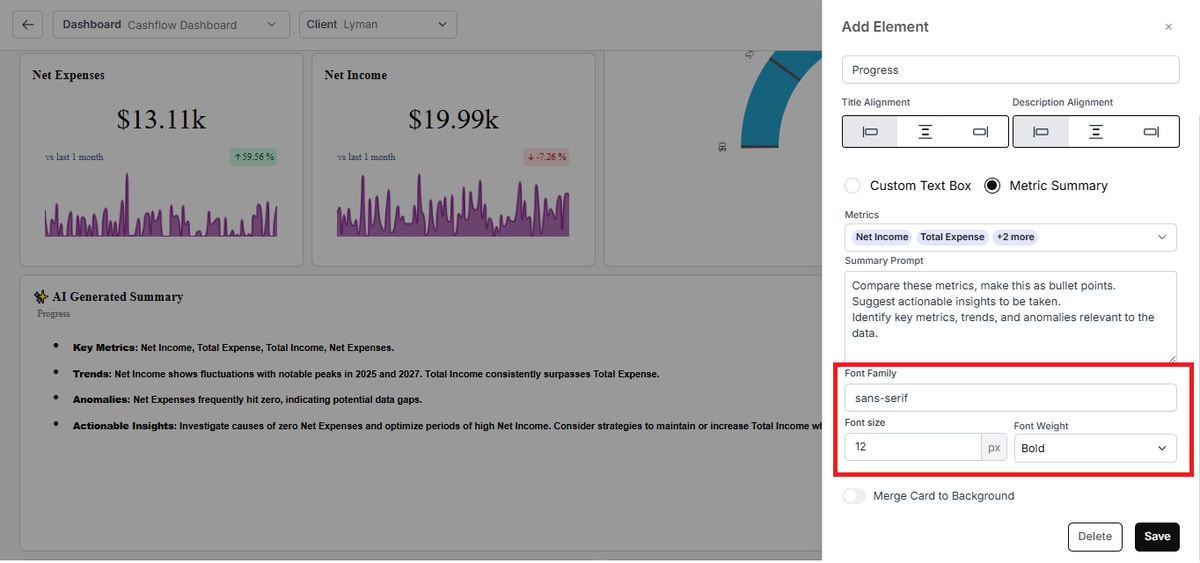
- Font Styling for Metric AI Summary: Users can now customize font styles in the Metric AI Summary
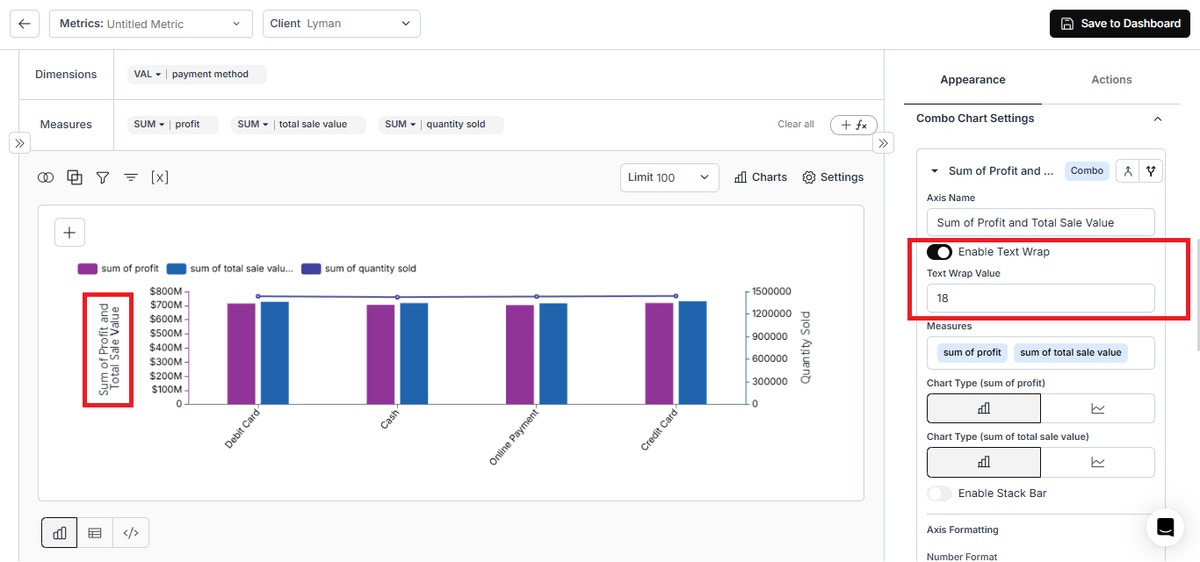
- Text Wrap in Combo Multi-Scales Chart: Users can now define a value to break text in the Y-axis name of the combo multi-scales chart
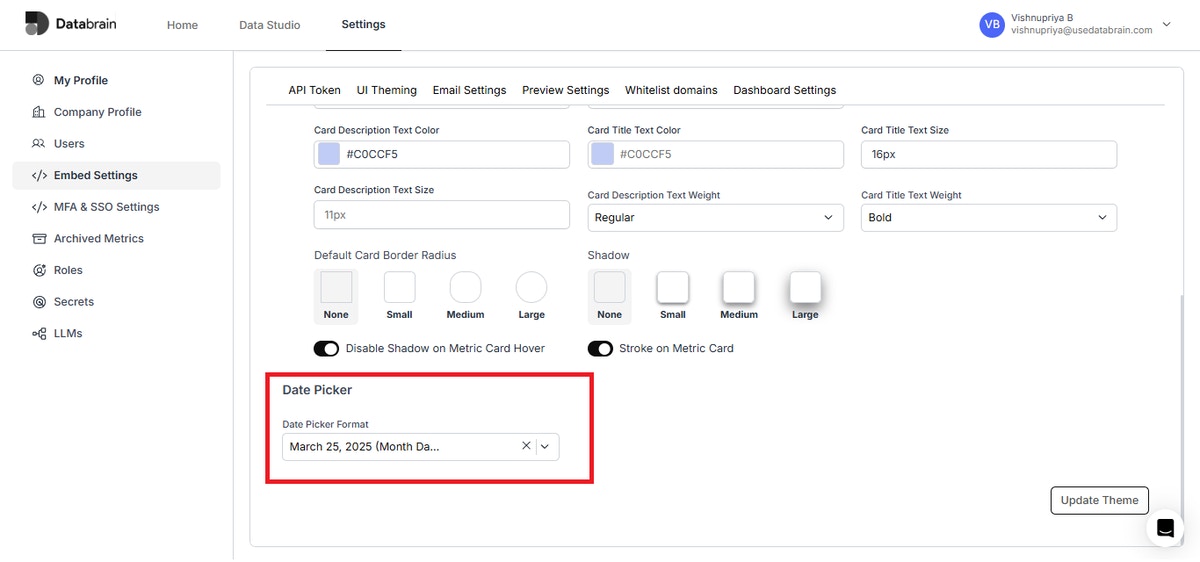
- Customize Date Format: Users can now set their preferred date format for the date filter in the “UI Theming” page
Fixes
- Explore Data: Fixed a download issue in the Explore Data feature
March 25, 2025 Update
March 25, 2025 Update
Enhancements
- Sorting and Number Formatting for Pivot Table V2: Added options for sorting and number formatting in Pivot Table V2
- Custom Value Redirection in Table Chart: Users can now click on a specific value in the Table Chart to be redirected to a designated link
Custom Value Redirection.mp4
Fixes
- UI Update: Chart Tooltip settings will remain hidden until the “Label Tooltip” toggle is enabled
- Metric Alignment Fix: Resolved an issue where metric alignment changed after exporting and importing a dashboard.
March 20, 2025 Update
March 20, 2025 Update
Enhancements
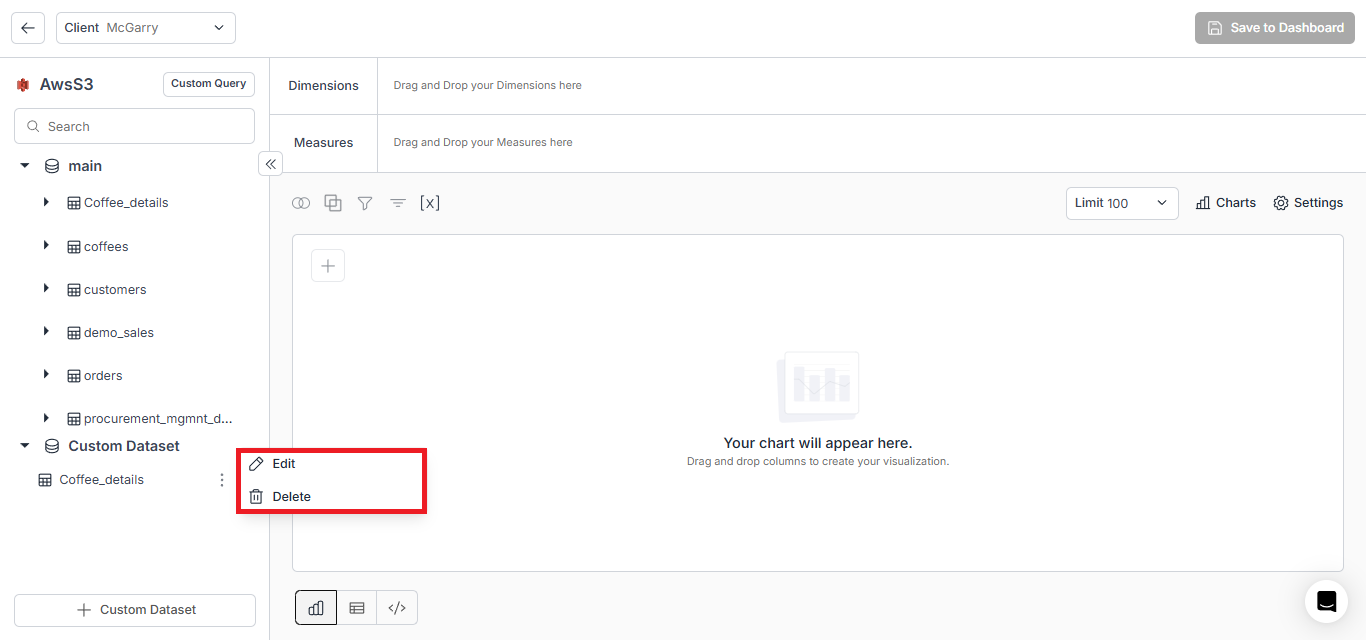
- Editability of Created Views in Custom Datasets: Exploring the feasibility of enabling editing and deleting capabilities for previously created views within custom datasets.
- Enhanced Pivot Table V3
- Improved UI for Table Chart Pagination
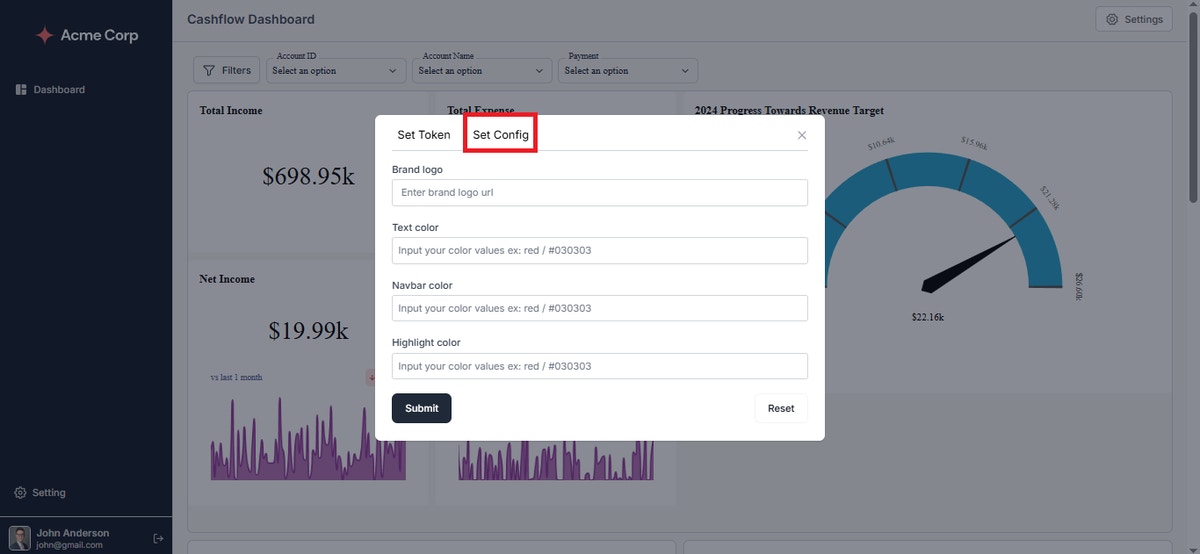
- Metric Background Color in Single Value Card: Users can now add a background color to Single Value Cards.
- Set Config: User can now set Data Config Options in Embedded Dashboards.
Fixes
- Fixed flickering issue in bar charts.
- BigQuery Data Source Fixes: Resolved issues with
GROUP BY, single quotes in filters, and AI-powered query formatting.
March 6, 2025 Update
March 6, 2025 Update
Feature:
- Datasource Sync API: Exposed an API for syncing the datasource
Enhancements:
- Dashboard Date Filter & Time-Series Chart Integration: We have added support for mapping dashboard date filter options with time-series charts for improved synchronization
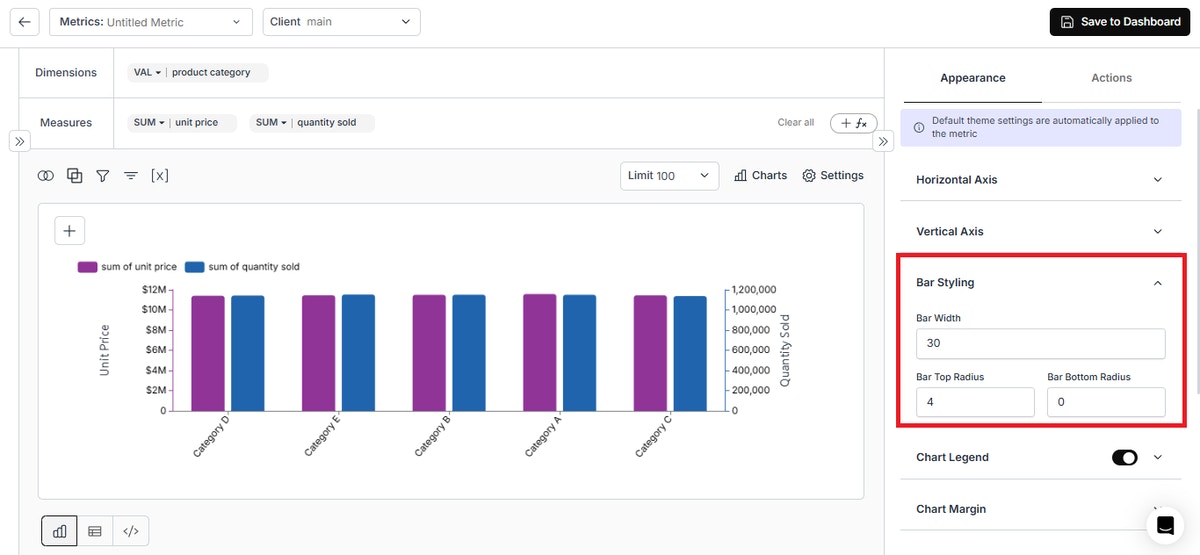
- Bar Styling for Combo Multi-Scales Chart: Added a “Bar Styling” option to the combo multi-scales chart for better customization. This feature allows users to fine-tune the appearance of bars for improved visualization and readability with key Customization Options:
- Bar Width – Adjust the width of bars to control spacing and visual clarity
- Bar Top Radius – Round the top edges of bars for a softer, modern look
- Bar Bottom Radius – Customize the bottom edge roundness for a polished appearance
Fixes:
- Bubble Chart in Firebolt: Resolved an issue affecting the Bubble chart when using the Firebolt datasource
- UI Update (Fullscreen Dropdown Component): Fixed an inconsistency in dropdown behavior when in fullscreen mode
March 3, 2025 Update
March 3, 2025 Update
DataBrain Update: Enhancements & Fixes
Enhancements
- Horizontal Chart: Added Switch X-Axis and Switch Y-Axis features for improved flexibility
- Sankey Chart: Introduced Switch Measure functionality for better customization
Fixes
- Resolved an issue where the Switch X-Axis Dropdowns displayed removed dimension values
- Fixed duplicate values appearing in the Filter Panel dropdown in Custom Query Mode
February 28, 2025 Update
February 28, 2025 Update
Features:
- Rearrange Metric Filters: You can now rearrange metric filters on the update/create metric page using drag-and-drop, making customization easier and more intuitive.
Metric Filter Reorder.mp4
-
Save a Custom Dataset (View) to Multi-Selected Datasource: You can now save a custom dataset across multiple selected data sources, enabling seamless data management and greater flexibility. Refer to the document below:
Creating a Custom Dataset/View in a Multi-Datasource Environment
-
Support Fiscal Year in Date Filter: You can now set up a custom fiscal year filter in DataBrain to filter data based on the Indian Financial Year. Refer to the documentation below:
Custom Fiscal Year Filter Setup in DataBrain
- Easier Access to Frequently Used Tables: Frequently used tables now appear at the top of the schema sidebar on the metric creation page, improving accessibility and efficiency.
Prioritize Frequently Used tables.mp4
Enhancements:
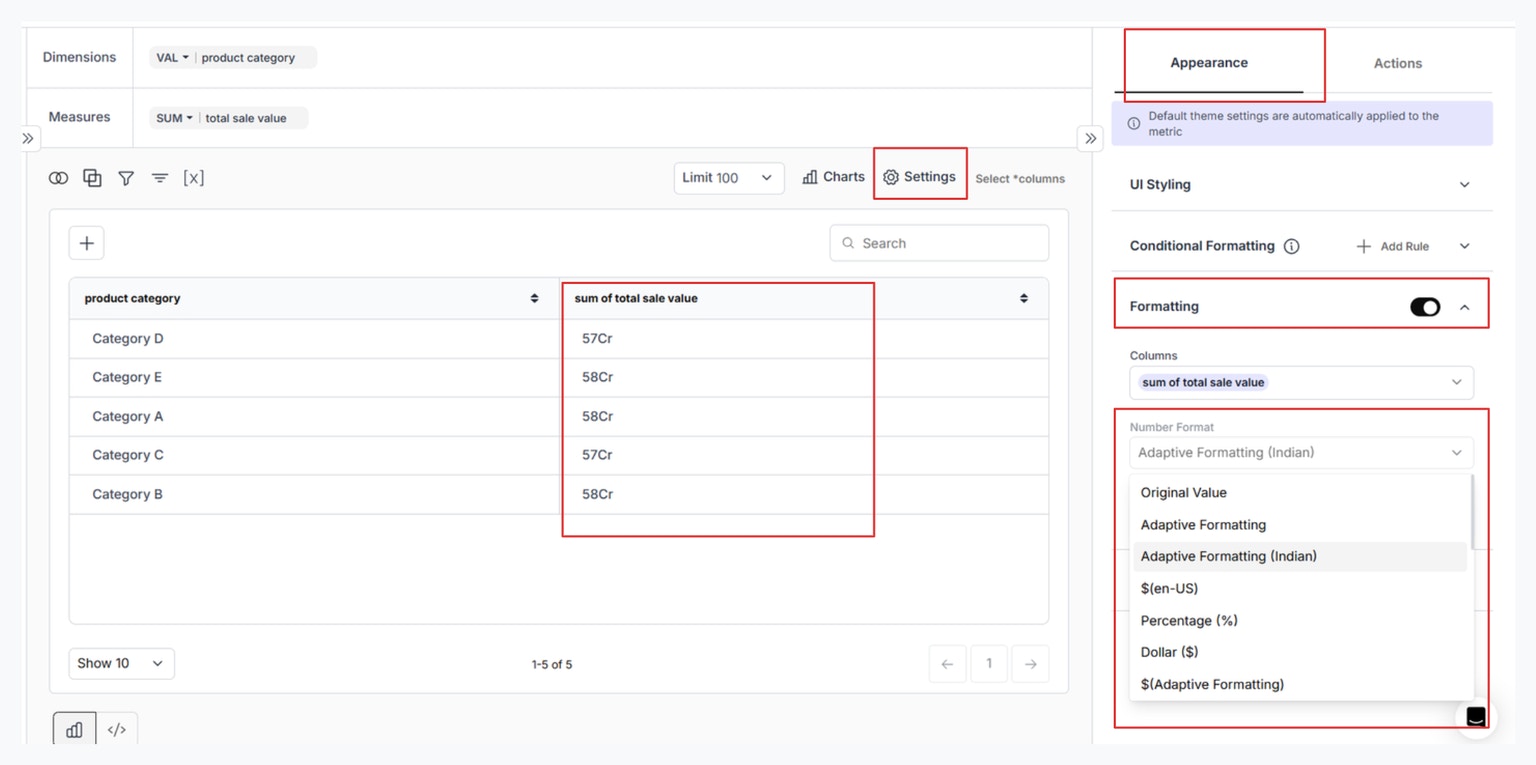
- Adaptive formatting for Indian decimals: The Indian Number System now considers values up to two decimal places.

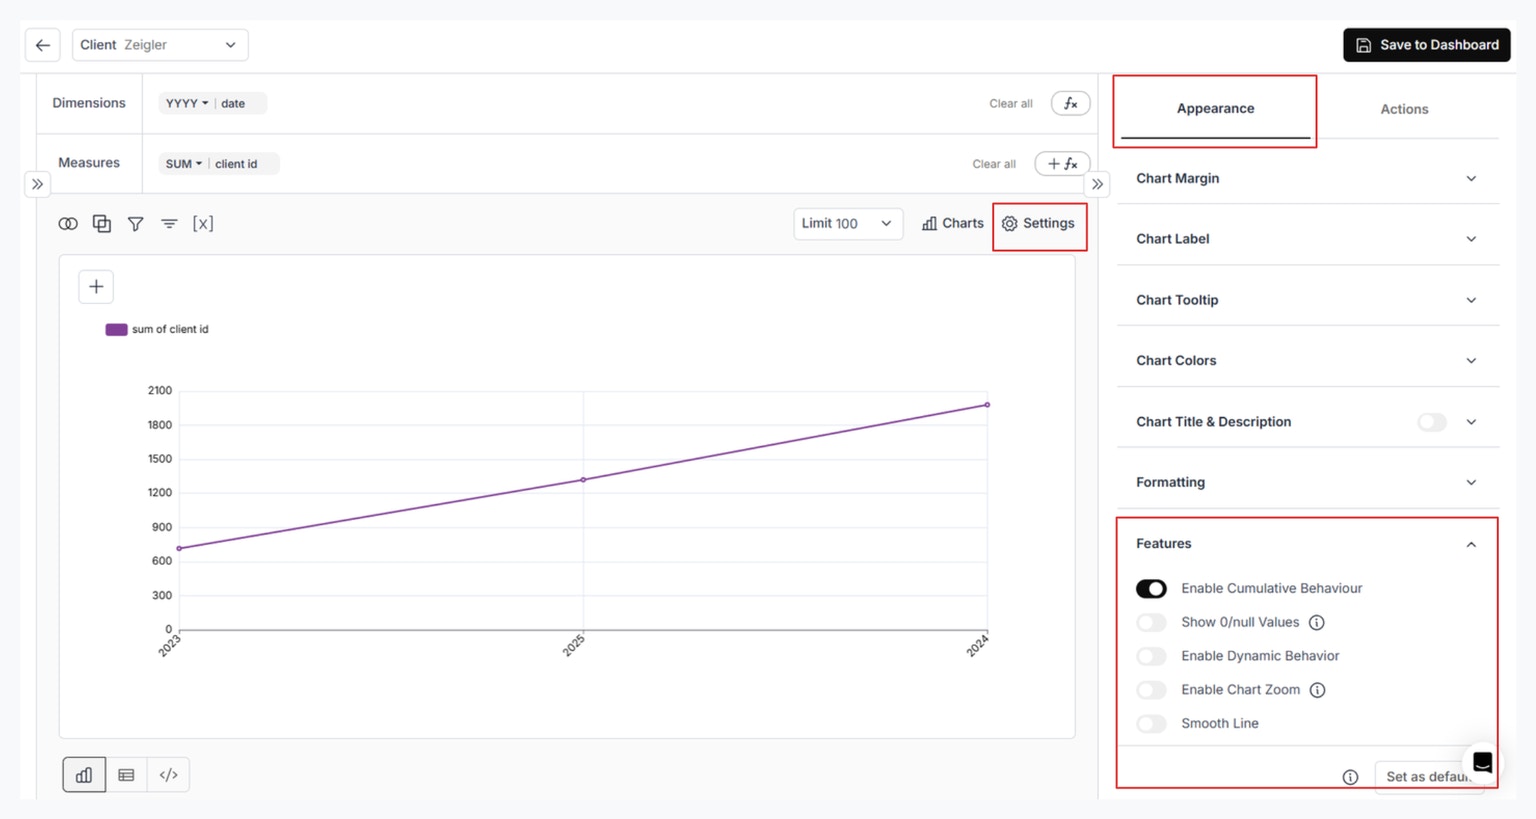
- Enhanced Chart Controls for End Users: End users can now access additional chart options, including Enable Cumulative Behavior, Dynamic Behavior, and Chart Zoom, for improved data visualization and interaction.
End user Chart settings.mp4
Fixes:
- UI update: We have enhanced the user experience by eliminating flickering when switching between the Charts Panel and Settings Panel, ensuring a smoother and more seamless transition.
- Improved Reset Password Flow: Expired Reset Password links now immediately display a “Reset Password Link Expired” message, preventing unnecessary input.
- Date filter: The Date Filter now accepts only four-digit years, preventing incorrect inputs.
February 21, 2025 Update
February 21, 2025 Update
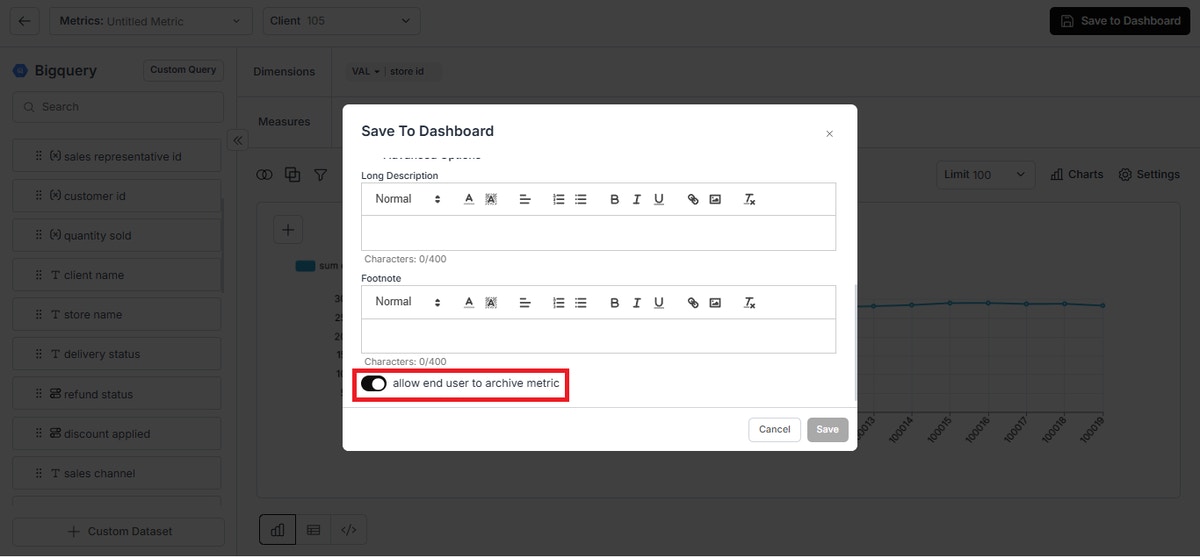
- Archive Metrics: End users can now archive metrics for better organization.
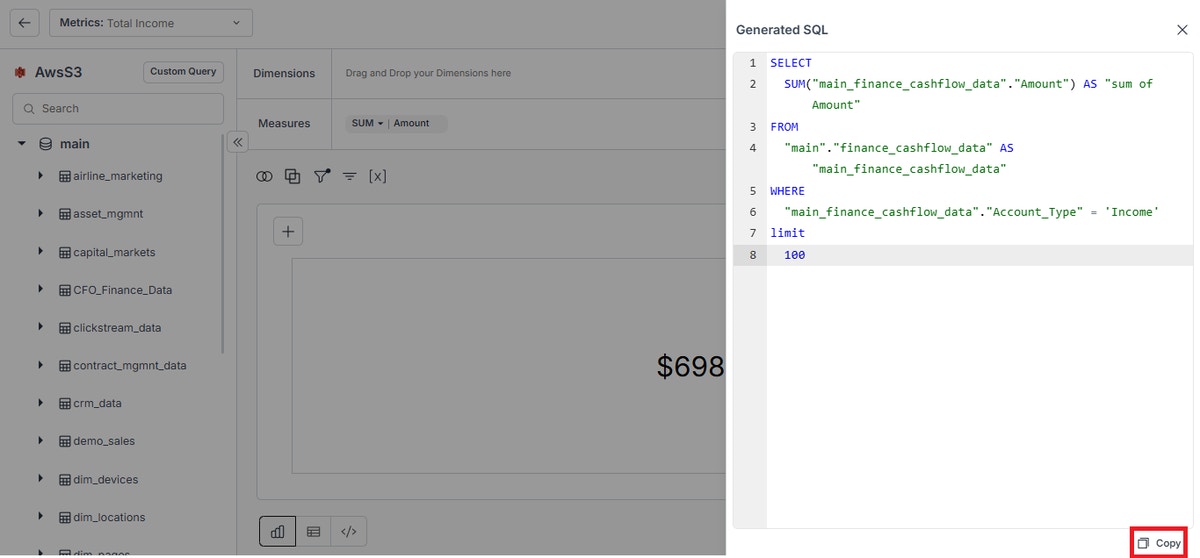
- Copy Generated SQL with One Click: A new “Copy” button allows you to easily copy the generated SQL query.
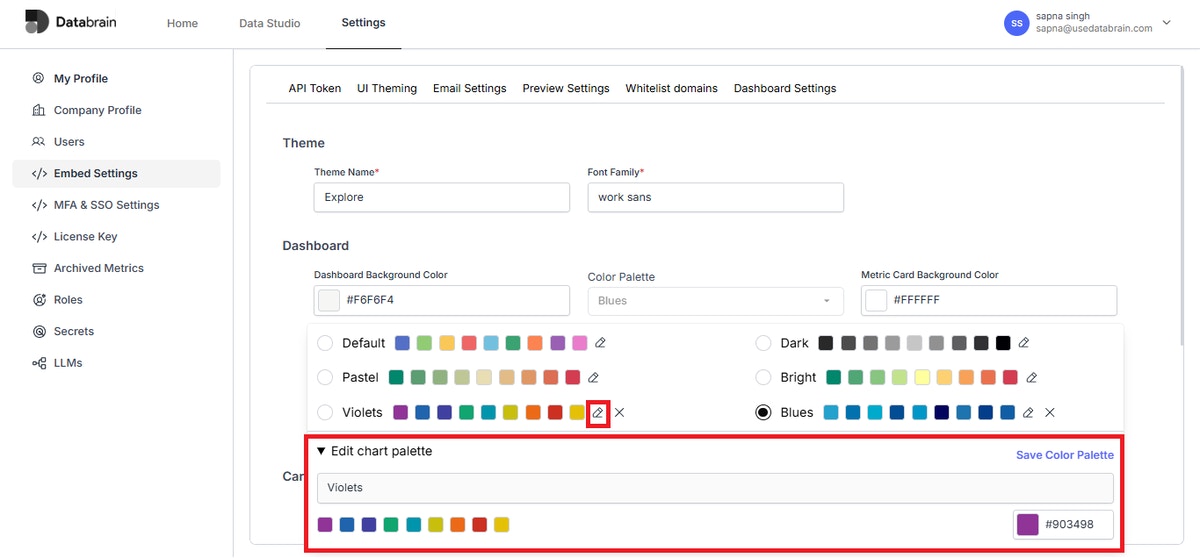
- Customizable Color Palettes: Modify colors in existing palettes anytime to match your theme by clicking on the edit icon.
- Improved Dashboard and Metric Filters: Added a “Clear All” option for Dashboard/Metric filters.
- Enhanced Table Charts: Introduced an input field to customize view text in table charts.
Table View Details.mp4
- Drill Query Filtering: Resolved an issue that previously prevented proper handling of number-type columns in drill query filters.
February 14, 2025 Update
February 14, 2025 Update
Features:
- Drill Down for Tree Map: Introducing drill-down functionality in Tree Map charts! Click on a section to explore deeper levels of data effortlessly.
Tree Map.mp4
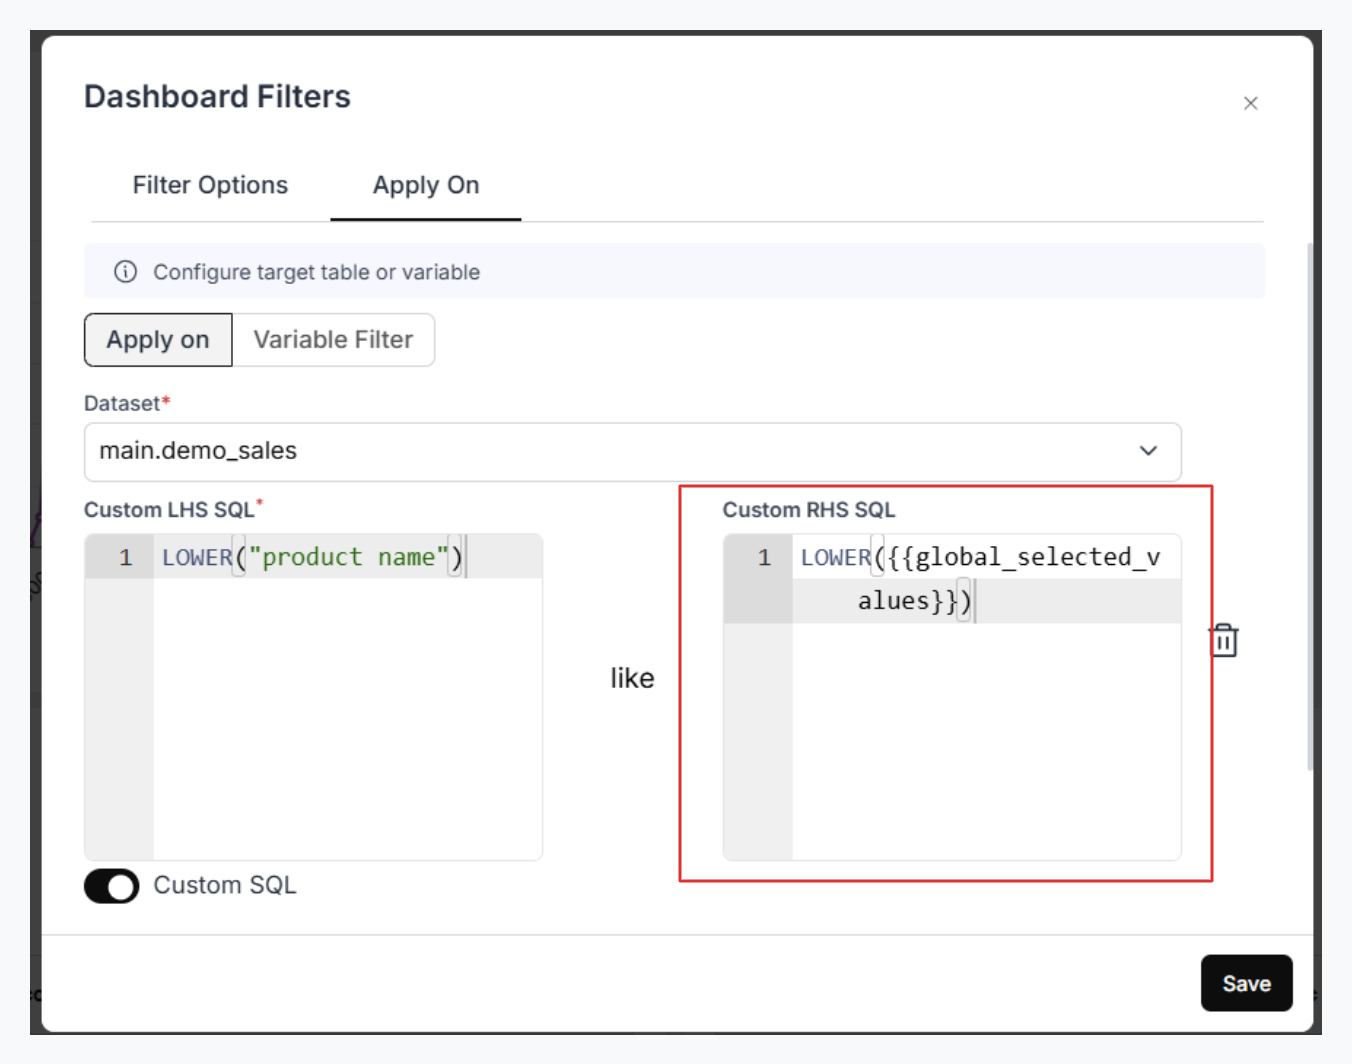
- Add RHS Custom SQL Support: Added the ability to control how selected options from a dashboard dropdown are applied on the RHS of the
WHEREclause. Use the{{global_selected_values}}variable to modify selected values dynamically (e.g., applying transformations likeCONCAT).
- Chart Click Action with Metric: Now, clicking on a metric within a chart allows seamless navigation to another related metric for enhanced data exploration.
click action.mp4
- Add View Button in Table Chart: Added a “View” button in table charts, enabling users to expand selected columns within a row for better data visibility.
Table hide column.mp4
Enhancements:
- Adaptive Formatting – Indian Number System: Added support for number formatting in the Indian system (e.g., lakh, crore) for improved readability.
February 6, 2025 Update
February 6, 2025 Update
Features, Enhancements, Fixes:
Features:
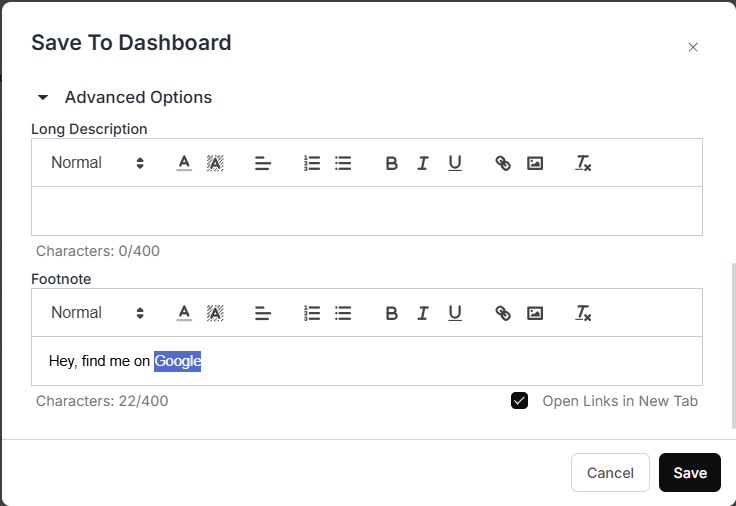
- Footnote as a Rich Text Box: Footnotes are now powered by a React text box, allowing you to add links, change colors, and apply formatting like bold and italics for better customization.
- Hide Dashboard Filter in Embed Code: You can now control the visibility of dashboard filters in embedded dashboards. This is useful for cases where different user groups need different filter options. For example, US customers can see the US fiscal year, while Indian customers see the Indian fiscal year—without displaying unnecessary filters. Please refer the below link:
Options
- Cumulative Option for Line and Area Charts: A new “Cumulative” option has been added to Line and Area charts, accessible under Chart Settings > Appearance > Features > Cumulative for better trend analysis.
Enhancements:
- Open Dashboards & Metrics in a New Tab: You can now right-click on a dashboard or metric from the homepage to open it in a new tab for easier navigation.
- UI Theming Update: You now have the option to remove the stroke around metric cards for a cleaner visual experience.
January 20, 2025 Update
January 20, 2025 Update
Features:
- New Geo Region Map: We’ve expanded our list of available geographic visualizations by adding an Indian states map, expanding our visualizing abilities.
India map.mp4
- Preview Link Management: Track all preview links generated for dashboards and delete those no longer needed for improved link management.
Preview Links.mp4
Enhancements:
- Dynamic Property Support: Added support for dynamic property implementation in the lower and upper limit setup.
- Clear All Option: Easily clear all columns added in measures or dimensions with a single click using the “Clear All” functionality.
Fixes:
- Date Restriction in Metric Filter: Resolved an issue with date restrictions in the metric filter for accurate filtering.
- Time Series for MSSQL: Fixed time series functionality for MSSQL to ensure proper data representation.
January 6, 2025 Update
January 6, 2025 Update
Features, Enhancements, Fixes
Features
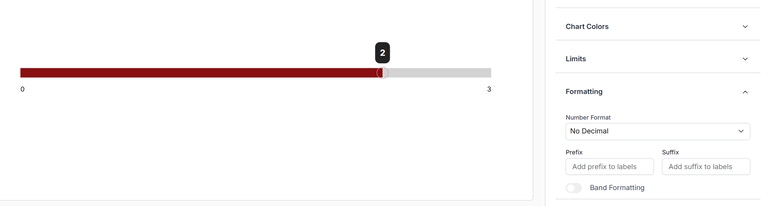
- New Progress Bar Chart
Introducing a progress bar chart with conditional formatting! It effectively handles cases where values exceed limits for accurate data representation.
Limits.mp4
- Merge Layouts
Easily merge multiple metrics and rearrange them with the same flexibility as the dashboard’s custom layout.
Merge sections.mp4
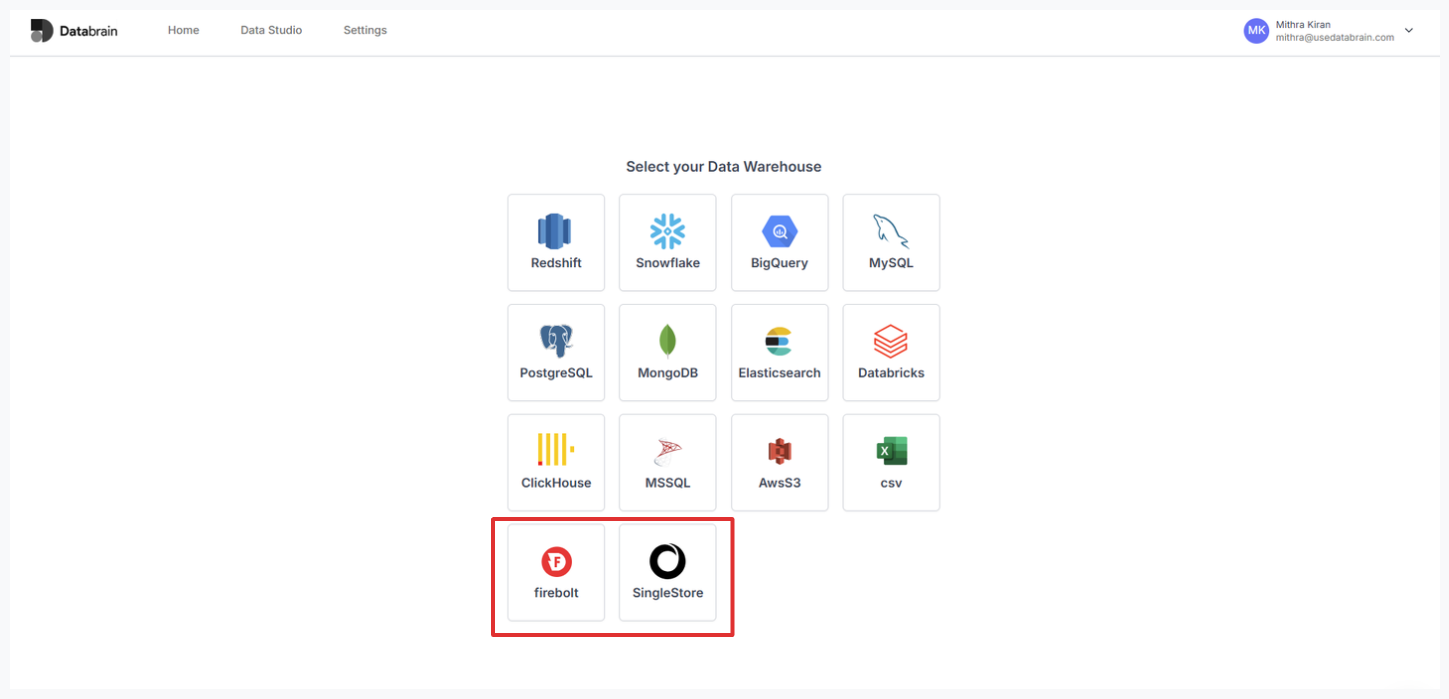
- New Data Sources – Firebolt and SingleStore
Added support for Firebolt and SingleStore for enhanced data connectivity.
Enhancements
- Revamped Chart Panel in Create Metric Page
Charts are now grouped under categories, making it easier to find and search for the desired visualizations.