What is Drill Down?
Drill Down lets users interact with data visualizations dynamically. By clicking a specific data point (e.g., a bar in a bar chart), users can expand and analyze the underlying or related dimensions. It moves from aggregated data to detailed views — for example, from total revenue by region to revenue by country or city. When you click a data point, the system adds a WHERE filter for the clicked value and re-groups by the next dimension in the hierarchy. Each level triggers a new database query, so drill-down is always working with live, accurate data.When to Use Drill Down
Drill Down is ideal for datasets with hierarchical or multi-level structures, such as:- Geographical data — Region > Country > City
- Time-series data — Year > Quarter > Month
- Organizational structures — Department > Team > Employee
- Product categories — Category > Subcategory > Product
Requirements
To enable and use the Drill Down feature, ensure:- Data Structure: The dataset must include hierarchical relationships or dimensions that can be broken down into subcategories.
- Visualization Type: Must be a supported chart type (see list below).
- Dimensions and Measures: The metric must have at least two dimensions and at least one aggregate measure (e.g., SUM, COUNT, AVG).
Setting Up Drill Down
1. Enable Drill Down
On the metric page, click the “Settings” icon, go to the “Actions” tab, and turn on the “Drill down” toggle.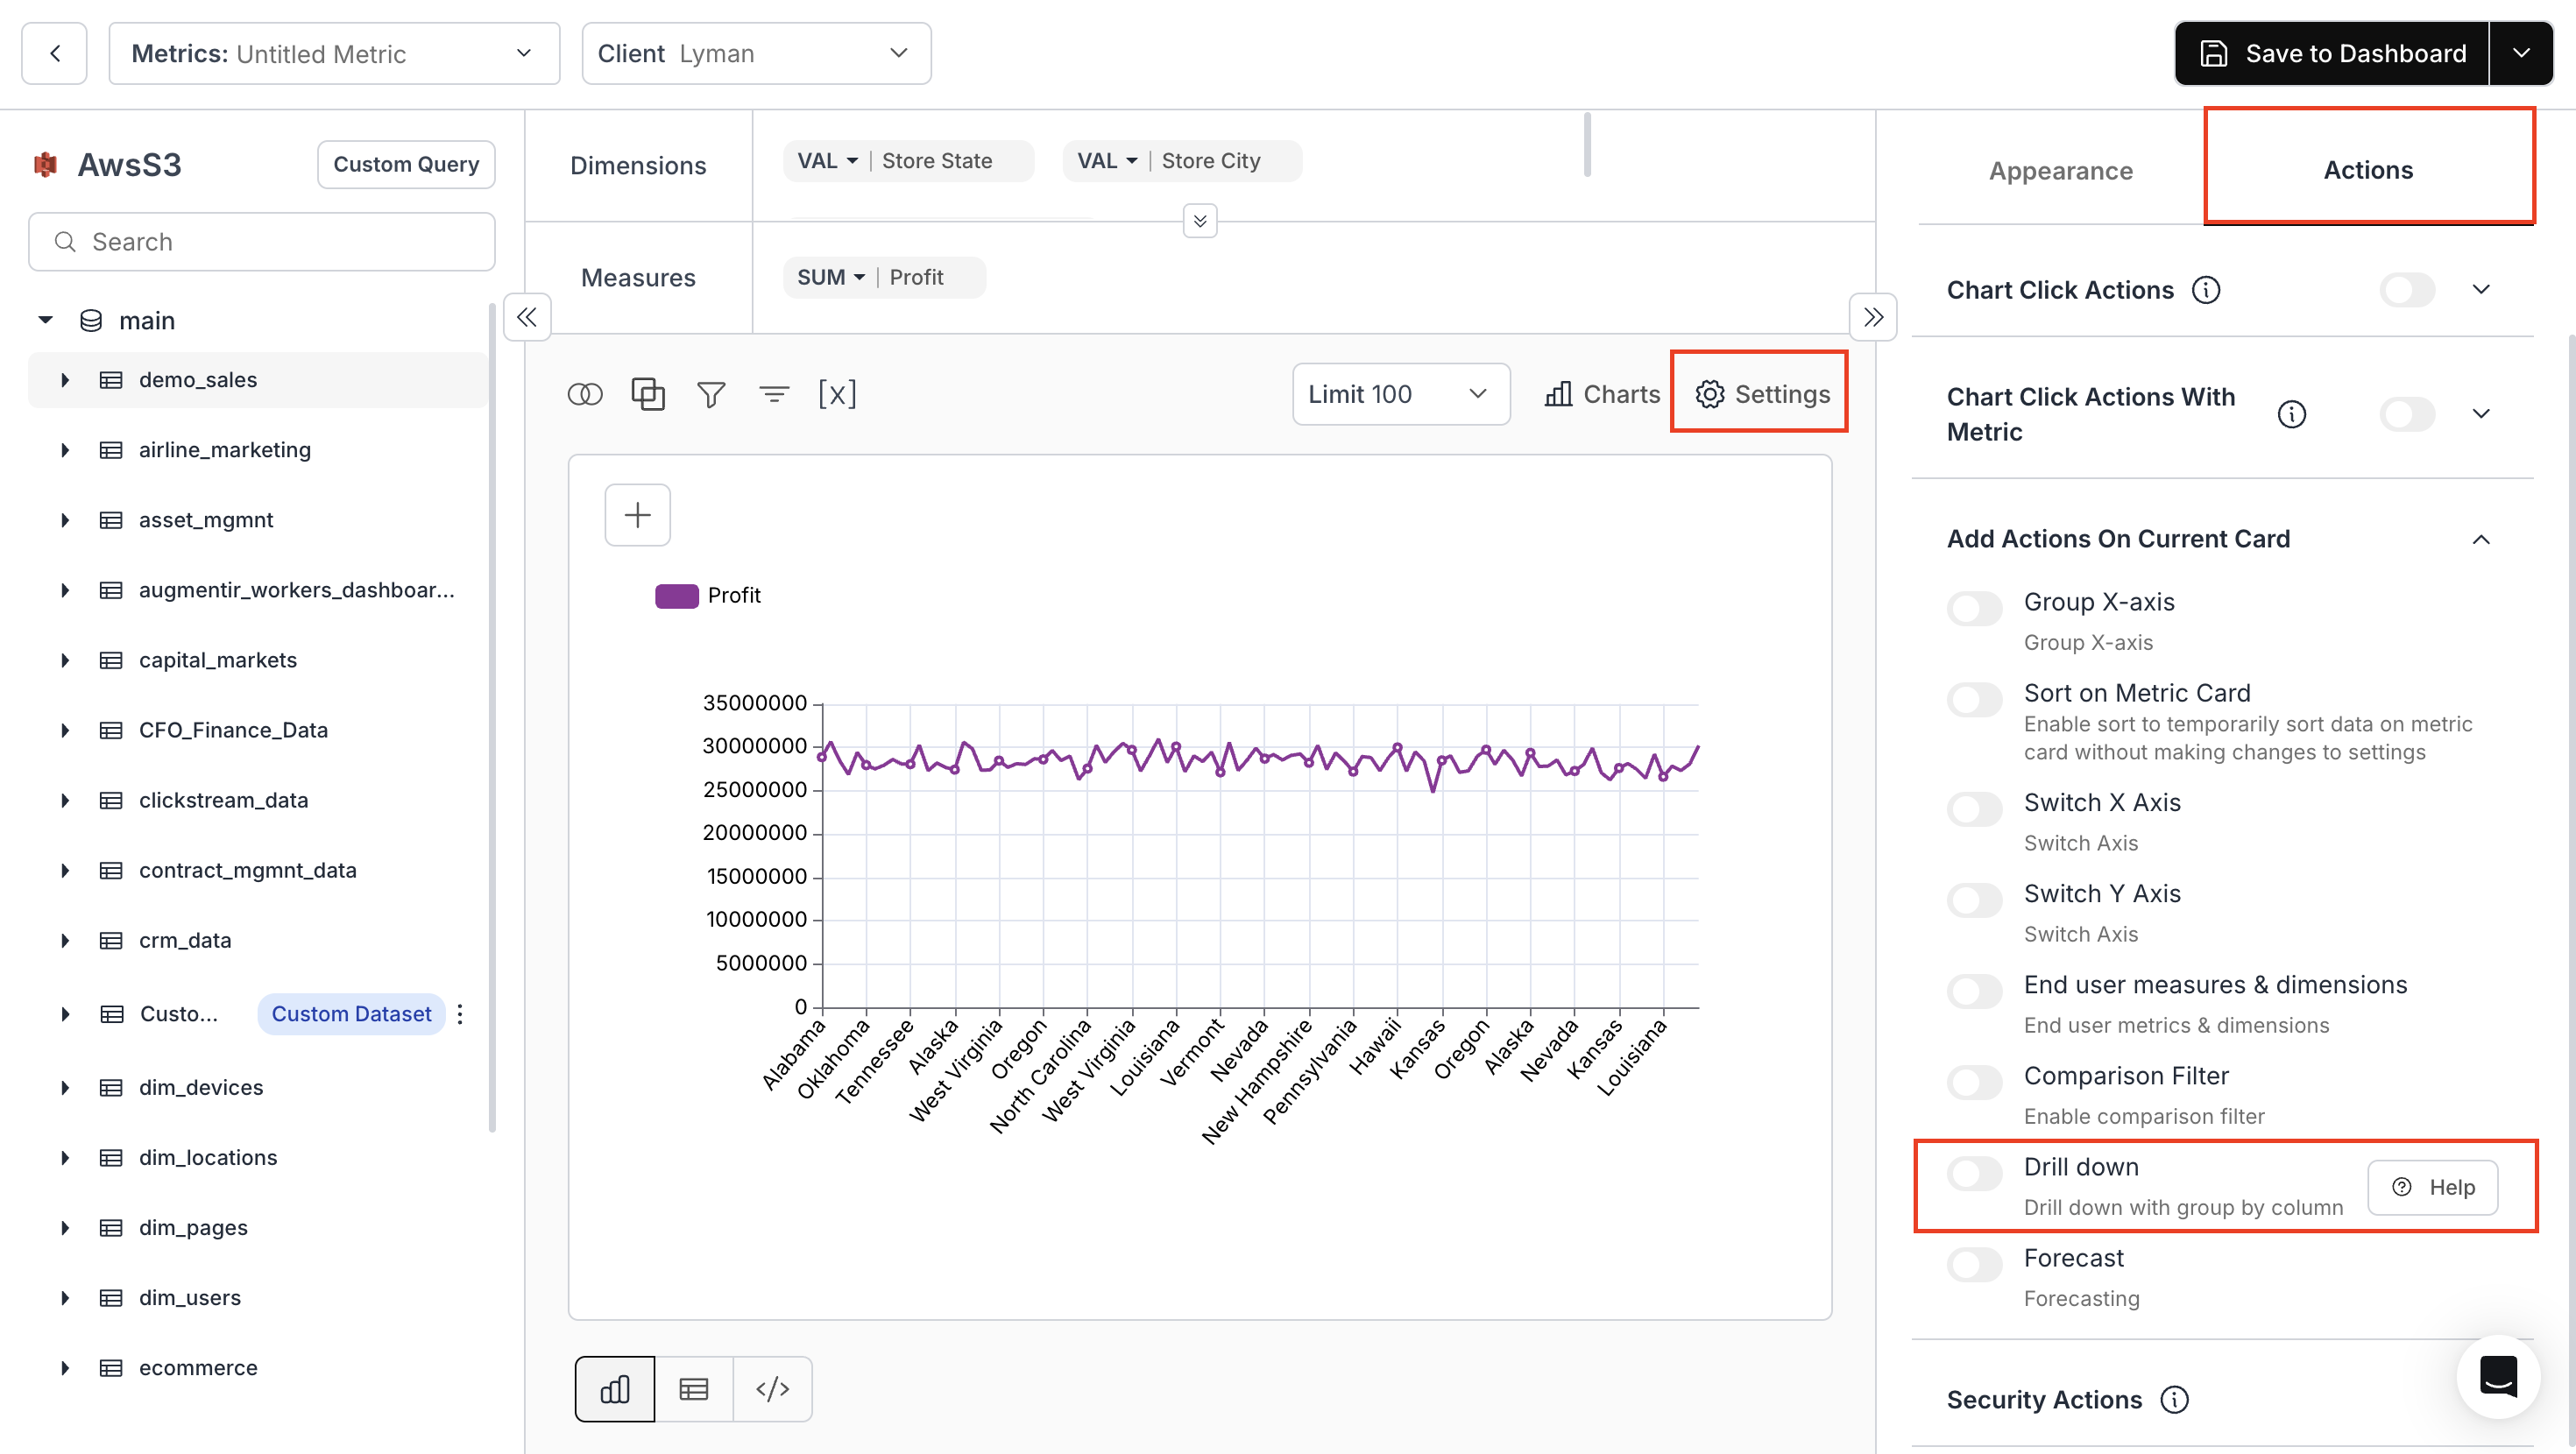
2. Configure the Data Layer
Drag and drop the dimensions you want to use for drill-down, in order. The order defines the drill hierarchy: the first dimension is the top level, the second is the first drill, and so on.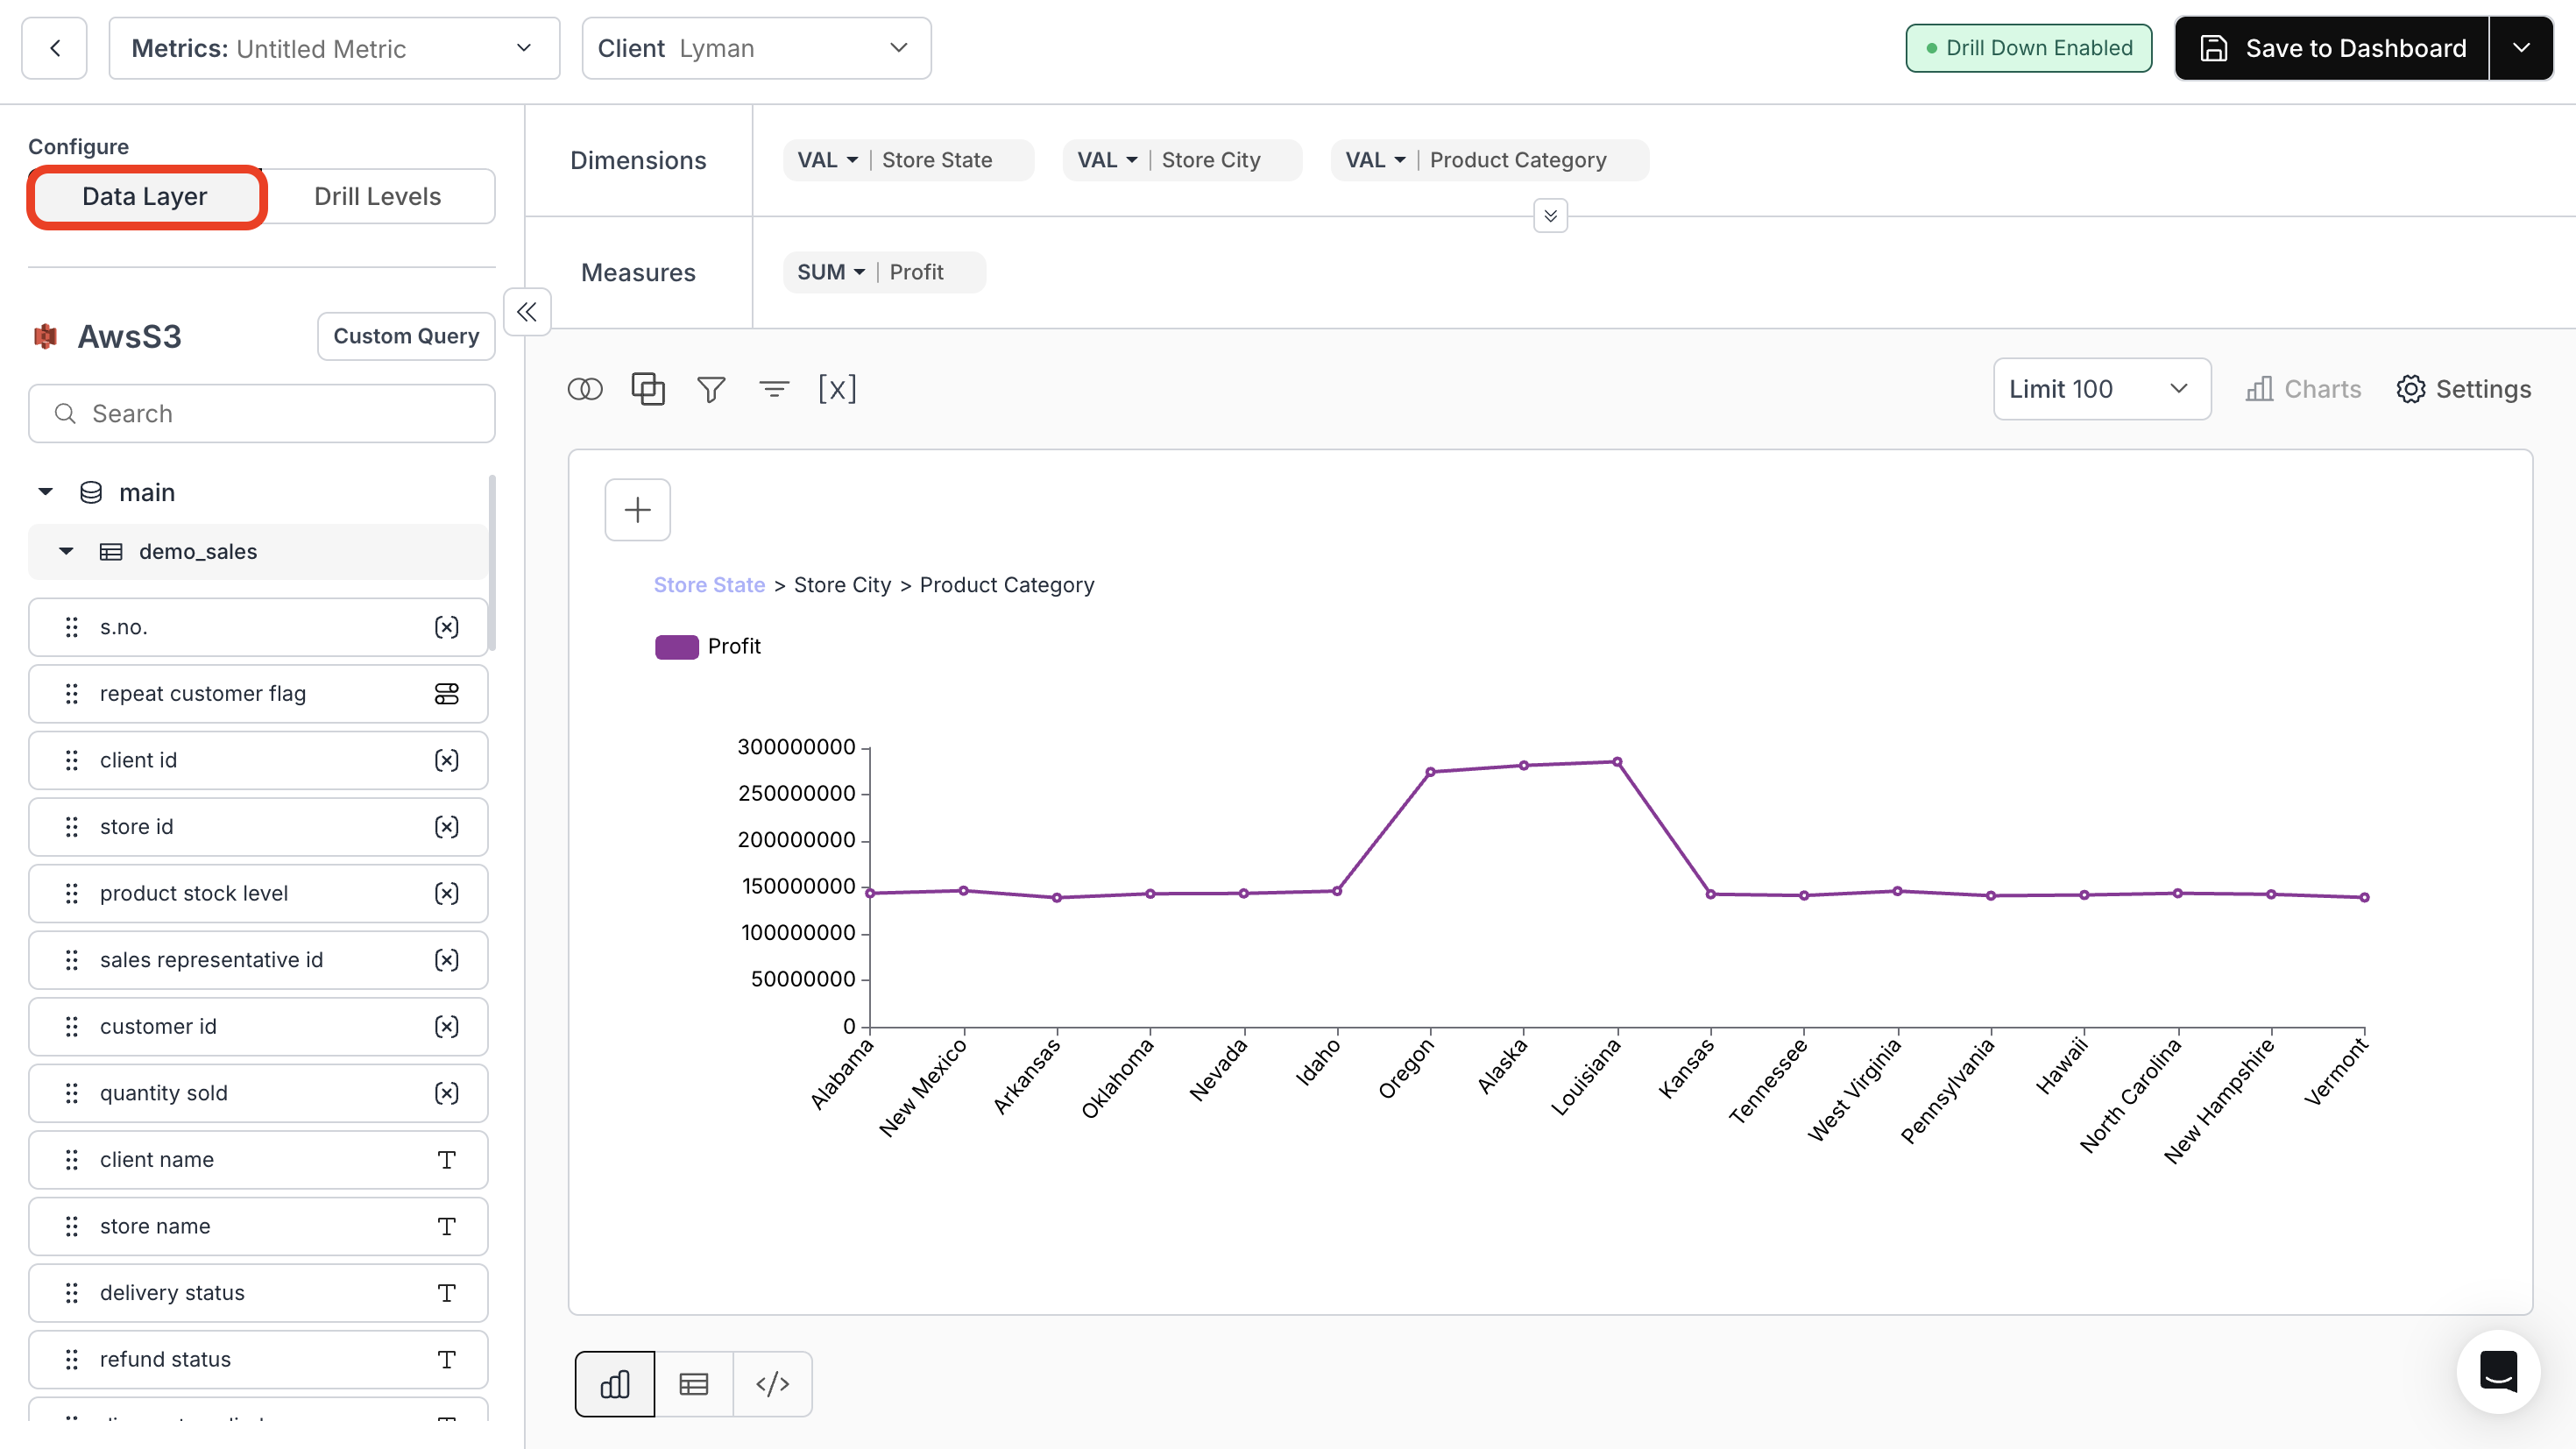
3. Configure Drill Levels
Set up all drill-down levels and define the chart settings associated with each level. With Drill-Down 2.0, each level can have its own:- Chart type — switch from a bar chart at level 1 to a line chart at level 2 to a table at level 3
- Dimensions and measures — customize which columns appear at each level
- Filters — apply level-specific filters to narrow the data further
4. Save to Dashboard
After configuring the drill-down, save the chart to your dashboard.
5. Use Drill Down in Your Chart
- Drill down: Click on any data point (e.g., a bar or pie slice) to drill into the next level.
- Drill back: Click the drilled dimension label or use the breadcrumb navigation to go back one or more levels.
- For example, drilling on Store State: “Oregon” shows its cities, and drilling on Store City: “East Kristin” shows product categories.
Common Drill-Down Patterns
Geographic Hierarchy
Time-Based Hierarchy
Product Hierarchy
Custom SQL Metrics and Drill Down
Drill-down works the same way for custom SQL metrics. The key requirement is that the columns you use in the drill hierarchy must exist in your custom SQL result set — by alias or column name. If a drill level does not appear or the drill fails:- Verify that the columns referenced in your drill levels are included in your SQL
SELECTclause. - Check that column aliases match the dimension names configured in the drill hierarchy.
- Ensure the query returns enough data for the hierarchy to be meaningful.
total_revenue as the measure.
Supported Chart Types
- Table chart
- Line chart
- Step chart
- Bar & Bar Stack Chart (horizontal & vertical)
- Combo Single-scale and Multi-scales (horizontal & vertical)
- Area Charts (Area, Stacked Area)
- Pie/Doughnut/Rose charts
- Histogram
- Scatter plot
- Bubble chart
- Waterfall chart (including Waterfall V2)
- Network chart
- Tree map
- Bullet chart
Troubleshooting
Drill down option is grayed out or missing
Drill down option is grayed out or missing
Cause: The chart type is not supported, or the metric does not have enough dimensions.Fix:
- Switch to a supported chart type.
- Ensure the metric has at least two dimensions and at least one measure (aggregate).
Nothing happens when I click a data point
Nothing happens when I click a data point
Cause: Drill down is not enabled or the data layer is not configured.Fix:
- Confirm Drill down is toggled on in Settings > Actions.
- Check the Data Layer has at least two dimensions in the correct order.
- Save the metric to the dashboard after configuring drill-down.
Wrong level or wrong order of dimensions
Wrong level or wrong order of dimensions
Cause: Dimensions are in the wrong order in the data layer.Fix: Reorder dimensions in the Data Layer: the first dimension is the top level (broadest), the next is the first drill (more detail), and so on.
Drill down fails on a custom SQL metric
Drill down fails on a custom SQL metric
Cause: The drill hierarchy references columns that don’t exist in the SQL result.Fix:
- Verify that all hierarchy columns appear in your SQL
SELECTclause (by name or alias). - Check that the aliases match exactly what is configured in the drill levels.
- Run the query standalone to confirm it returns the expected columns.
Table drill-down returns too many rows
Table drill-down returns too many rows
Cause: Table drill-down removes the GROUP BY and shows individual rows matching the drilled value.Fix:
- This is expected behavior — table drill shows raw detail rows.
- For large datasets, consider adding filters at the drill level to limit results, or use a non-table chart type for drill levels that may return many rows.
Cross-dashboard drill not updating other metrics
Cross-dashboard drill not updating other metrics
Cause: Cross Dashboard Drill Down is not enabled, or other metrics don’t share the drilled dimension.Fix:
- Ensure Cross Dashboard Drill Down is enabled in the Actions tab.
- The drilled filter is applied to all metrics on the dashboard. For best results, ensure other metrics include the same dimension column as the drilled value.
- See Cross Dashboard Drill Down for full details.
How Drill-Down Queries Work
Understanding what happens behind the scenes can help you design better drill-down experiences:- Level 0 (initial view): Your metric runs its normal query — e.g.,
SELECT region, SUM(revenue) FROM sales GROUP BY region. - Level 1 (first drill): You click “West”. The system generates a new query that adds
WHERE region = 'West'and changes GROUP BY to the next dimension — e.g.,SELECT country, SUM(revenue) FROM sales WHERE region = 'West' GROUP BY country. - Level 2 (second drill): You click “USA”. Another query adds the additional filter — e.g.,
WHERE region = 'West' AND country = 'USA'and groups by the next dimension (e.g.,city).
You’ve successfully enabled Drill Down.
Your charts can now expand into deeper layers of data, helping users explore insights with precision and clarity.