What is Drill Down?
Drill Down is a functionality that allows users to interact with data visualizations dynamically. By selecting a specific data point (e.g., a bar in a bar chart), users can expand and analyze the underlying or related dimensions. It is commonly used to move from aggregated data to detailed views, such as from total revenue by region to revenue by country or city.
When to Use Drill Down?
Drill Down is ideal for datasets with hierarchical or multi-level structures, such as:
- Geographical data (e.g., Region > Country > City)
- Time-series data (e.g., Year > Quarter > Month)
- Organizational structures (e.g., Department > Team > Employee)
- Product categories (e.g., Category > Subcategory > Product)
Requirements for Enabling Drill Down
To enable and effectively use the Drill Down feature, ensure the following:
- Data Structure: The dataset must include hierarchical relationships or dimensions that can be broken down into subcategories.
- Visualization Type: Compatible visualizations include bar charts, line charts, pie charts, and any other visualizations supporting hierarchical data.
- Metric Page Settings: The dataset used in the metric page must have the dimensions correctly set up for hierarchical analysis.
1. Enable Drill Down
On the metric page, click the “Settings” icon, go to the “Actions” tab, and turn on the “Drill down” toggle.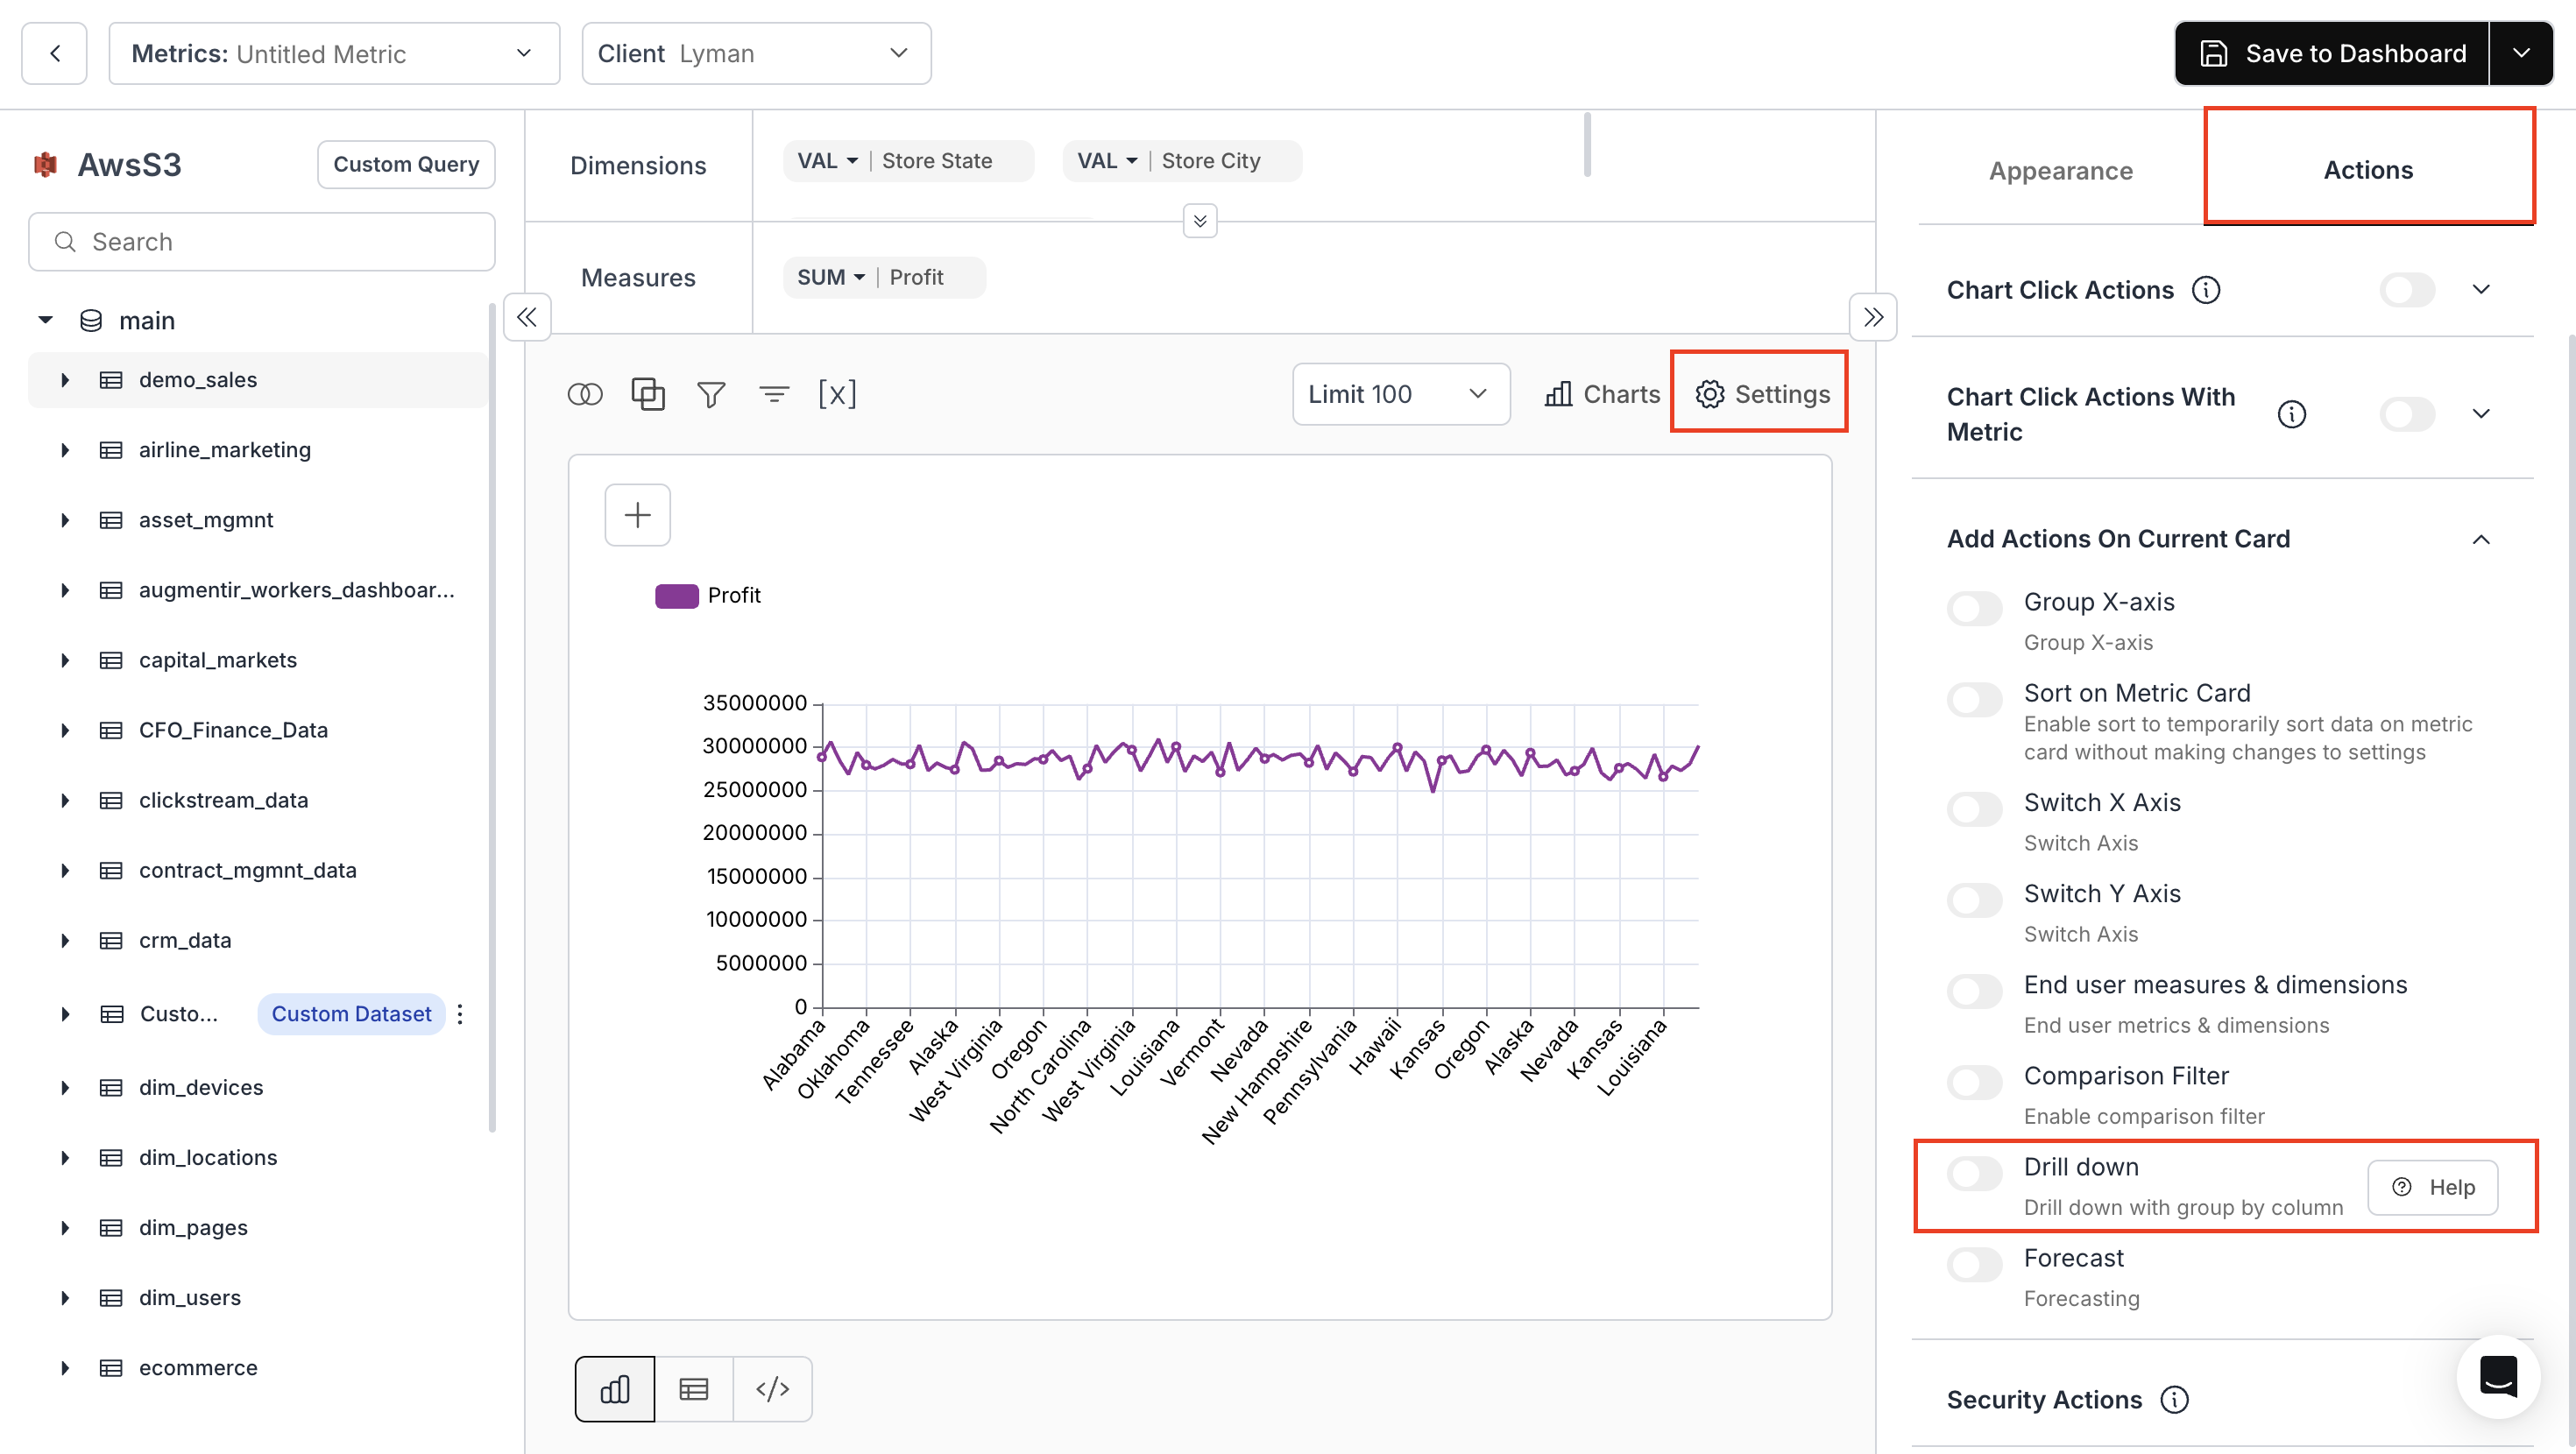
2. Configure the Data Layer
Drag and drop the dimensions you want to use for drill-down.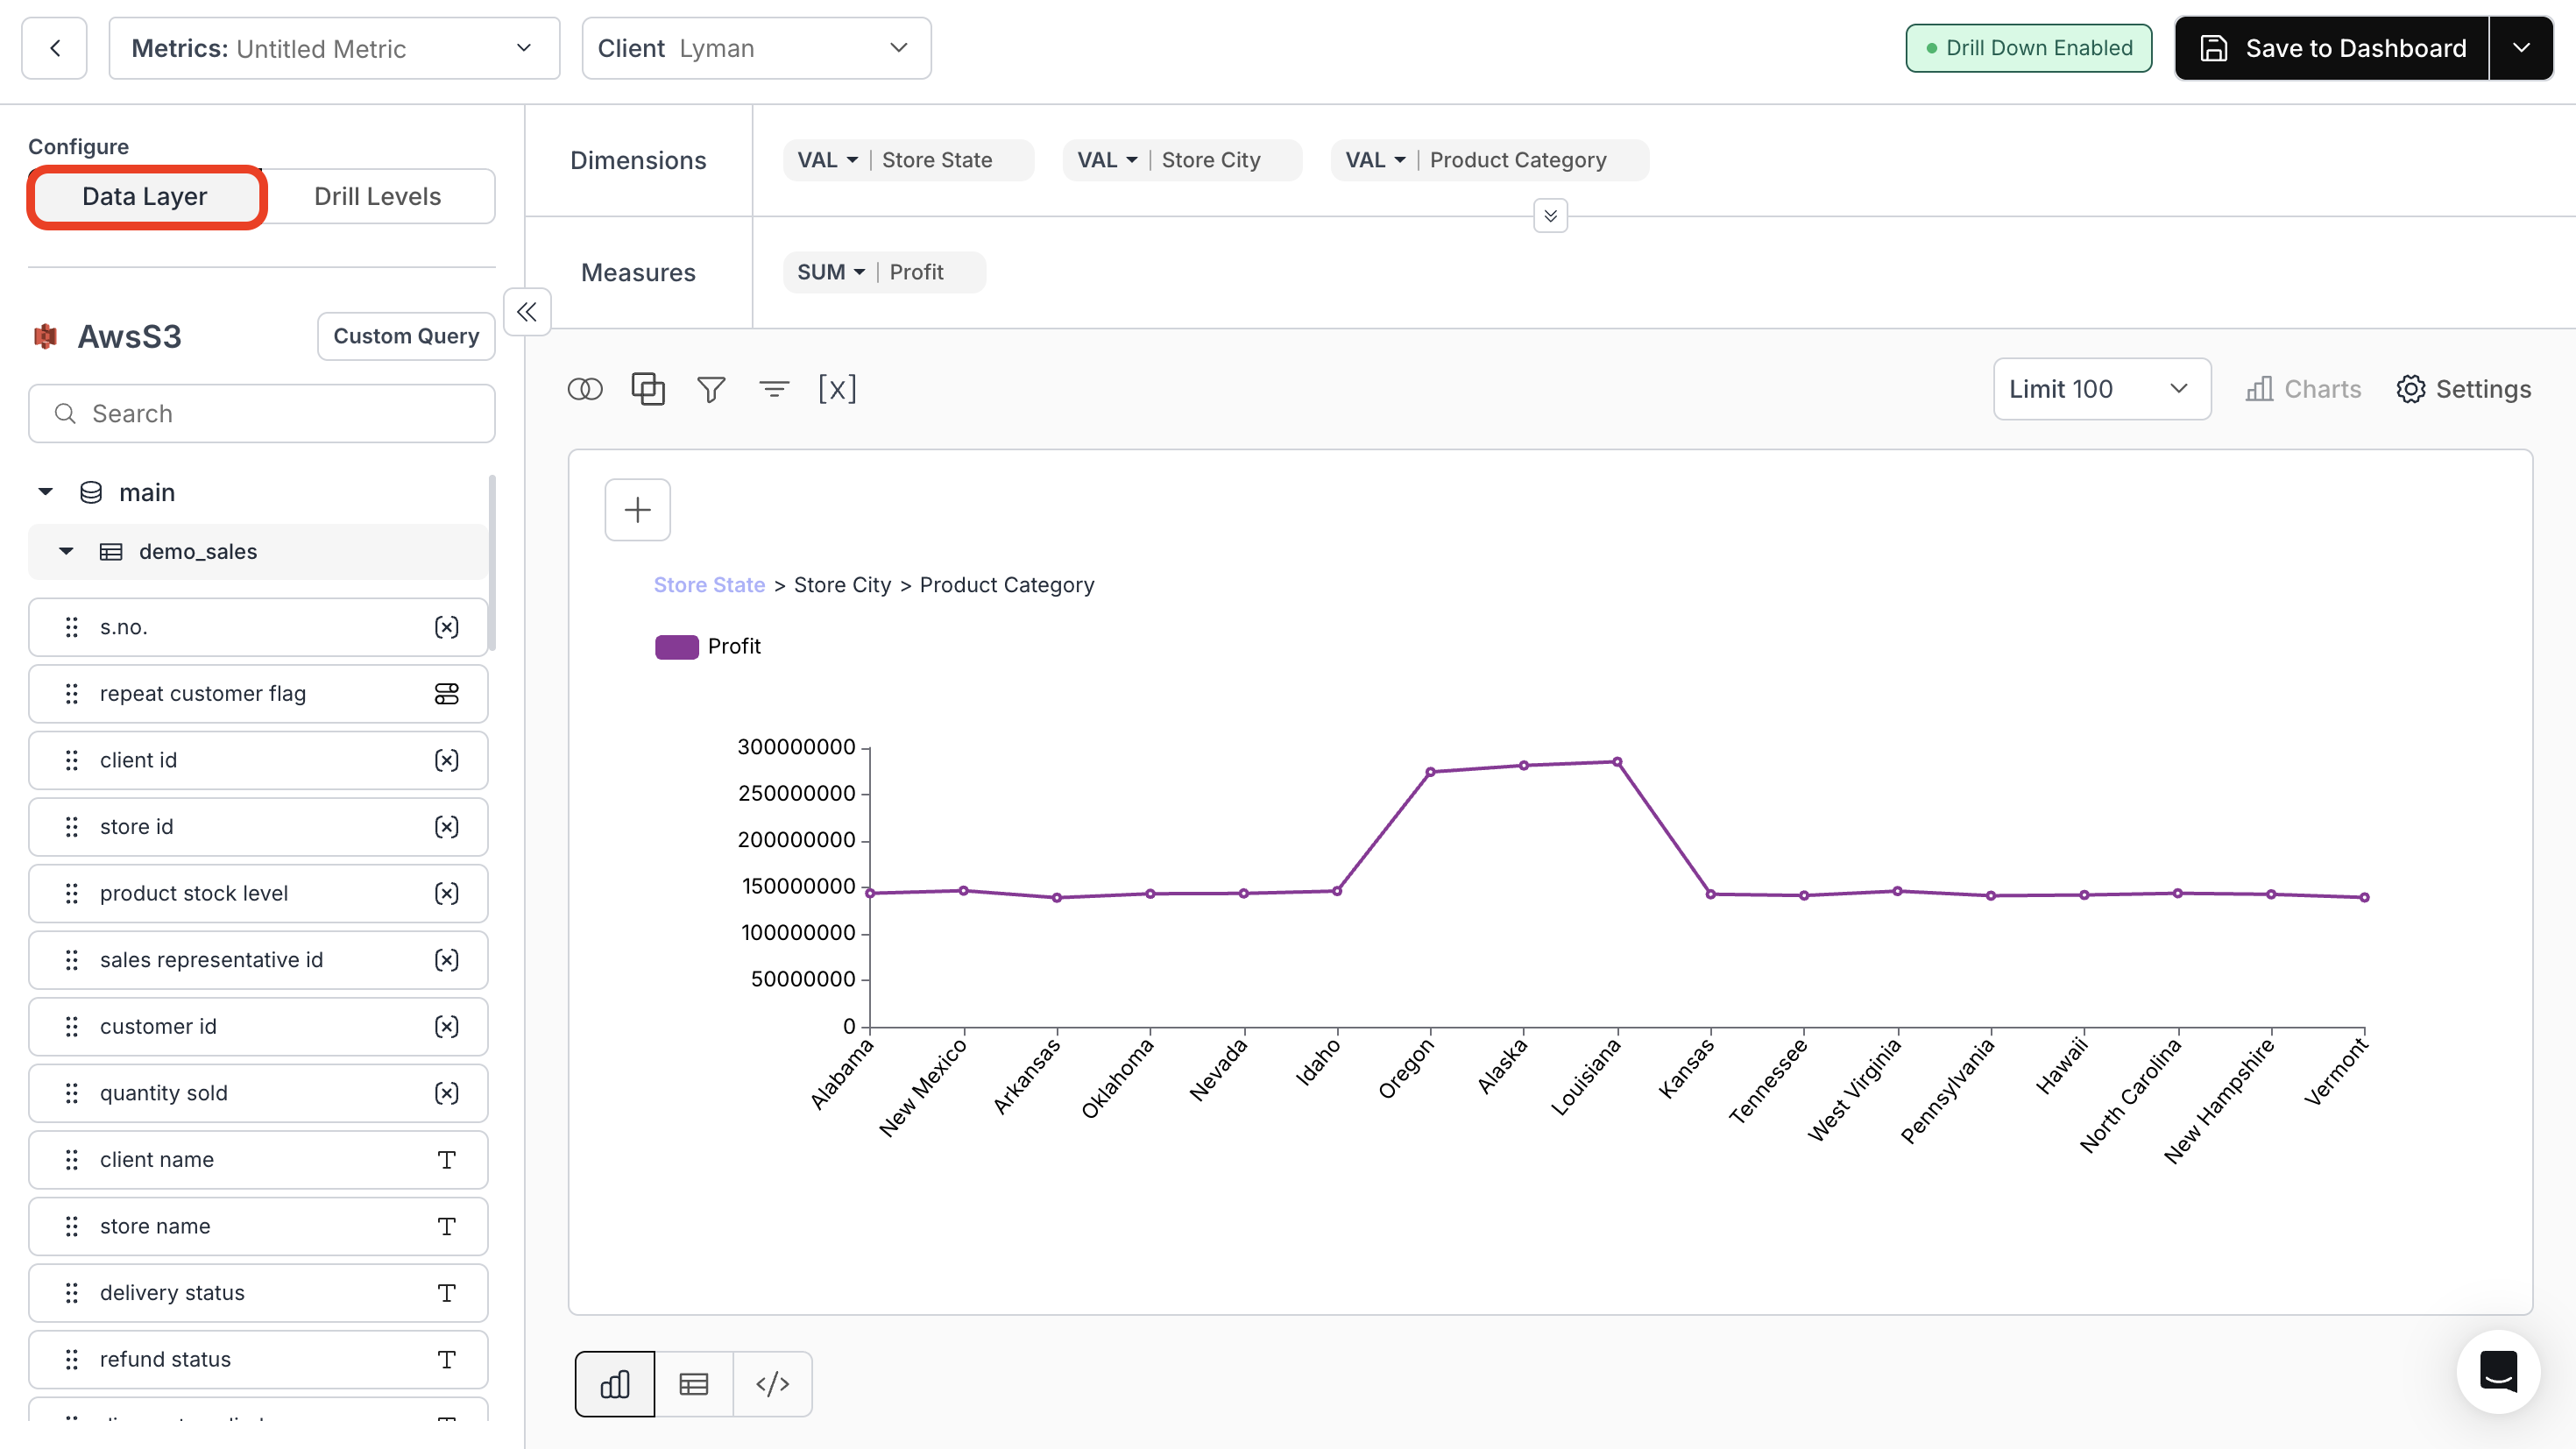
3. Configure Drill Levels
Set up all drill-down levels and define the chart settings associated with each level.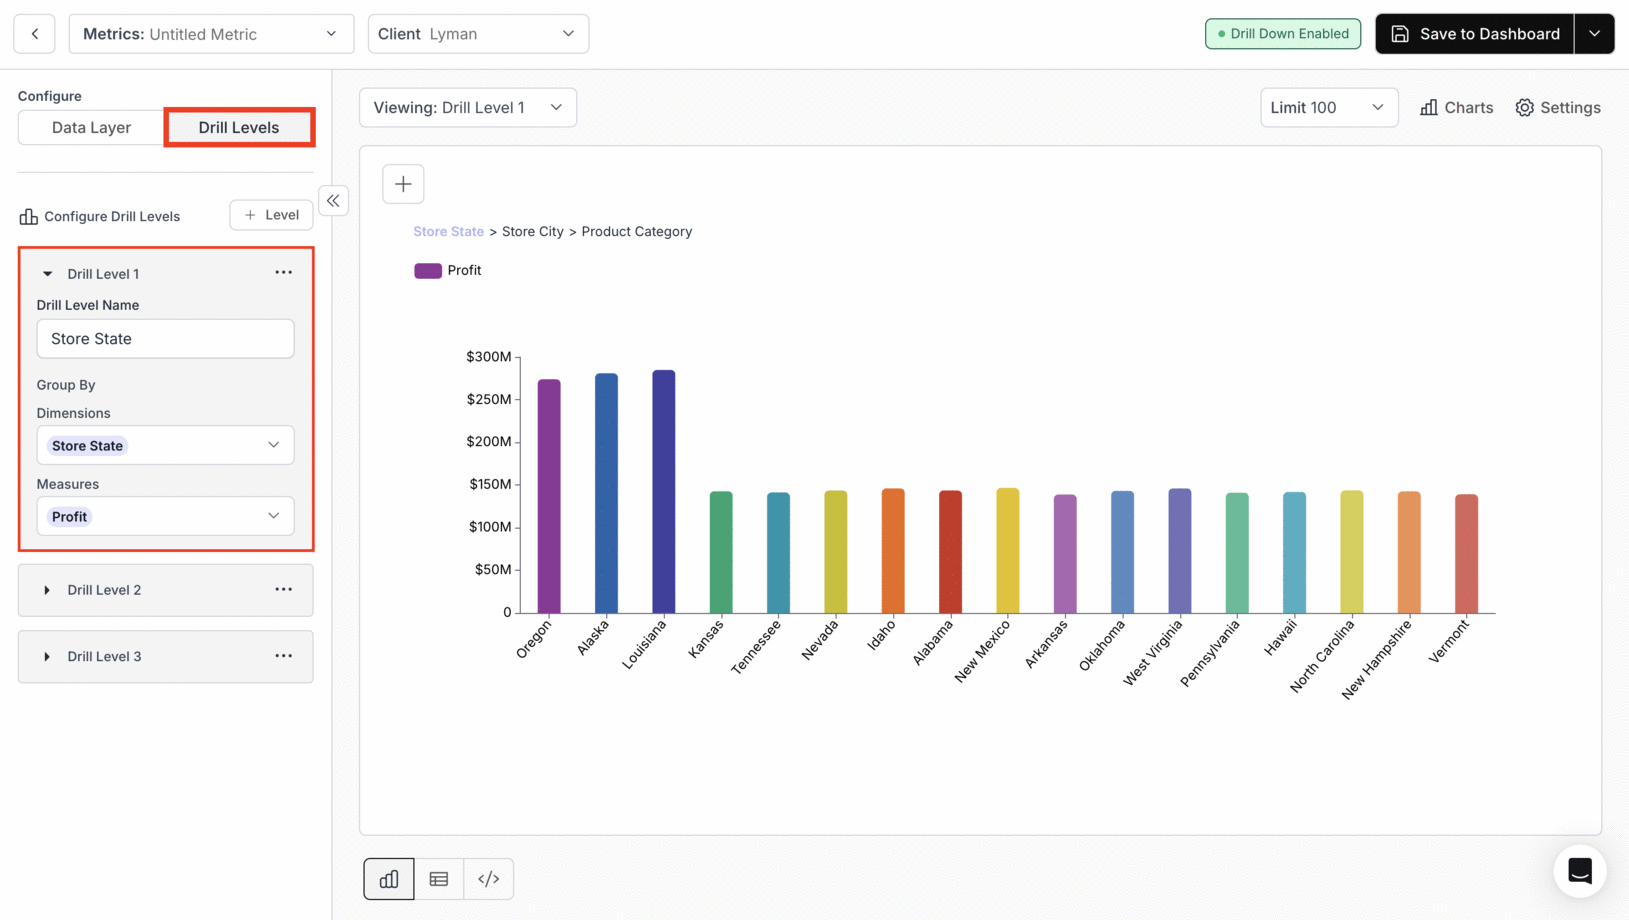
4. Save to Dashboard
After configuring the drill-down, save the chart to your dashboard.
5. View Drill-Down in Your Chart
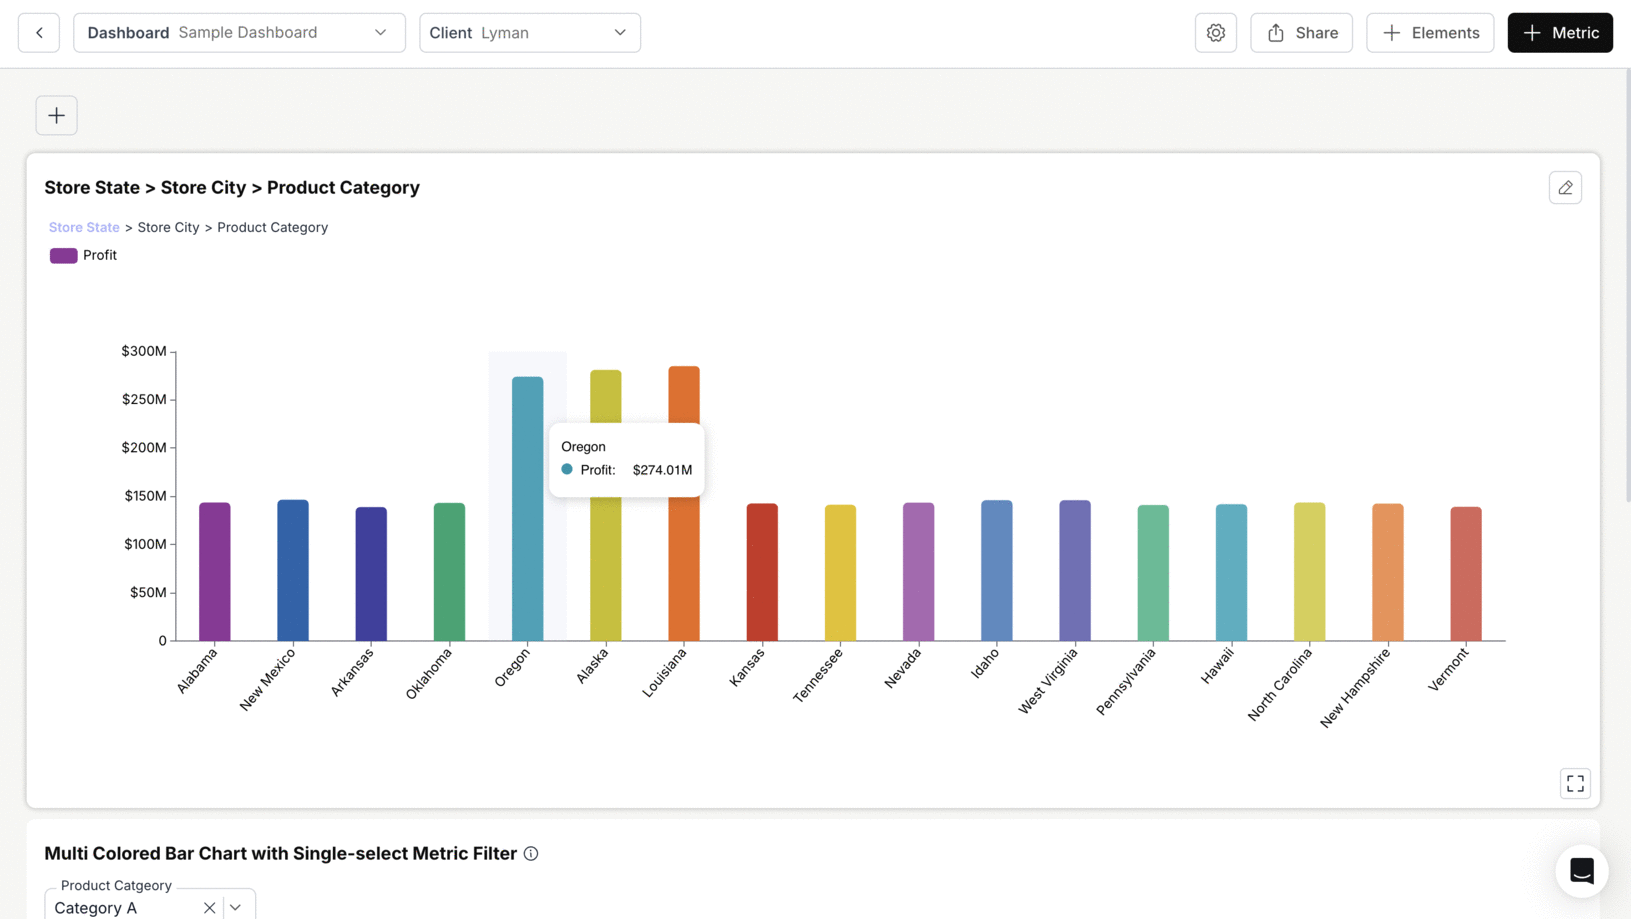
- Click on any dimension in the chart to drill down into it.
- For instance, the dimension >Store State: “Oregon”< is drilled down to its corresponding cities, and the dimension >Store City: “East Kristin”< is further drilled down to its specific product categories.
You’ve successfully enabled Drill Down.
Your charts can now expand into deeper layers of data, helping users explore insights with precision and clarity.
Your charts can now expand into deeper layers of data, helping users explore insights with precision and clarity.