Guides
Visit our websiteDeveloper Docs
  • Getting Started with Databrain
    • What is Databrain?
  • ❄️Onboarding & Configuration
    • 📝Sign-Up
    • ✍️Sign-In
    • ✏️Google Sign In Setup for Self-hosted app
    • 🤔Forgot password? Recover your Databrain Account
    • 🌟Onboarding
    • 💾Add a Data Source
    • 🧑Configure Tenants
    • 🆕Create a Workspace
    • 🔓Create a Private Workspace
    • 🆕Create a Dashboard
    • 💠Create a Metric
      • Create Custom Columns
      • Create a Metric using Chat Mode
      • Create a Metric using Custom SQL
    • Workspace Settings
      • General Settings
      • Access Control Settings
      • Cache Settings
      • Download Settings
    • 🗄️Explore Data
  • 🛢️Datasources
    • Connecting Data Sources to Databrain
      • Amazon Redshift
      • Snowflake
      • BigQuery
      • MySQL
      • Postgres
      • MongoDB
      • ElasticSearch
      • DataBricks
      • ClickHouse
      • MSSQL
      • Amazon S3
      • CSV
      • Firebolt
      • SingleStore
      • Athena
    • Allow Access to our IP
    • Add a Data Source
    • Configure Tenants
    • How to Sync a Data Source
    • Edit Tenancy
    • Create a Datamart
    • Semantic Layer
    • Create a Data App
    • Creating a Custom Dataset/View in a Multi-Datasource Environment
  • Workspace
    • Multi Datasource Workspace
  • 🔍DASHBOARDS
    • Edit a Dashboard
    • Share Dashboard
    • Dashboard Settings
    • Create/Modify Dashboard Filter
      • Dashboard Filter - Variable Apply On
      • Add LHS and RHS custom sql support for dashboard filter
    • Customize Layout
    • Adding Elements to Dashboard
    • Import/Export Dashboard
    • Report Scheduler
  • 📉METRIC
    • Edit a Metric
    • Joins , Filter, Sort, Group By
    • Complex Filter
    • Apply Metric Filter
      • Metric Filter - Variable
      • Metric Filter - Custom
    • Switch X axis and Switch Y axis
    • Group By
    • Footnote and Long Description
    • Dynamic Property
    • Archive/Unarchive Metric Card
    • Download Metric Card
    • Download Underlying Data
    • Metric Summary
    • Metric Expression for Single Value Card
    • AI Summary
    • Merge Metrics
    • Section Filters
    • View Unpublished Metrics
  • 📊VISUALIZATIONS - ACTIONS & APPEARANCE
    • Chart Actions
      • Chart Click Action
      • Chart Click Action with Metric
      • Card Click Action
      • Drill Down
      • Cross Dashboard Drill Down
    • Chart Appearance
      • Chart-Specific Appearance Options
  • 🛢️PREVIEW OF DASHBOARDS
    • Email Settings for Scheduled Reports
    • Scheduled Reports for End User
  • 🔍FILTERS
    • Dashboard Filter
    • Metric Filter
    • App filter
  • 💡Features
    • Python Editor Console
    • Custom SQL Console
    • Custom SQL Query Guidelines
  • 🏢Integrating Plugin
    • ✳️Get an auth token
    • 🙏Get a guest token
  • 🛃THEMEING & CUSTOMIZATION
    • 🎨Creating a theme
    • 🖼️View the theme in action
    • ⚙️Reset a saved theme
  • 📊Metric Component (upto version v0.11.15)
    • ✨Quick start
  • 🕸️Web Components
    • ✨Quick start
    • ⚛️Framework Specific Guide
  • 🚀Product Changelog
  • 🤳Self Hosted Changelog
Powered by GitBook
On this page
  1. DASHBOARDS

Adding Elements to Dashboard

This guide provides a straightforward approach to enhancing your dashboard by adding new elements, which can improve data visualization and user engagement.

PreviousCustomize LayoutNextImport/Export Dashboard

Last updated 1 month ago

  1. Access Elements Creation

Click the "+ Elements" button in the top-right corner of the dashboard (next to the preview icon).
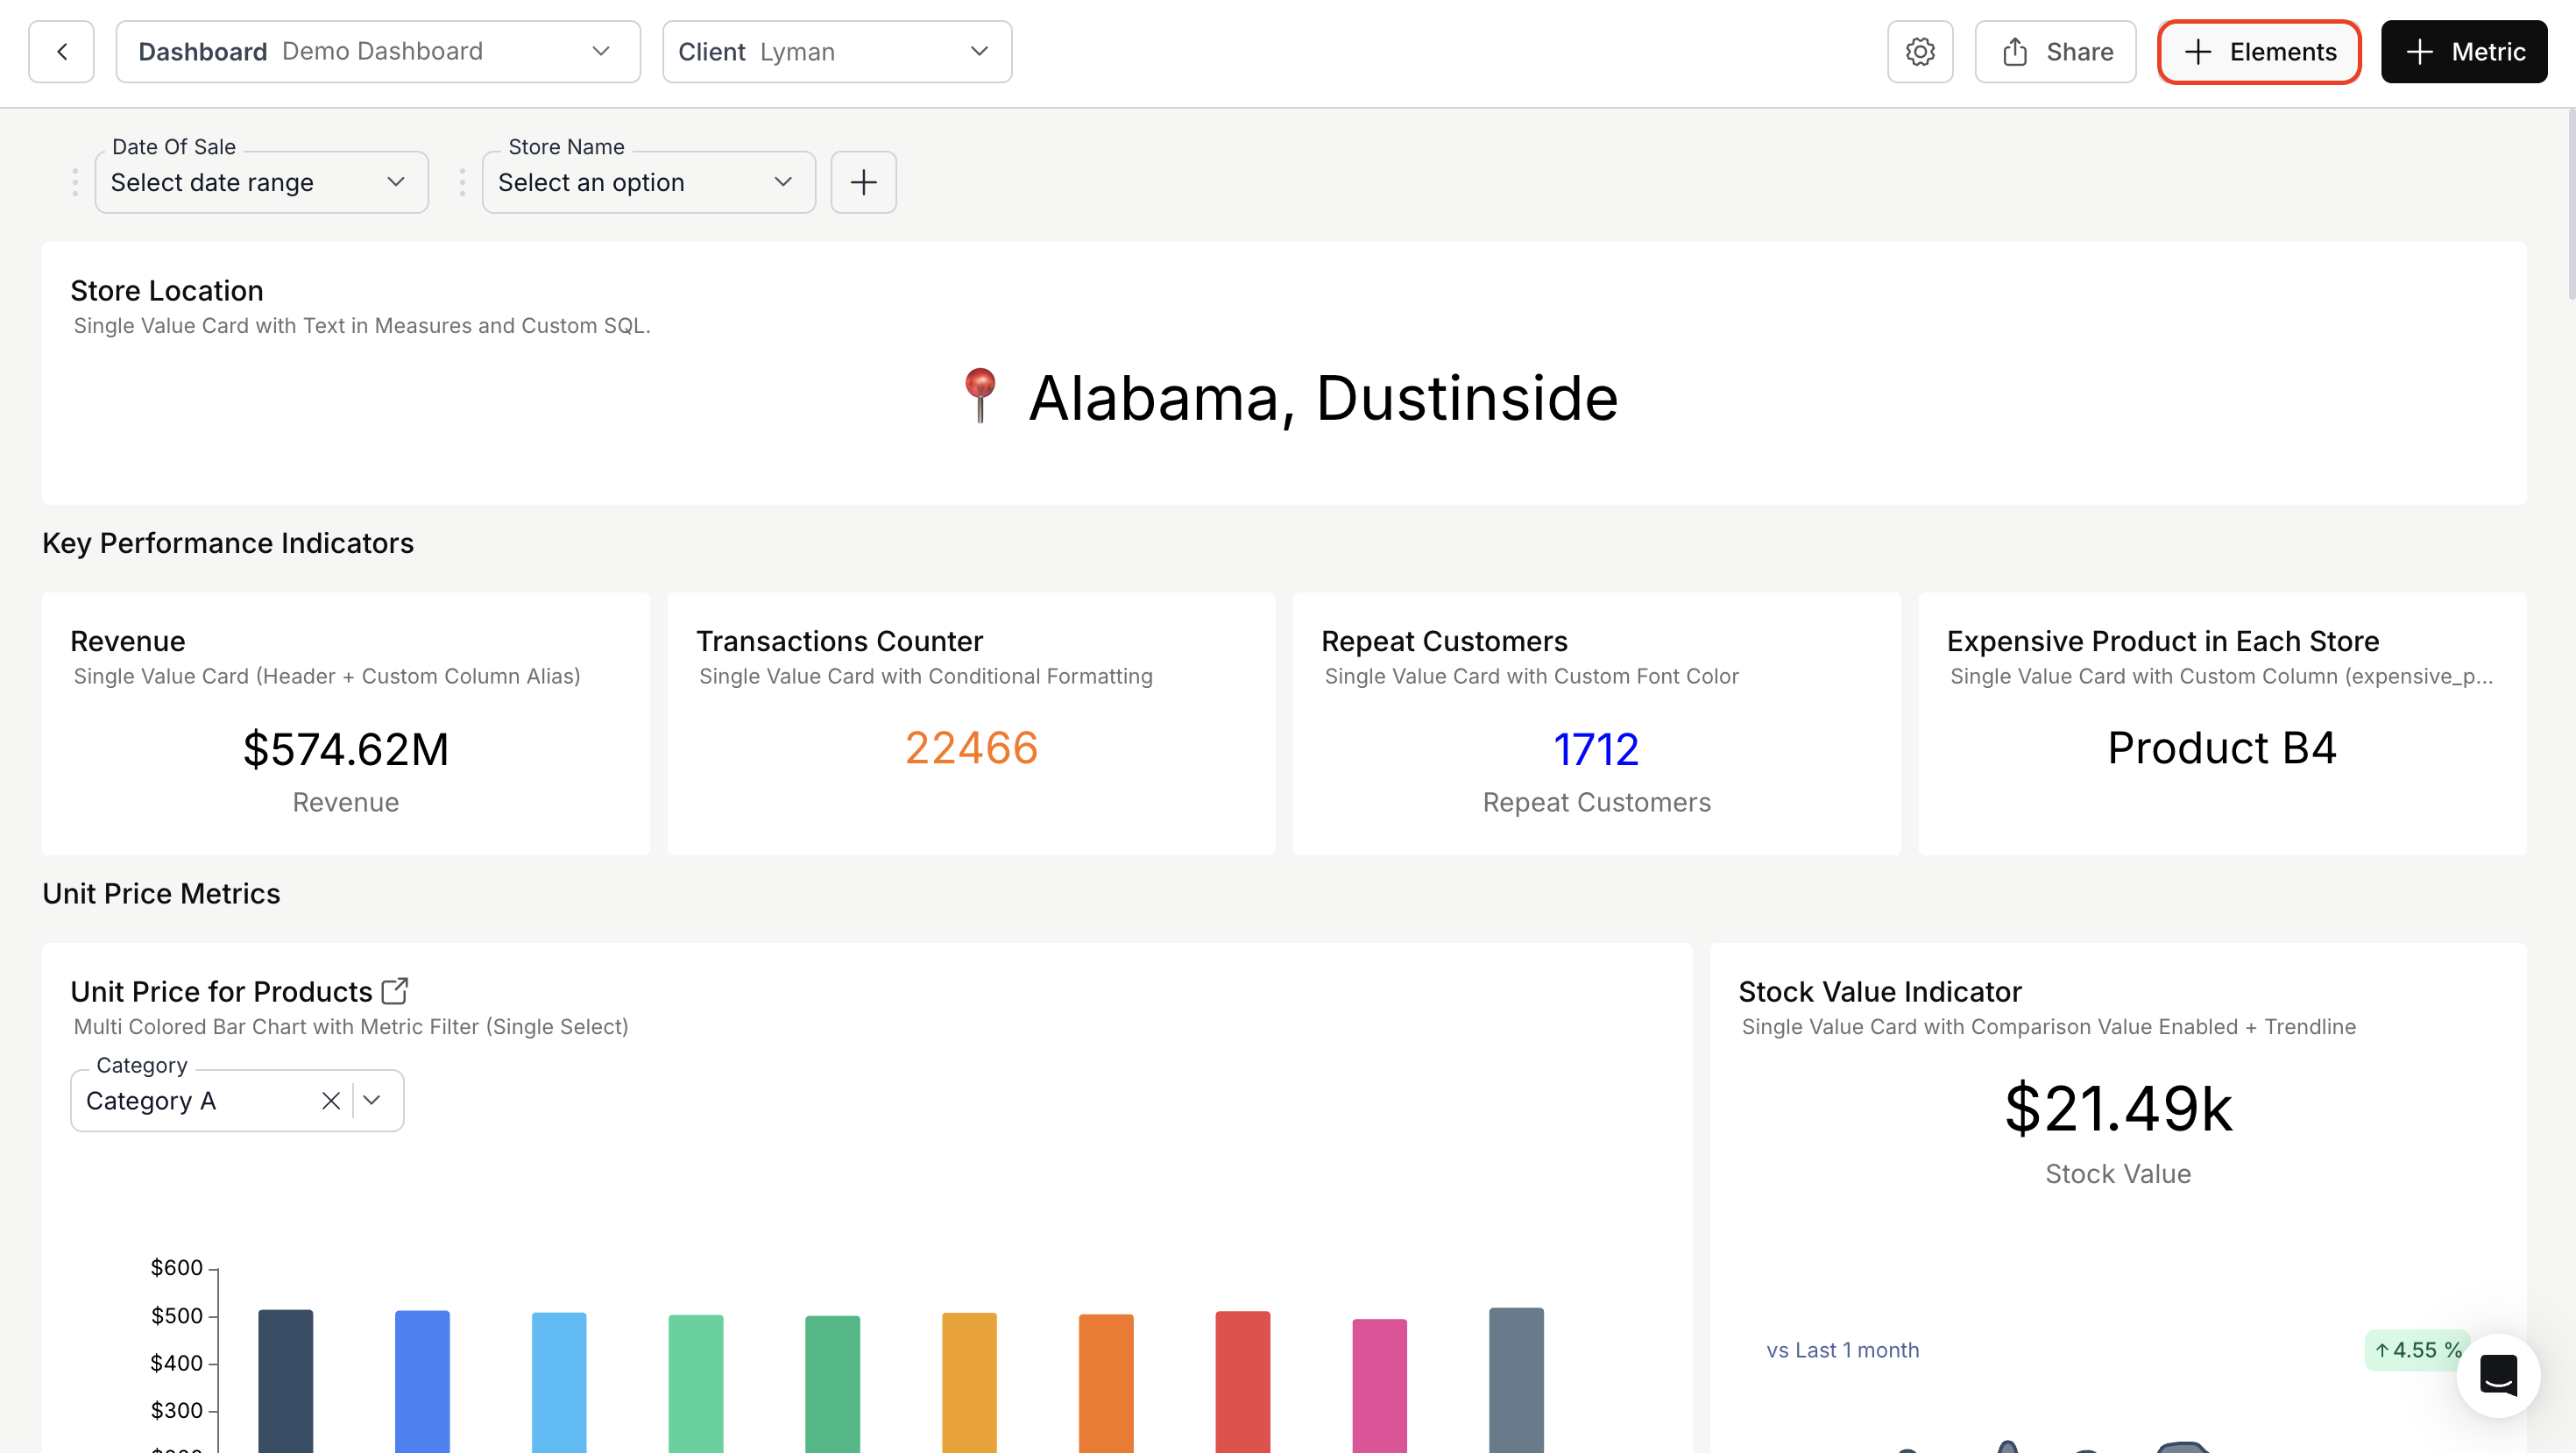
  1. Add Elements Section

  • Enter a title and description.

  • Set title and description alignment (left, center, or right).

  • Choose from the following element types:

    • Custom Text Box

    • Metric Summary

    • Metric Expression

Custom Text Box:

  • Enter the content in the text box and format using the toolbar.

  • Optionally, toggle "Merge Card to Background" if you want the element to blend with the dashboard background.

  • Click "Save" to add the element to the dashboard.

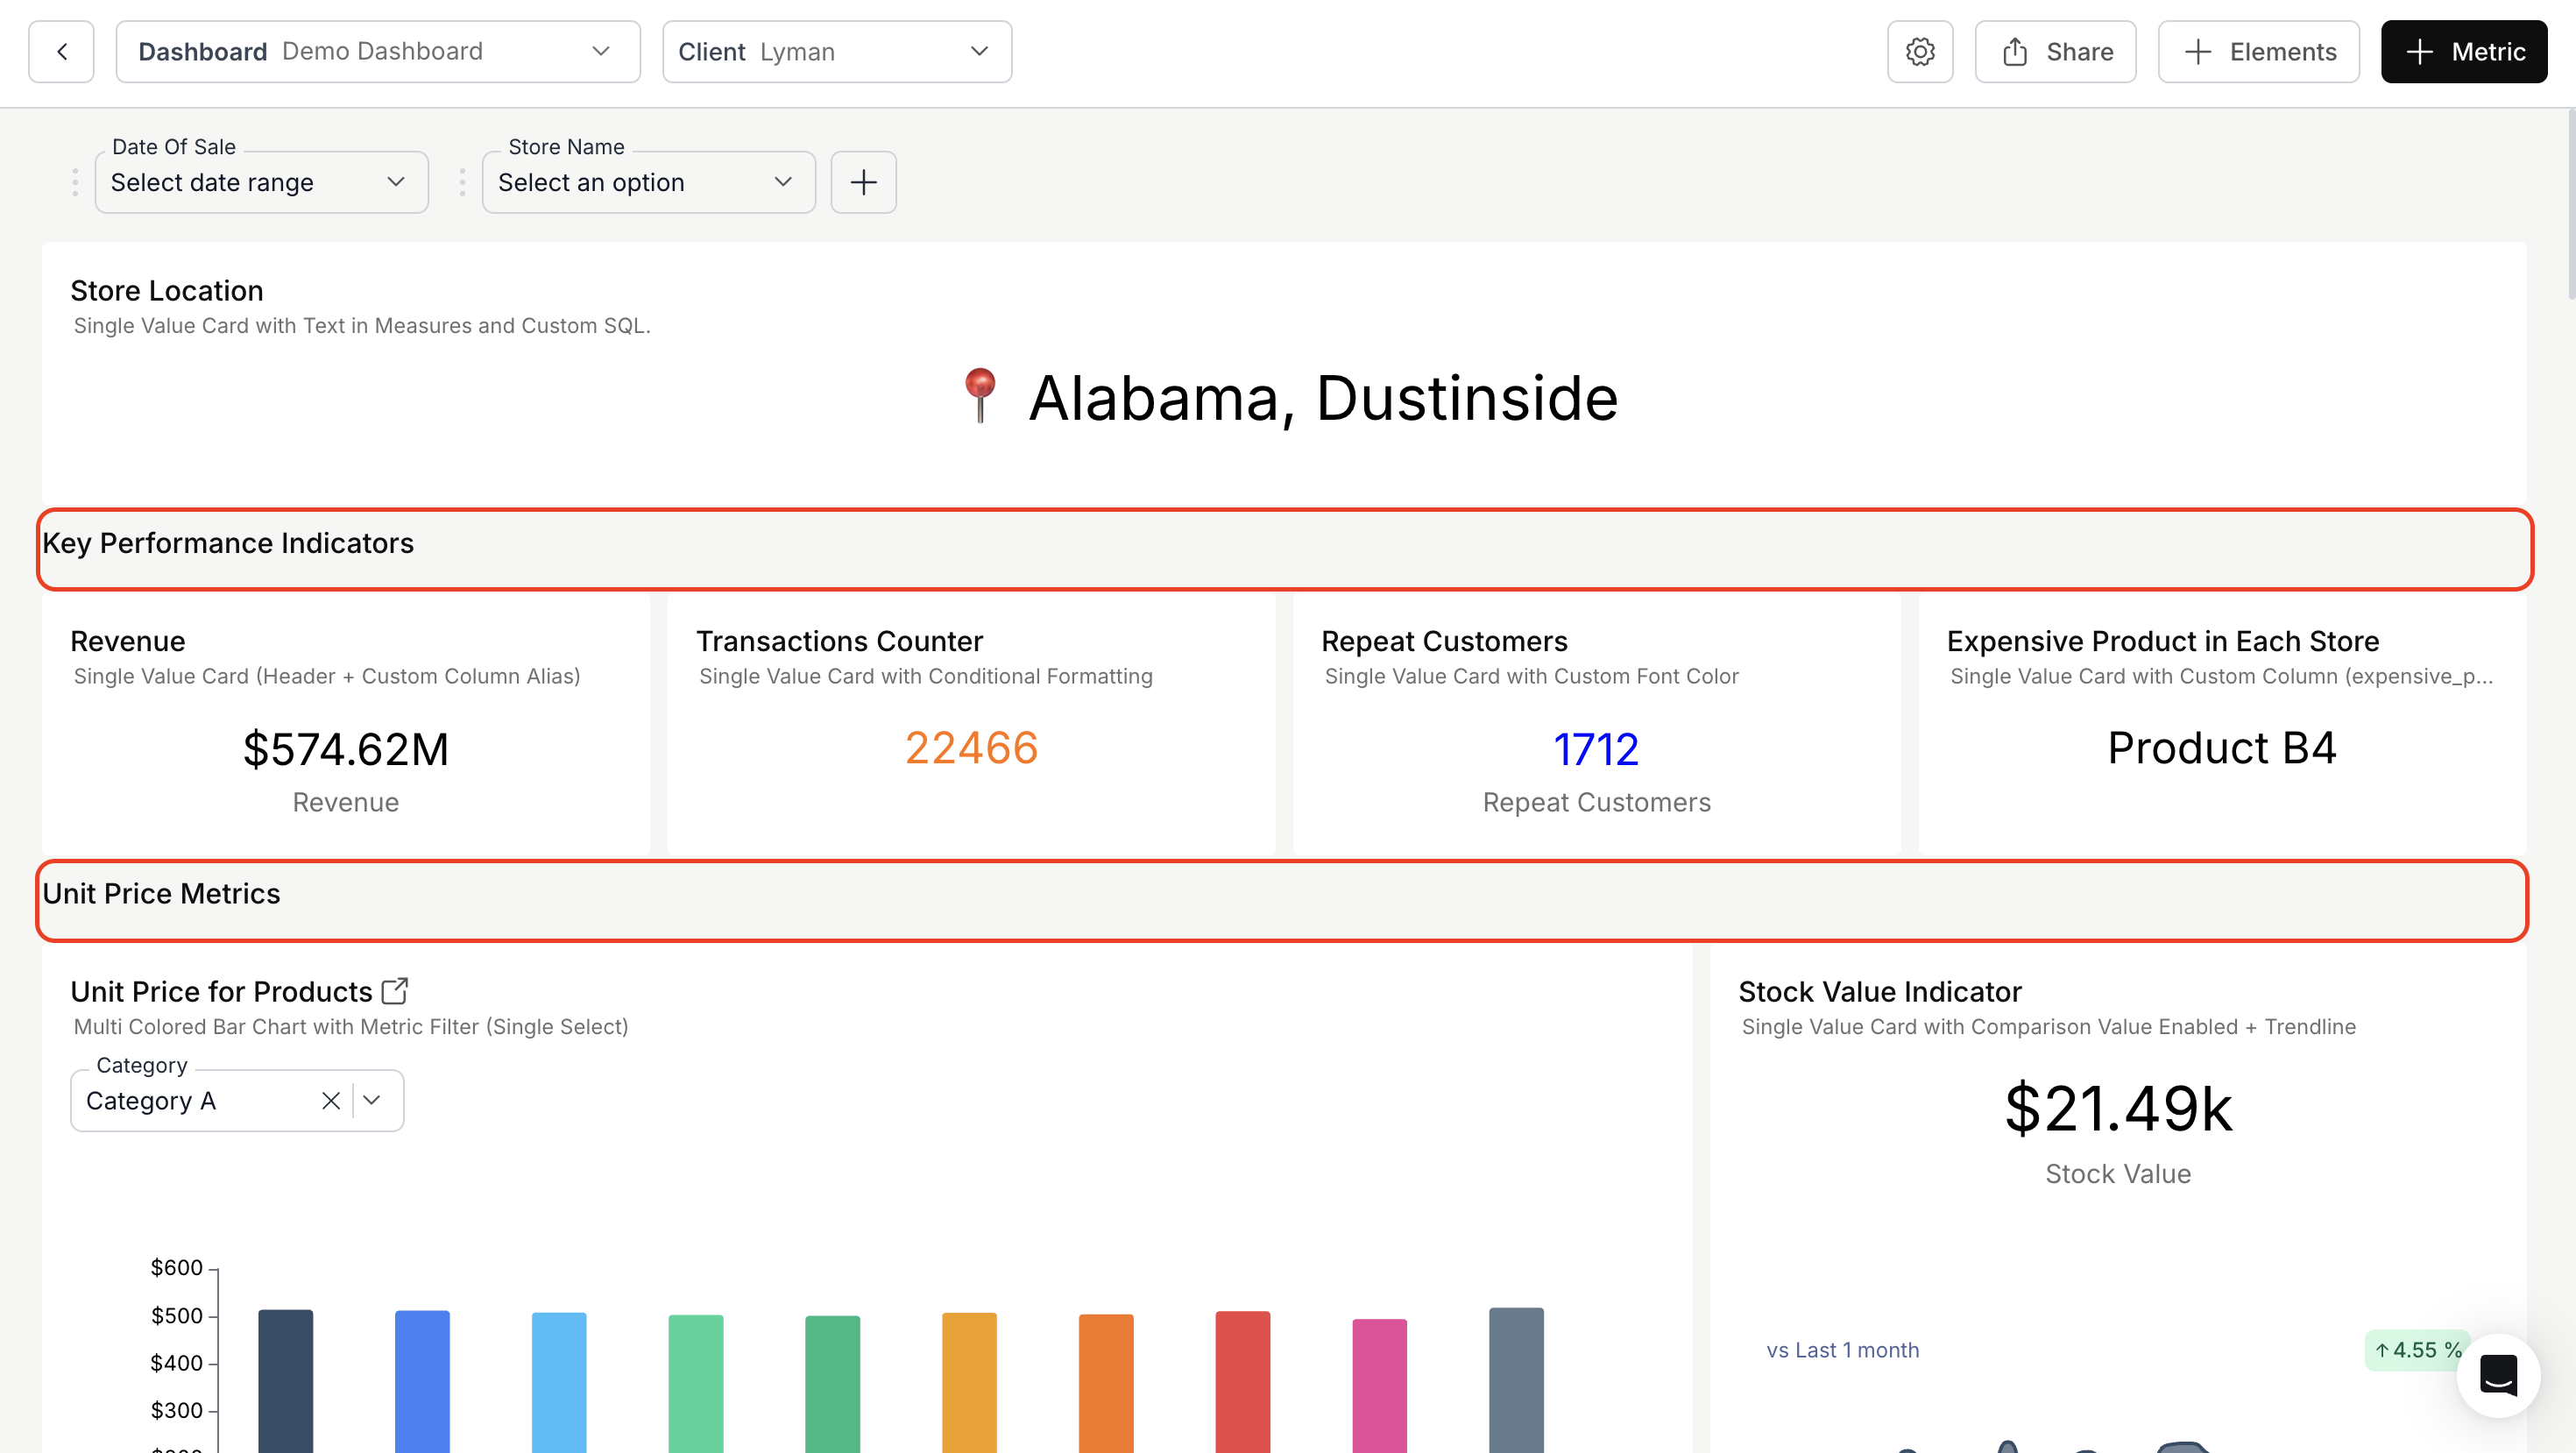
Custom Text Box Elements can be used as section separators to group relevant metrics under distinct categories. They allow intuitive, categorized data presentation.

By using Custom Text Box elements as section headers, you can group and label these sections, making it easier for users to locate specific data types and enhancing the dashboard's overall readability.

Metric Summary:

  • Select the metrics to include and enter a prompt for the summary.

  • Optionally, toggle "Merge Card to Background" if you want the element to blend with the background.

  • Click "Save" to add the element to the dashboard.

For more details on Metric Summary, kindly refer the below link:

Metric Expression:

  • Select the metrics you want to include in the "Metric Expression" textbox.

  • Use metric IDs to perform calculations and define expressions.

  • Optionally, toggle "Merge Card to Background" if you want the element to blend with the background.

  • Click "Save" to add the element to the dashboard.

For more details on Metric Expression, kindly refer the below link:

🔍
Metric Summary
Metric Expression for Single Value Card