- From the
Homepage, navigate to your desired workspace. - Click the Metrics tab in the main navigation area.
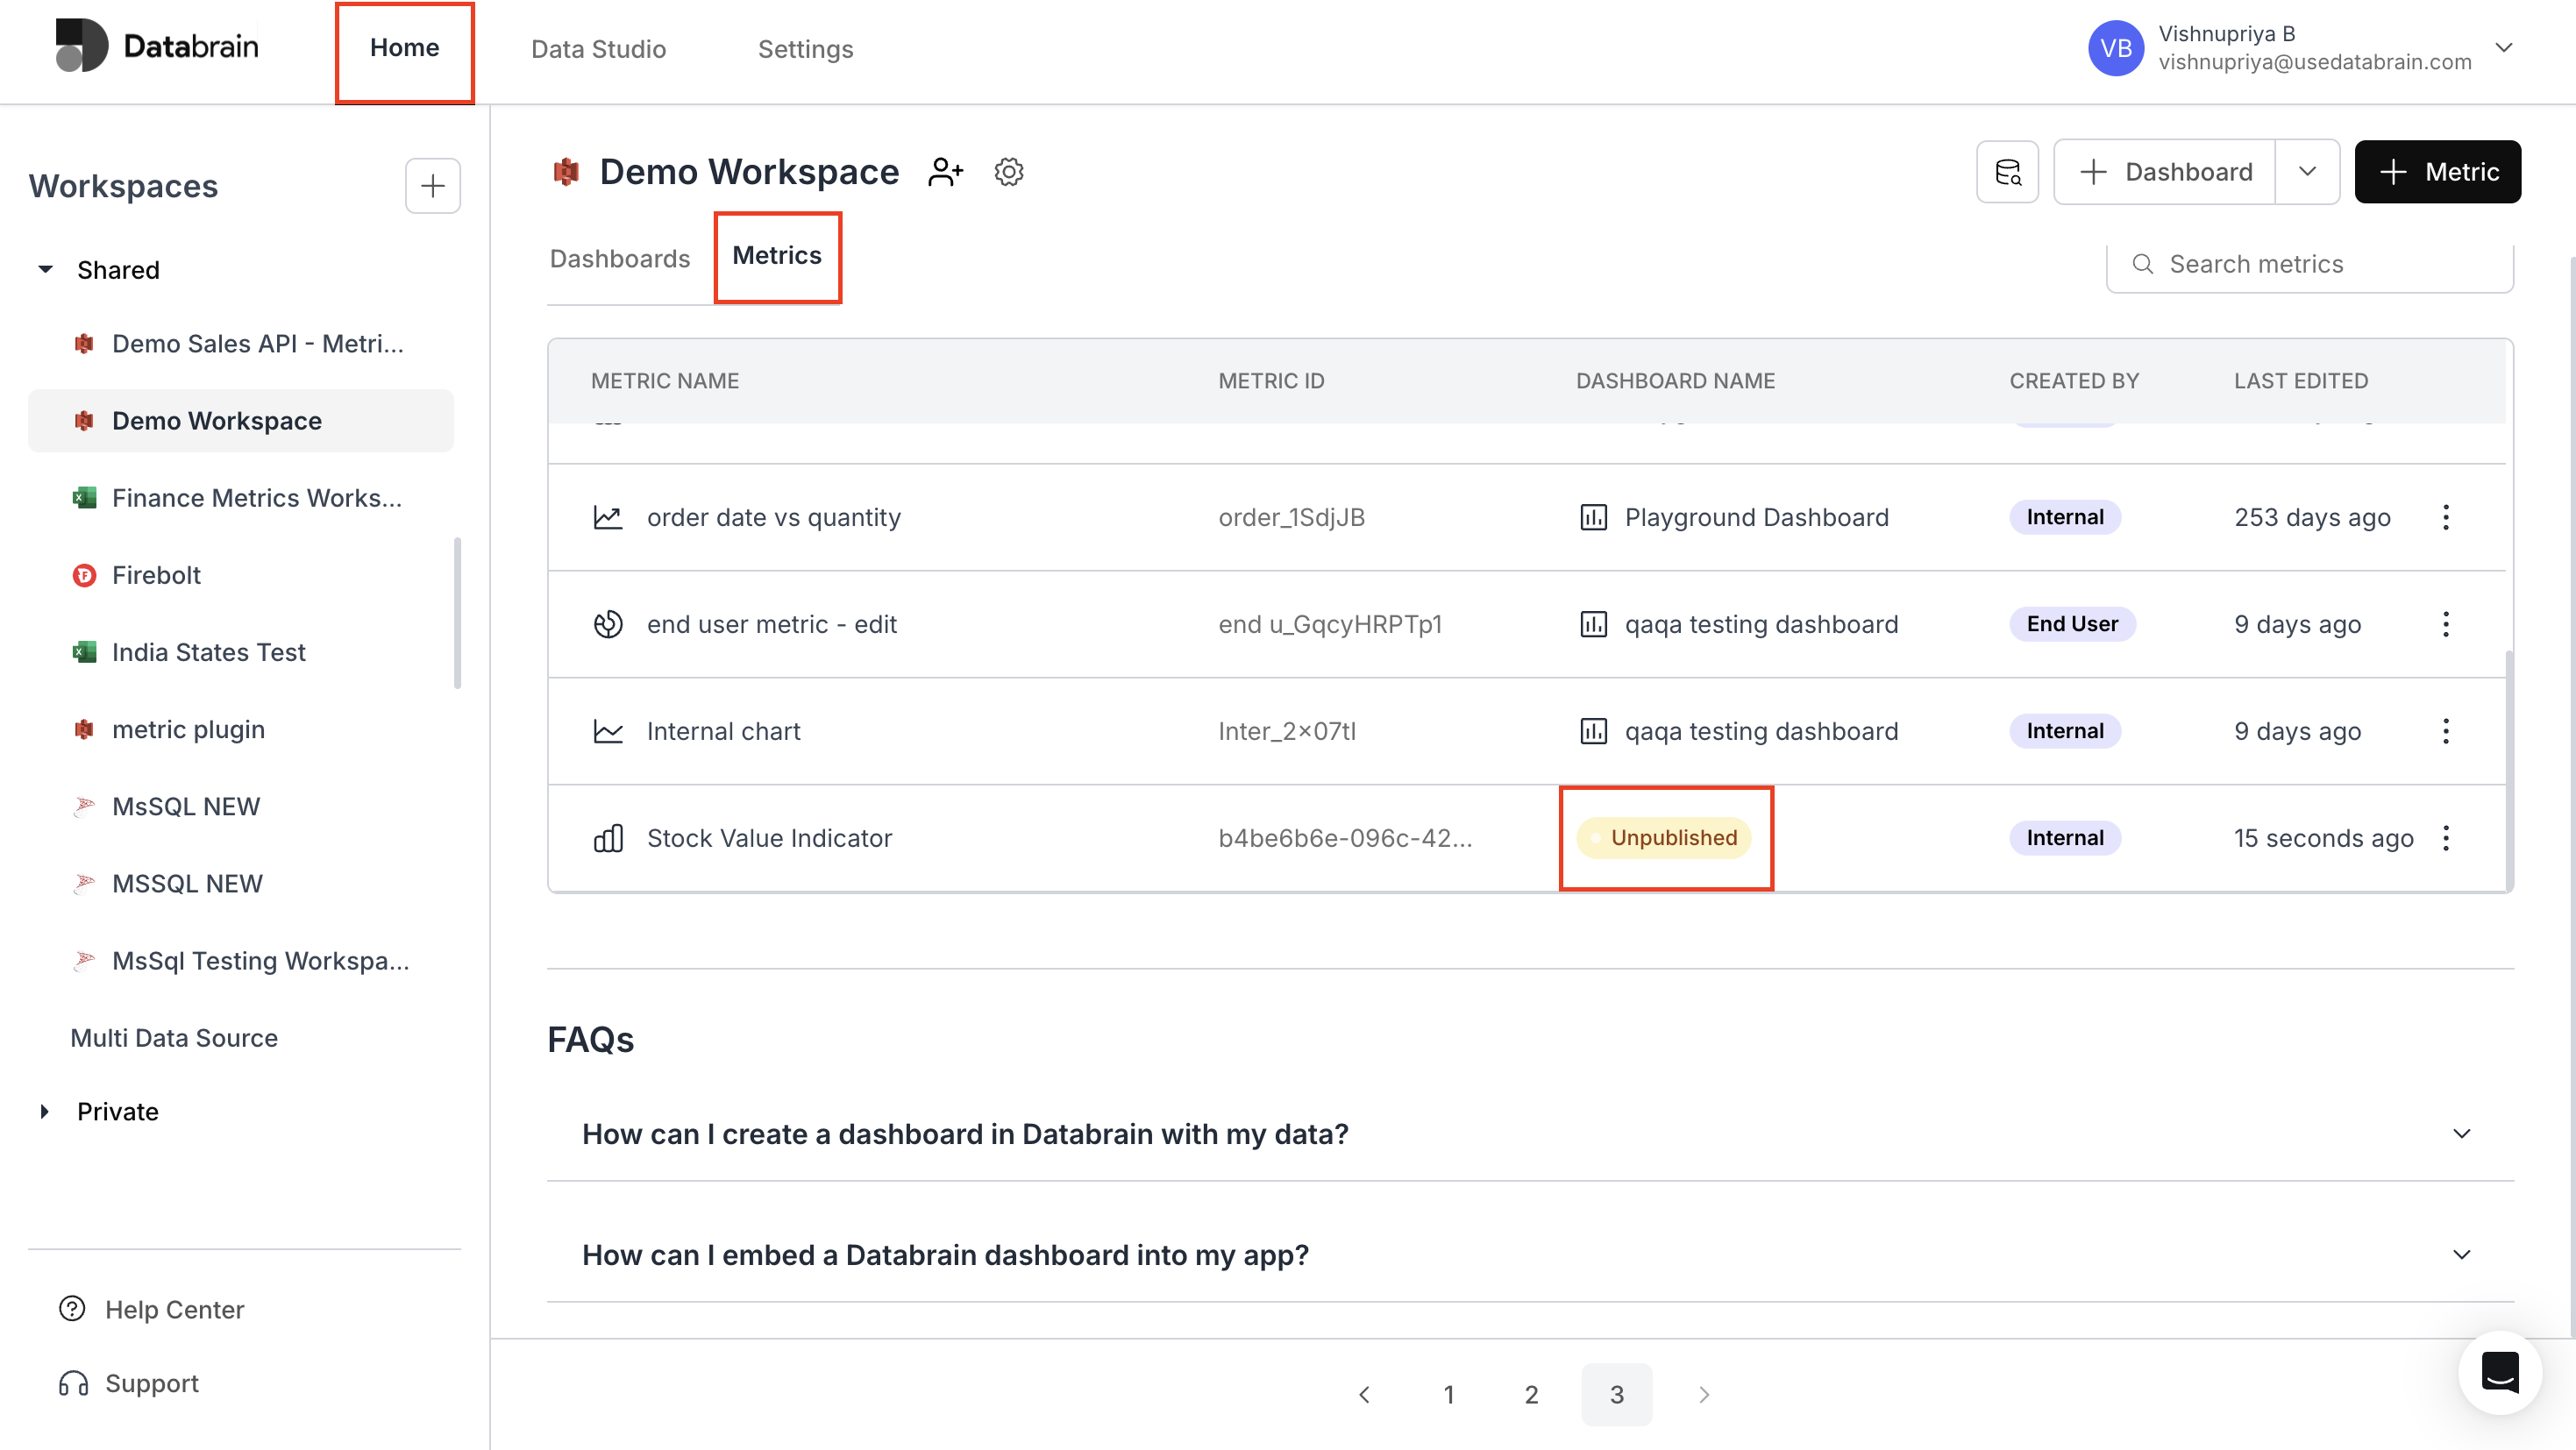
- The complete list of metrics will be displayed in a table format:
- Each row shows the metric name, ID, associated dashboard, and last edited date.
- Any metrics marked as ‘Unpublished’ in the Dashboard Name column indicate they have not been published to dashboards yet.
Regular monitoring of unpublished metrics helps maintain an organized workflow in your dashboard development process.