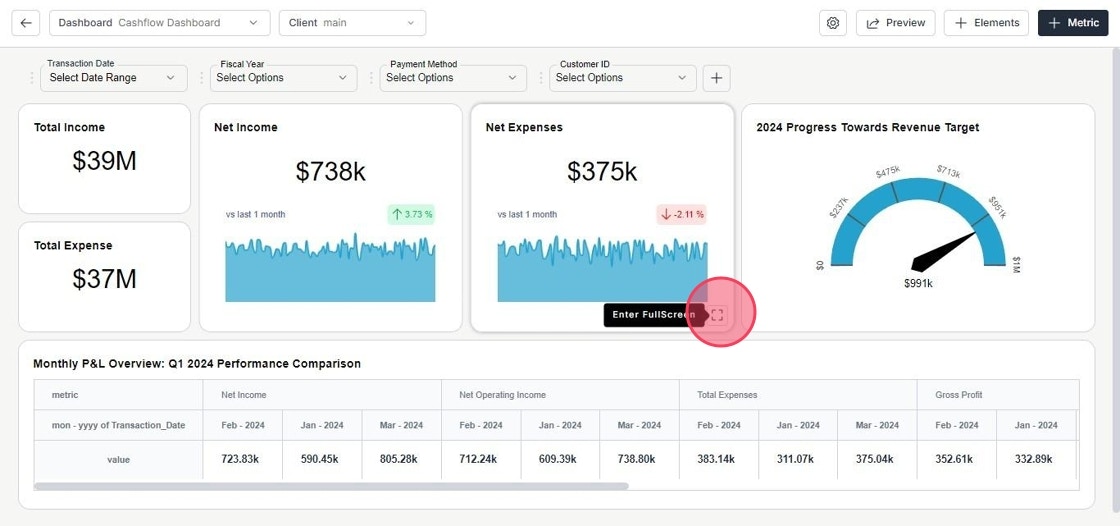
- Access Metric
Navigate to the dashboard and view the metric in full screen mode.
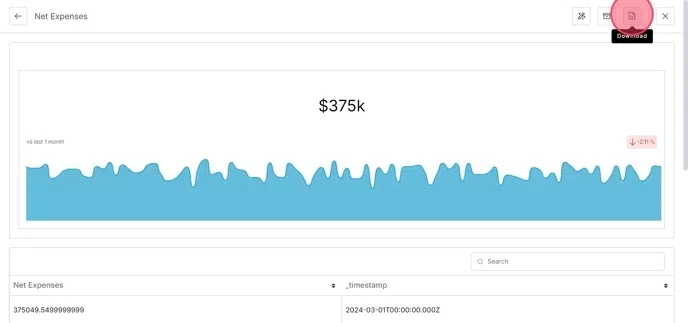
- Download Underlying Data
Click on Download icon to export the underlying data. You can choose whether to include or exclude any filters applied.
This guide provides a straightforward process for accessing and downloading underlying data from a dashboard, allowing users to analyse metrics in detail.