1. Access the Custom SQL
On the Create Metric page, select the “Custom Query” option.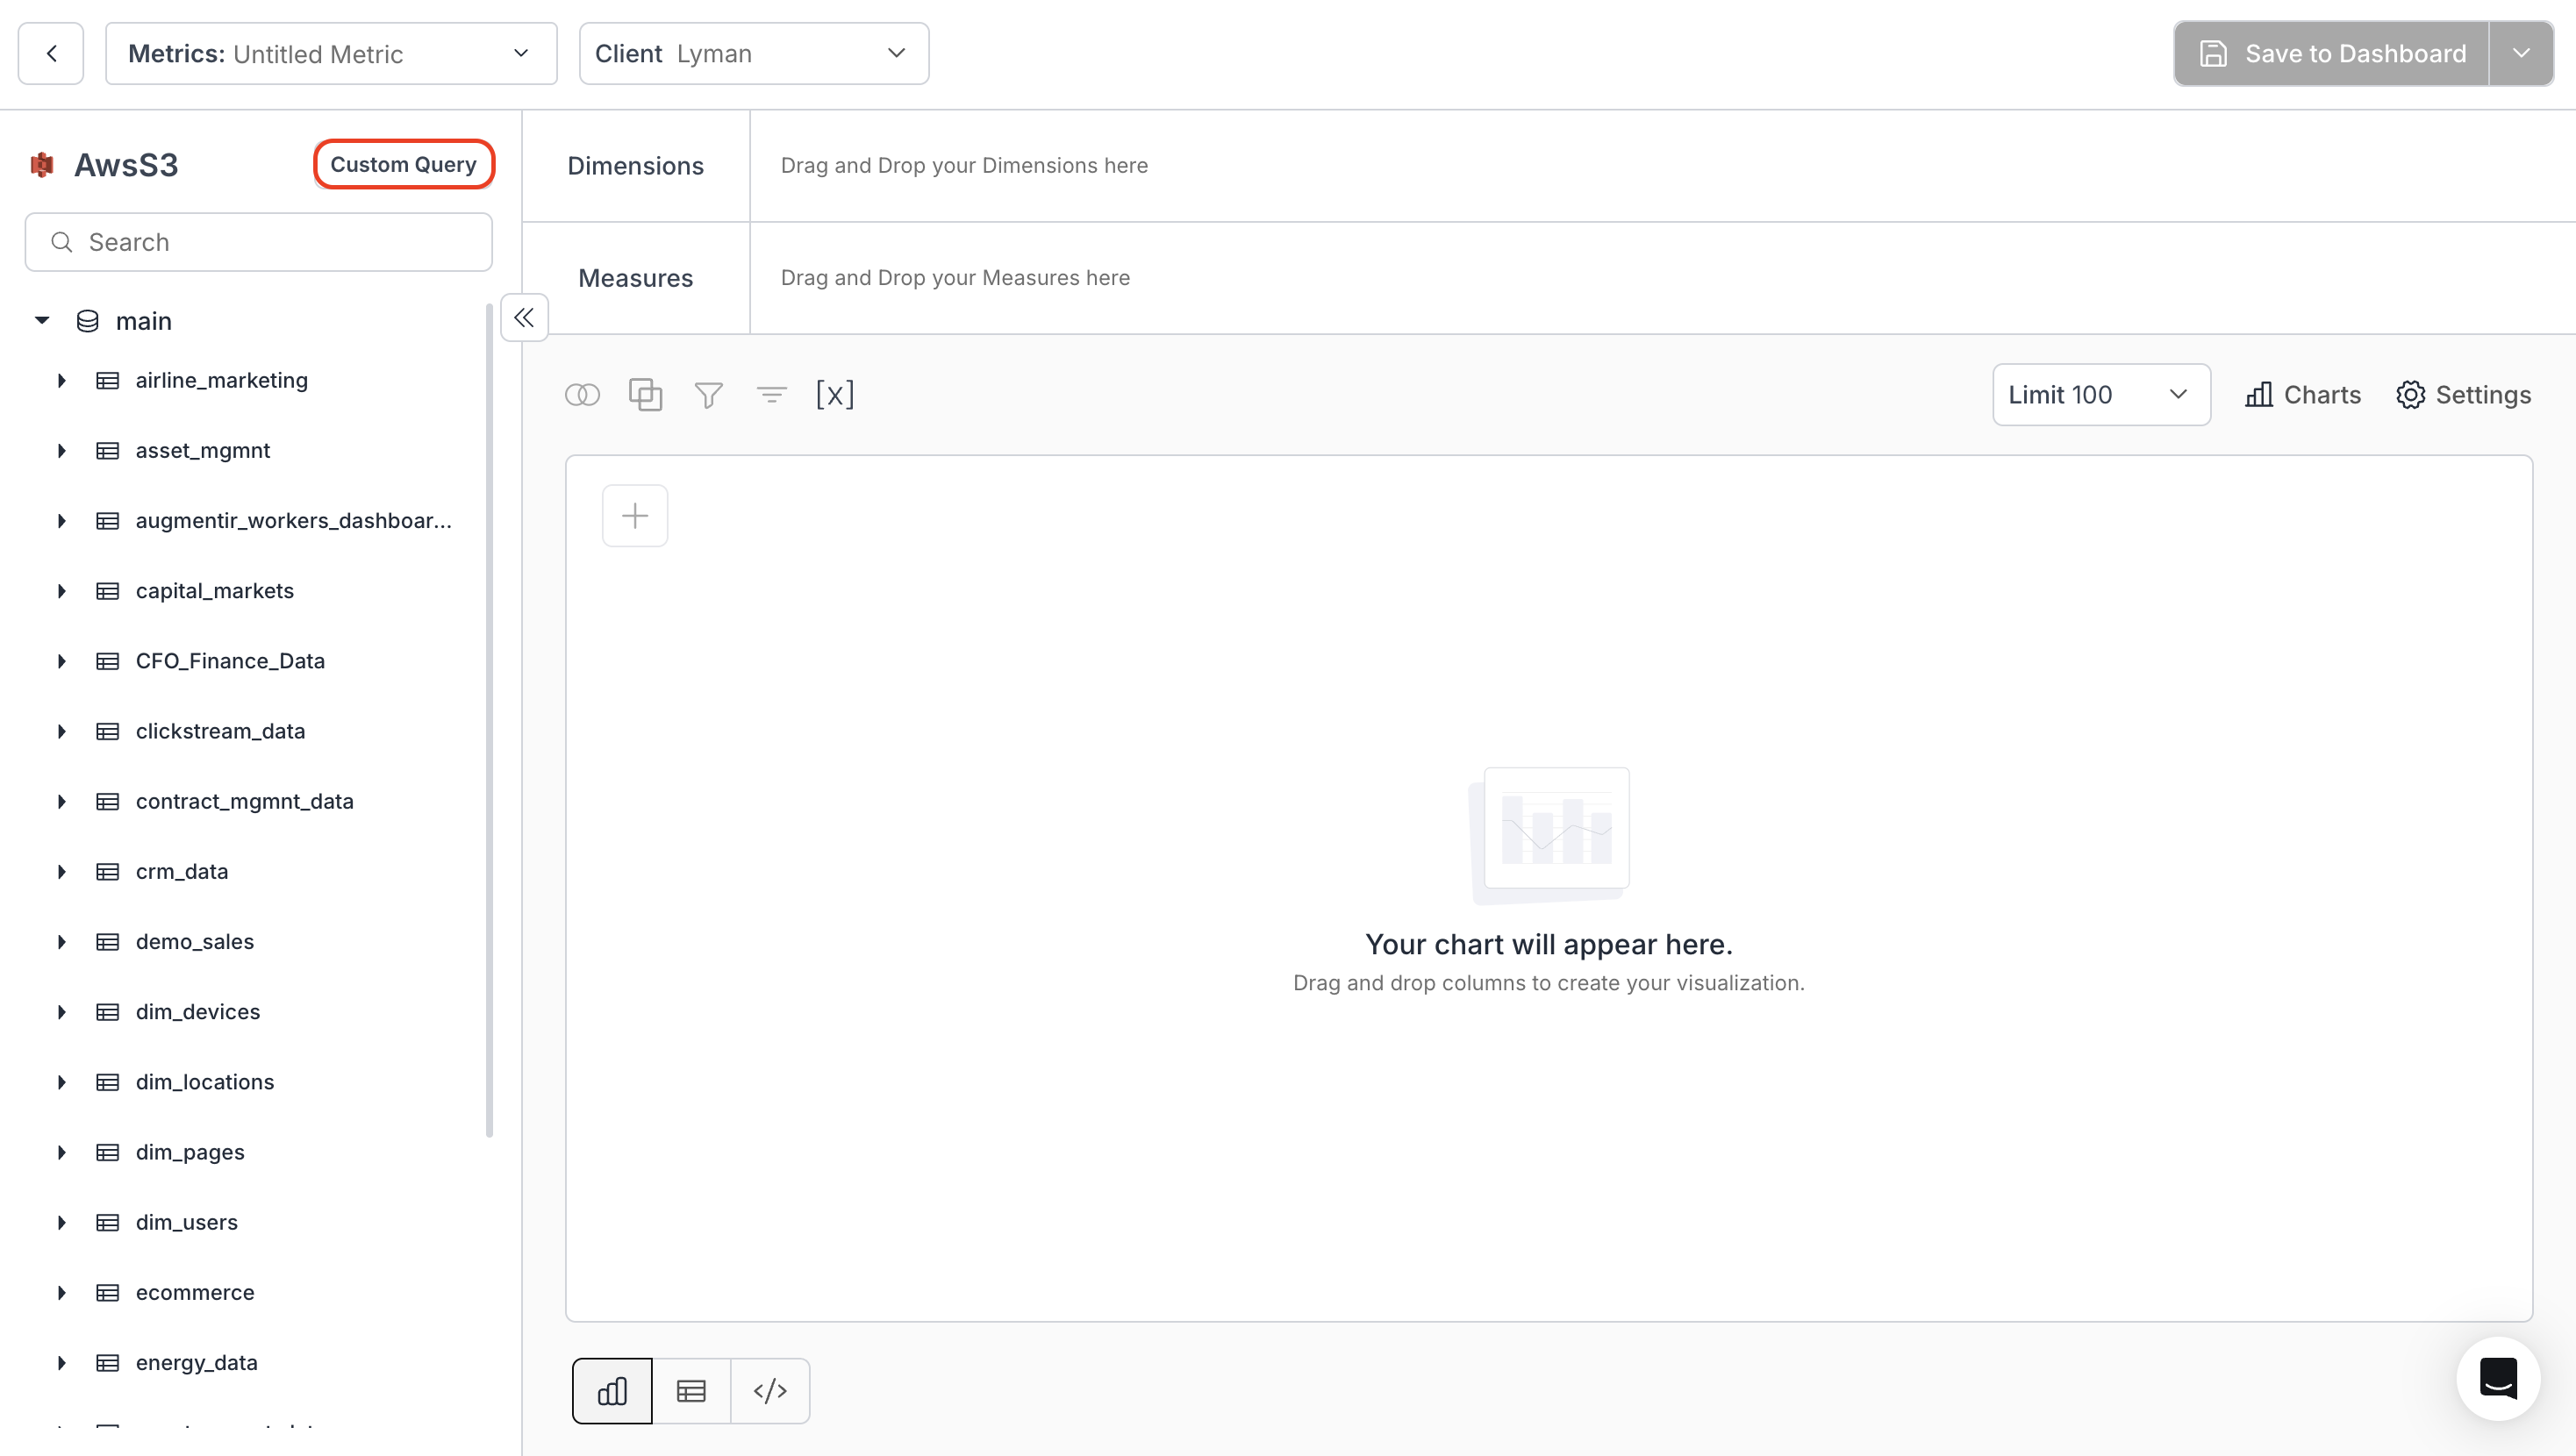
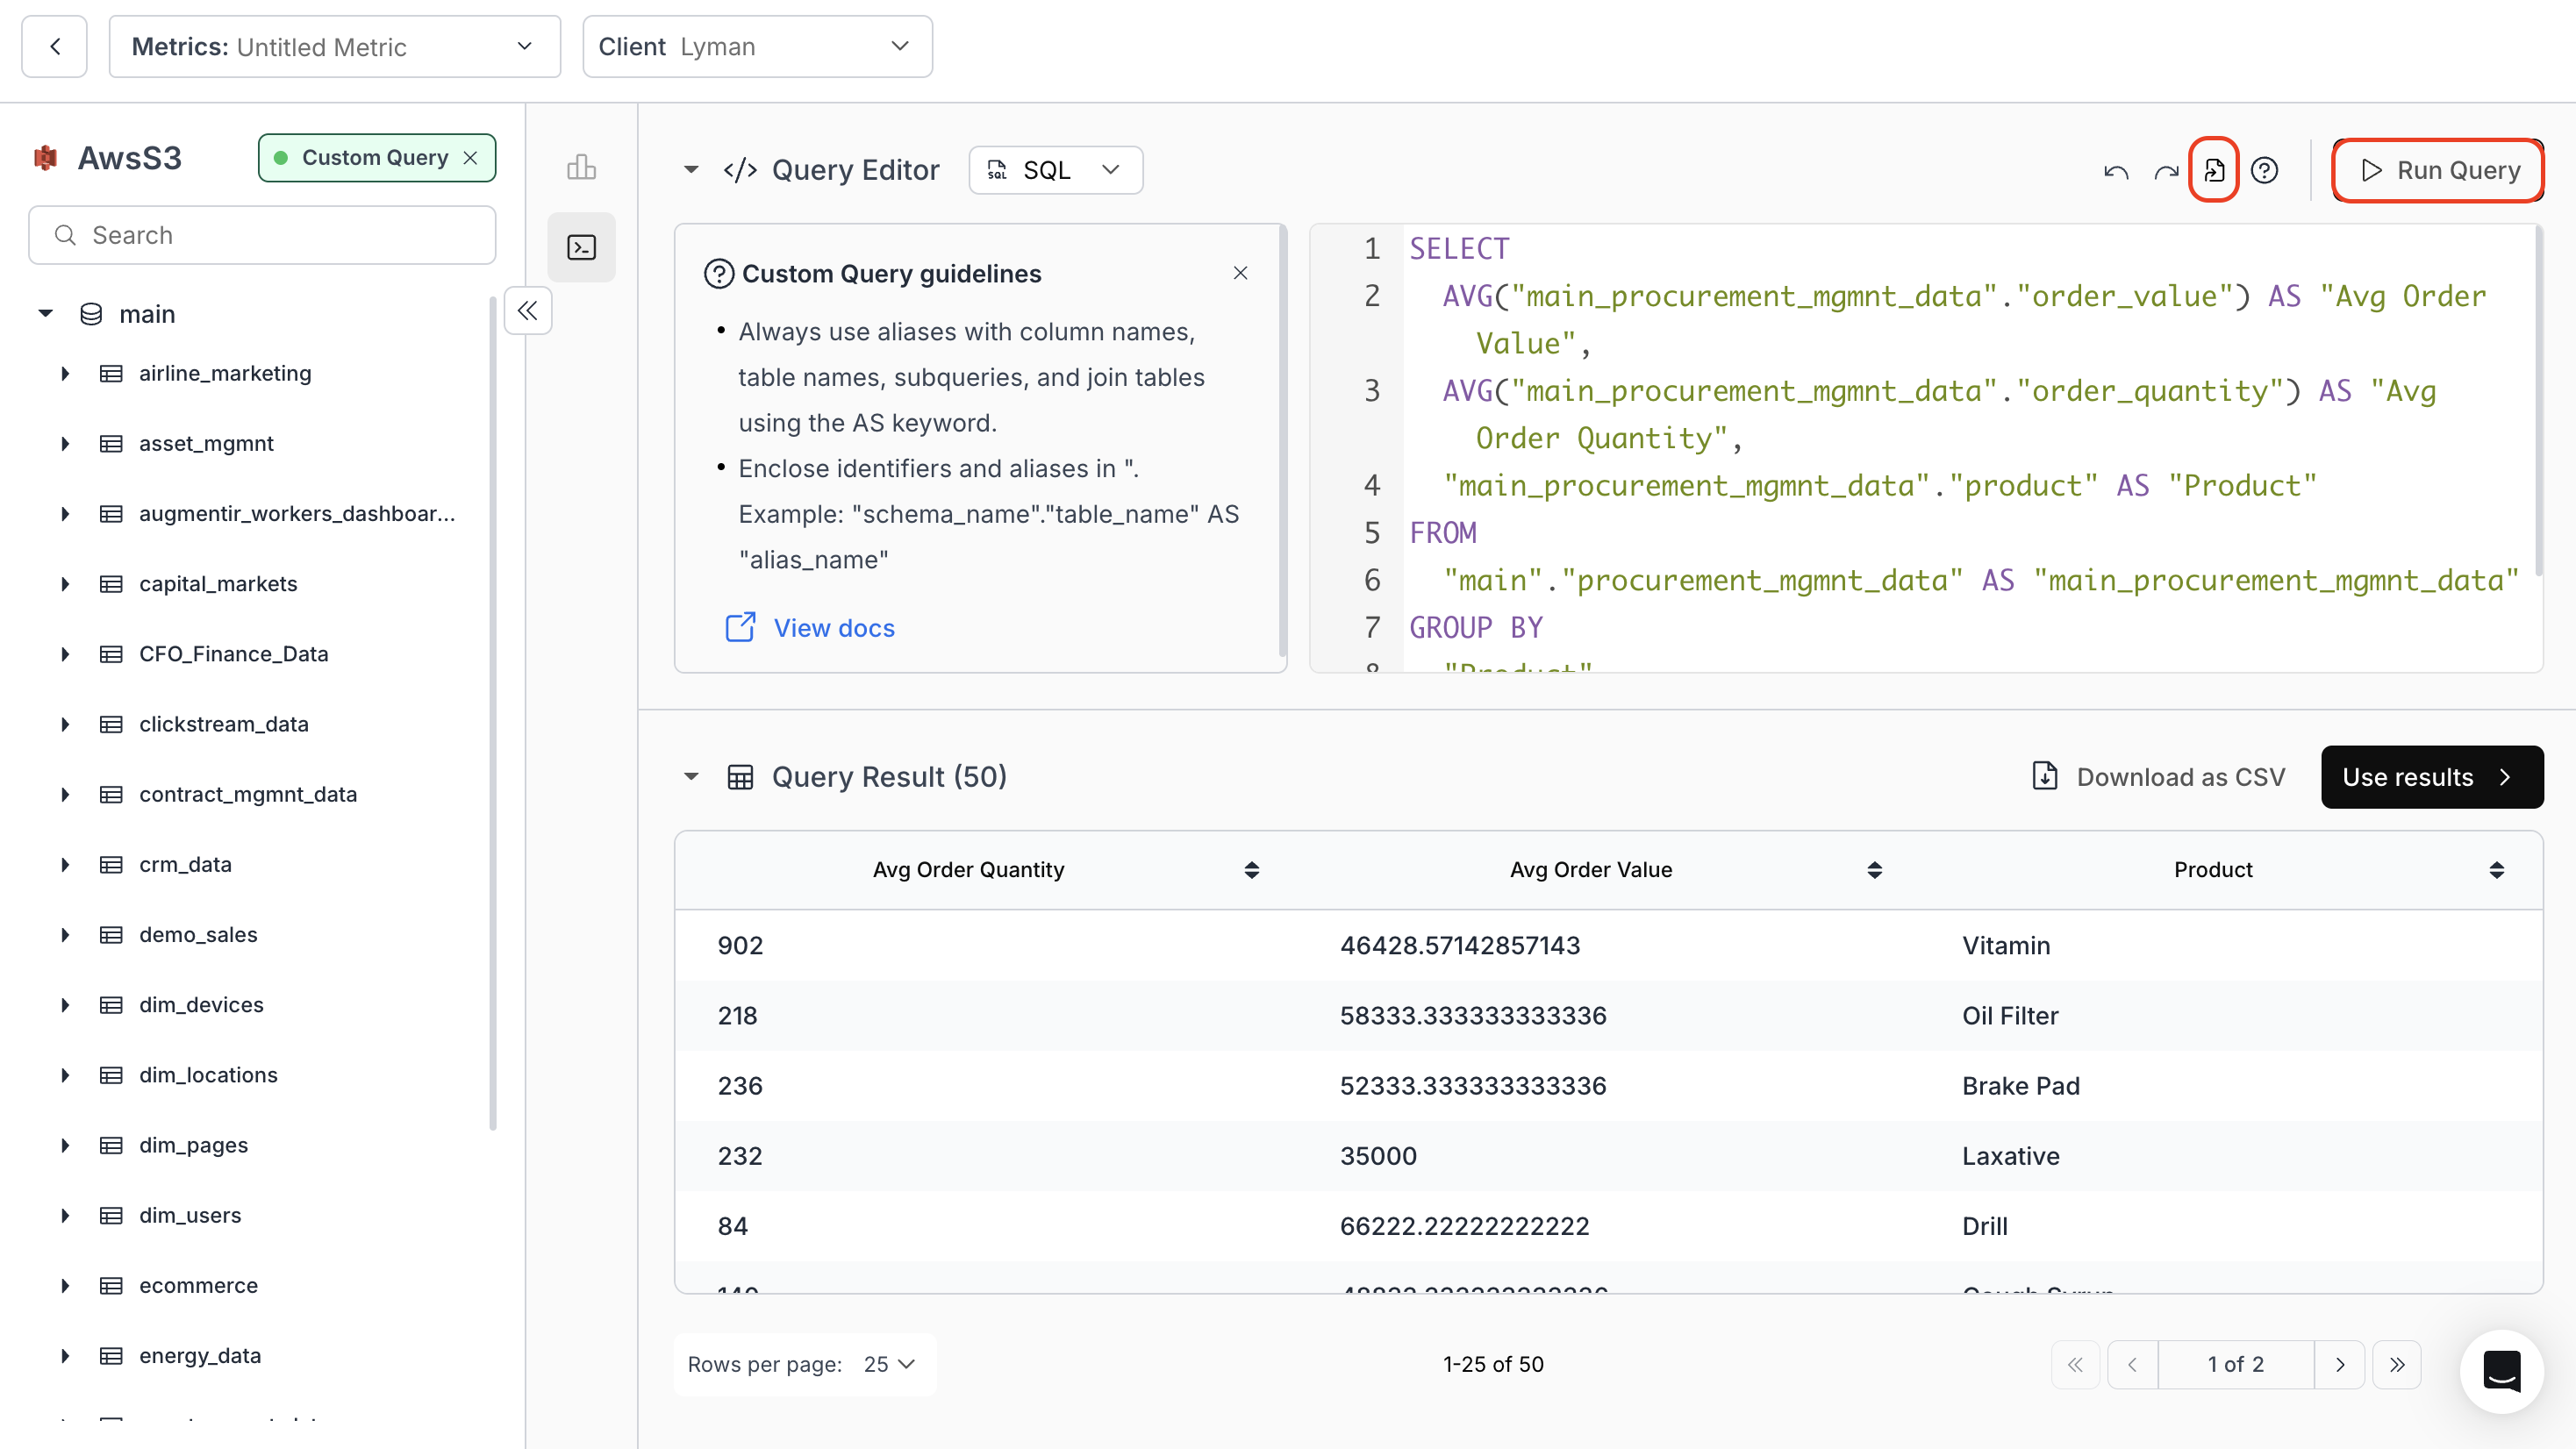
2. Writing SQL Scripts
- Enter your SQL code and click “Run Query” to generate the chart.
- (Optional) Use the “Format Query with AI” option to ensure proper formatting of your query.
- Query Result displays the data returned for your SQL query. This data can be downloaded as a CSV file if required.
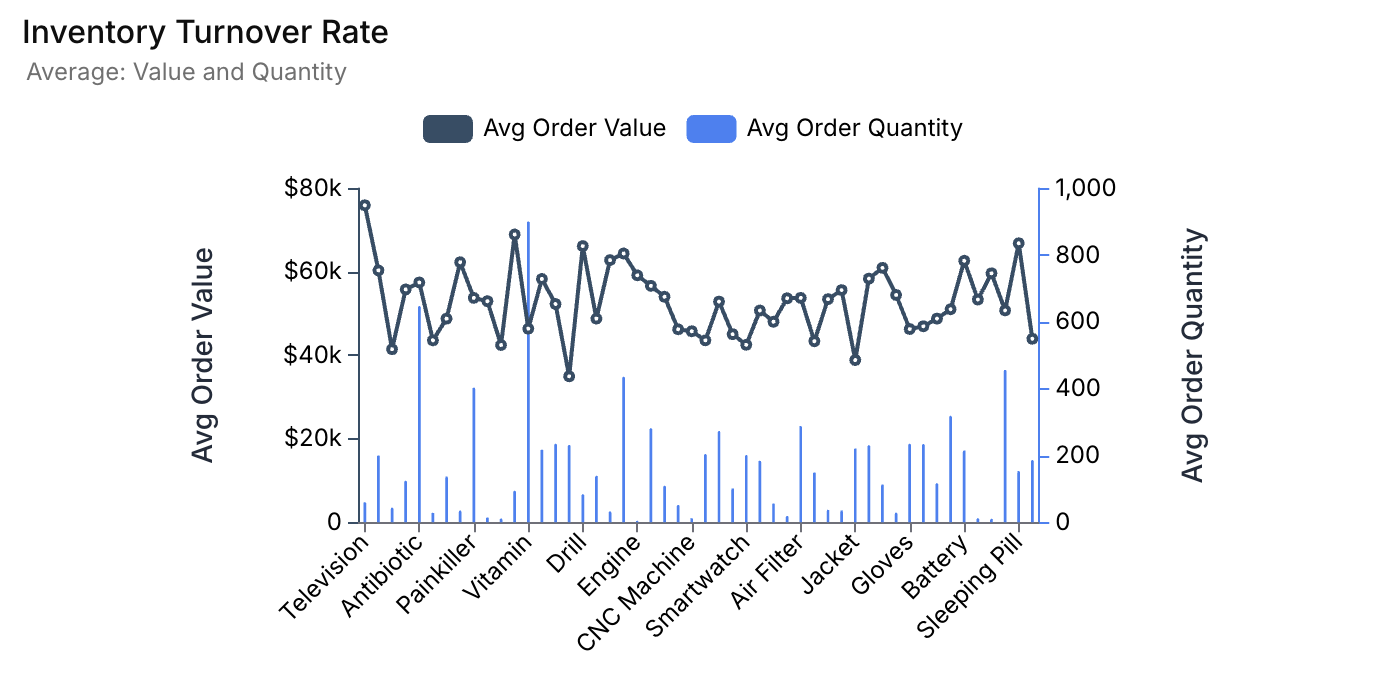
3. Usage Example
Below is an example SQL code to visualize the value and quantity of all orders based on the products ordered.4. Output of the above SQL Code