Guides
Visit our websiteDeveloper Docs
  • Getting Started with Databrain
    • What is Databrain?
  • ❄️Onboarding & Configuration
    • 📝Sign-Up
    • ✍️Sign-In
    • ✏️Google Sign In Setup for Self-hosted app
    • 🤔Forgot password? Recover your Databrain Account
    • 🌟Onboarding
    • 💾Add a Data Source
    • 🧑Configure Tenants
    • 🆕Create a Workspace
    • 🔓Create a Private Workspace
    • 🆕Create a Dashboard
    • 💠Create a Metric
      • Create Custom Columns
      • Create a Metric using Chat Mode
      • Create a Metric using Custom SQL
    • Workspace Settings
      • General Settings
      • Access Control Settings
      • Cache Settings
      • Download Settings
    • 🗄️Explore Data
  • 🛢️Datasources
    • Connecting Data Sources to Databrain
      • Amazon Redshift
      • Snowflake
      • BigQuery
      • MySQL
      • Postgres
      • MongoDB
      • ElasticSearch
      • DataBricks
      • ClickHouse
      • MSSQL
      • Amazon S3
      • CSV
      • Firebolt
      • SingleStore
      • Athena
    • Allow Access to our IP
    • Add a Data Source
    • Configure Tenants
    • How to Sync a Data Source
    • Edit Tenancy
    • Create a Datamart
    • Semantic Layer
    • Create a Data App
    • Creating a Custom Dataset/View in a Multi-Datasource Environment
  • Workspace
    • Multi Datasource Workspace
  • 🔍DASHBOARDS
    • Edit a Dashboard
    • Share Dashboard
    • Dashboard Settings
    • Create/Modify Dashboard Filter
      • Dashboard Filter - Variable Apply On
      • Add LHS and RHS custom sql support for dashboard filter
    • Customize Layout
    • Adding Elements to Dashboard
    • Import/Export Dashboard
    • Report Scheduler
  • 📉METRIC
    • Edit a Metric
    • Joins , Filter, Sort, Group By
    • Complex Filter
    • Apply Metric Filter
      • Metric Filter - Variable
      • Metric Filter - Custom
    • Switch X axis and Switch Y axis
    • Group By
    • Footnote and Long Description
    • Dynamic Property
    • Archive/Unarchive Metric Card
    • Download Metric Card
    • Download Underlying Data
    • Metric Summary
    • Metric Expression for Single Value Card
    • AI Summary
    • Merge Metrics
    • Section Filters
    • View Unpublished Metrics
  • 📊VISUALIZATIONS - ACTIONS & APPEARANCE
    • Chart Actions
      • Chart Click Action
      • Chart Click Action with Metric
      • Card Click Action
      • Drill Down
      • Cross Dashboard Drill Down
    • Chart Appearance
      • Chart-Specific Appearance Options
  • 🛢️PREVIEW OF DASHBOARDS
    • Email Settings for Scheduled Reports
    • Scheduled Reports for End User
  • 🔍FILTERS
    • Dashboard Filter
    • Metric Filter
    • App filter
  • 💡Features
    • Python Editor Console
    • Custom SQL Console
    • Custom SQL Query Guidelines
  • 🏢Integrating Plugin
    • ✳️Get an auth token
    • 🙏Get a guest token
  • 🛃THEMEING & CUSTOMIZATION
    • 🎨Creating a theme
    • 🖼️View the theme in action
    • ⚙️Reset a saved theme
  • 📊Metric Component (upto version v0.11.15)
    • ✨Quick start
  • 🕸️Web Components
    • ✨Quick start
    • ⚛️Framework Specific Guide
  • 🚀Product Changelog
  • 🤳Self Hosted Changelog
Powered by GitBook
On this page
  1. DASHBOARDS

Dashboard Settings

The dashboard settings offer various tools to enhance, manage, and customize your analytics experience.

PreviousShare DashboardNextCreate/Modify Dashboard Filter

Last updated 18 hours ago

  1. Navigate to Dashboard Settings

  • On the dashboard, click the "Settings" icon in the top right corner, next to the "Share" button.

  • A list of drop-down options will be displayed.
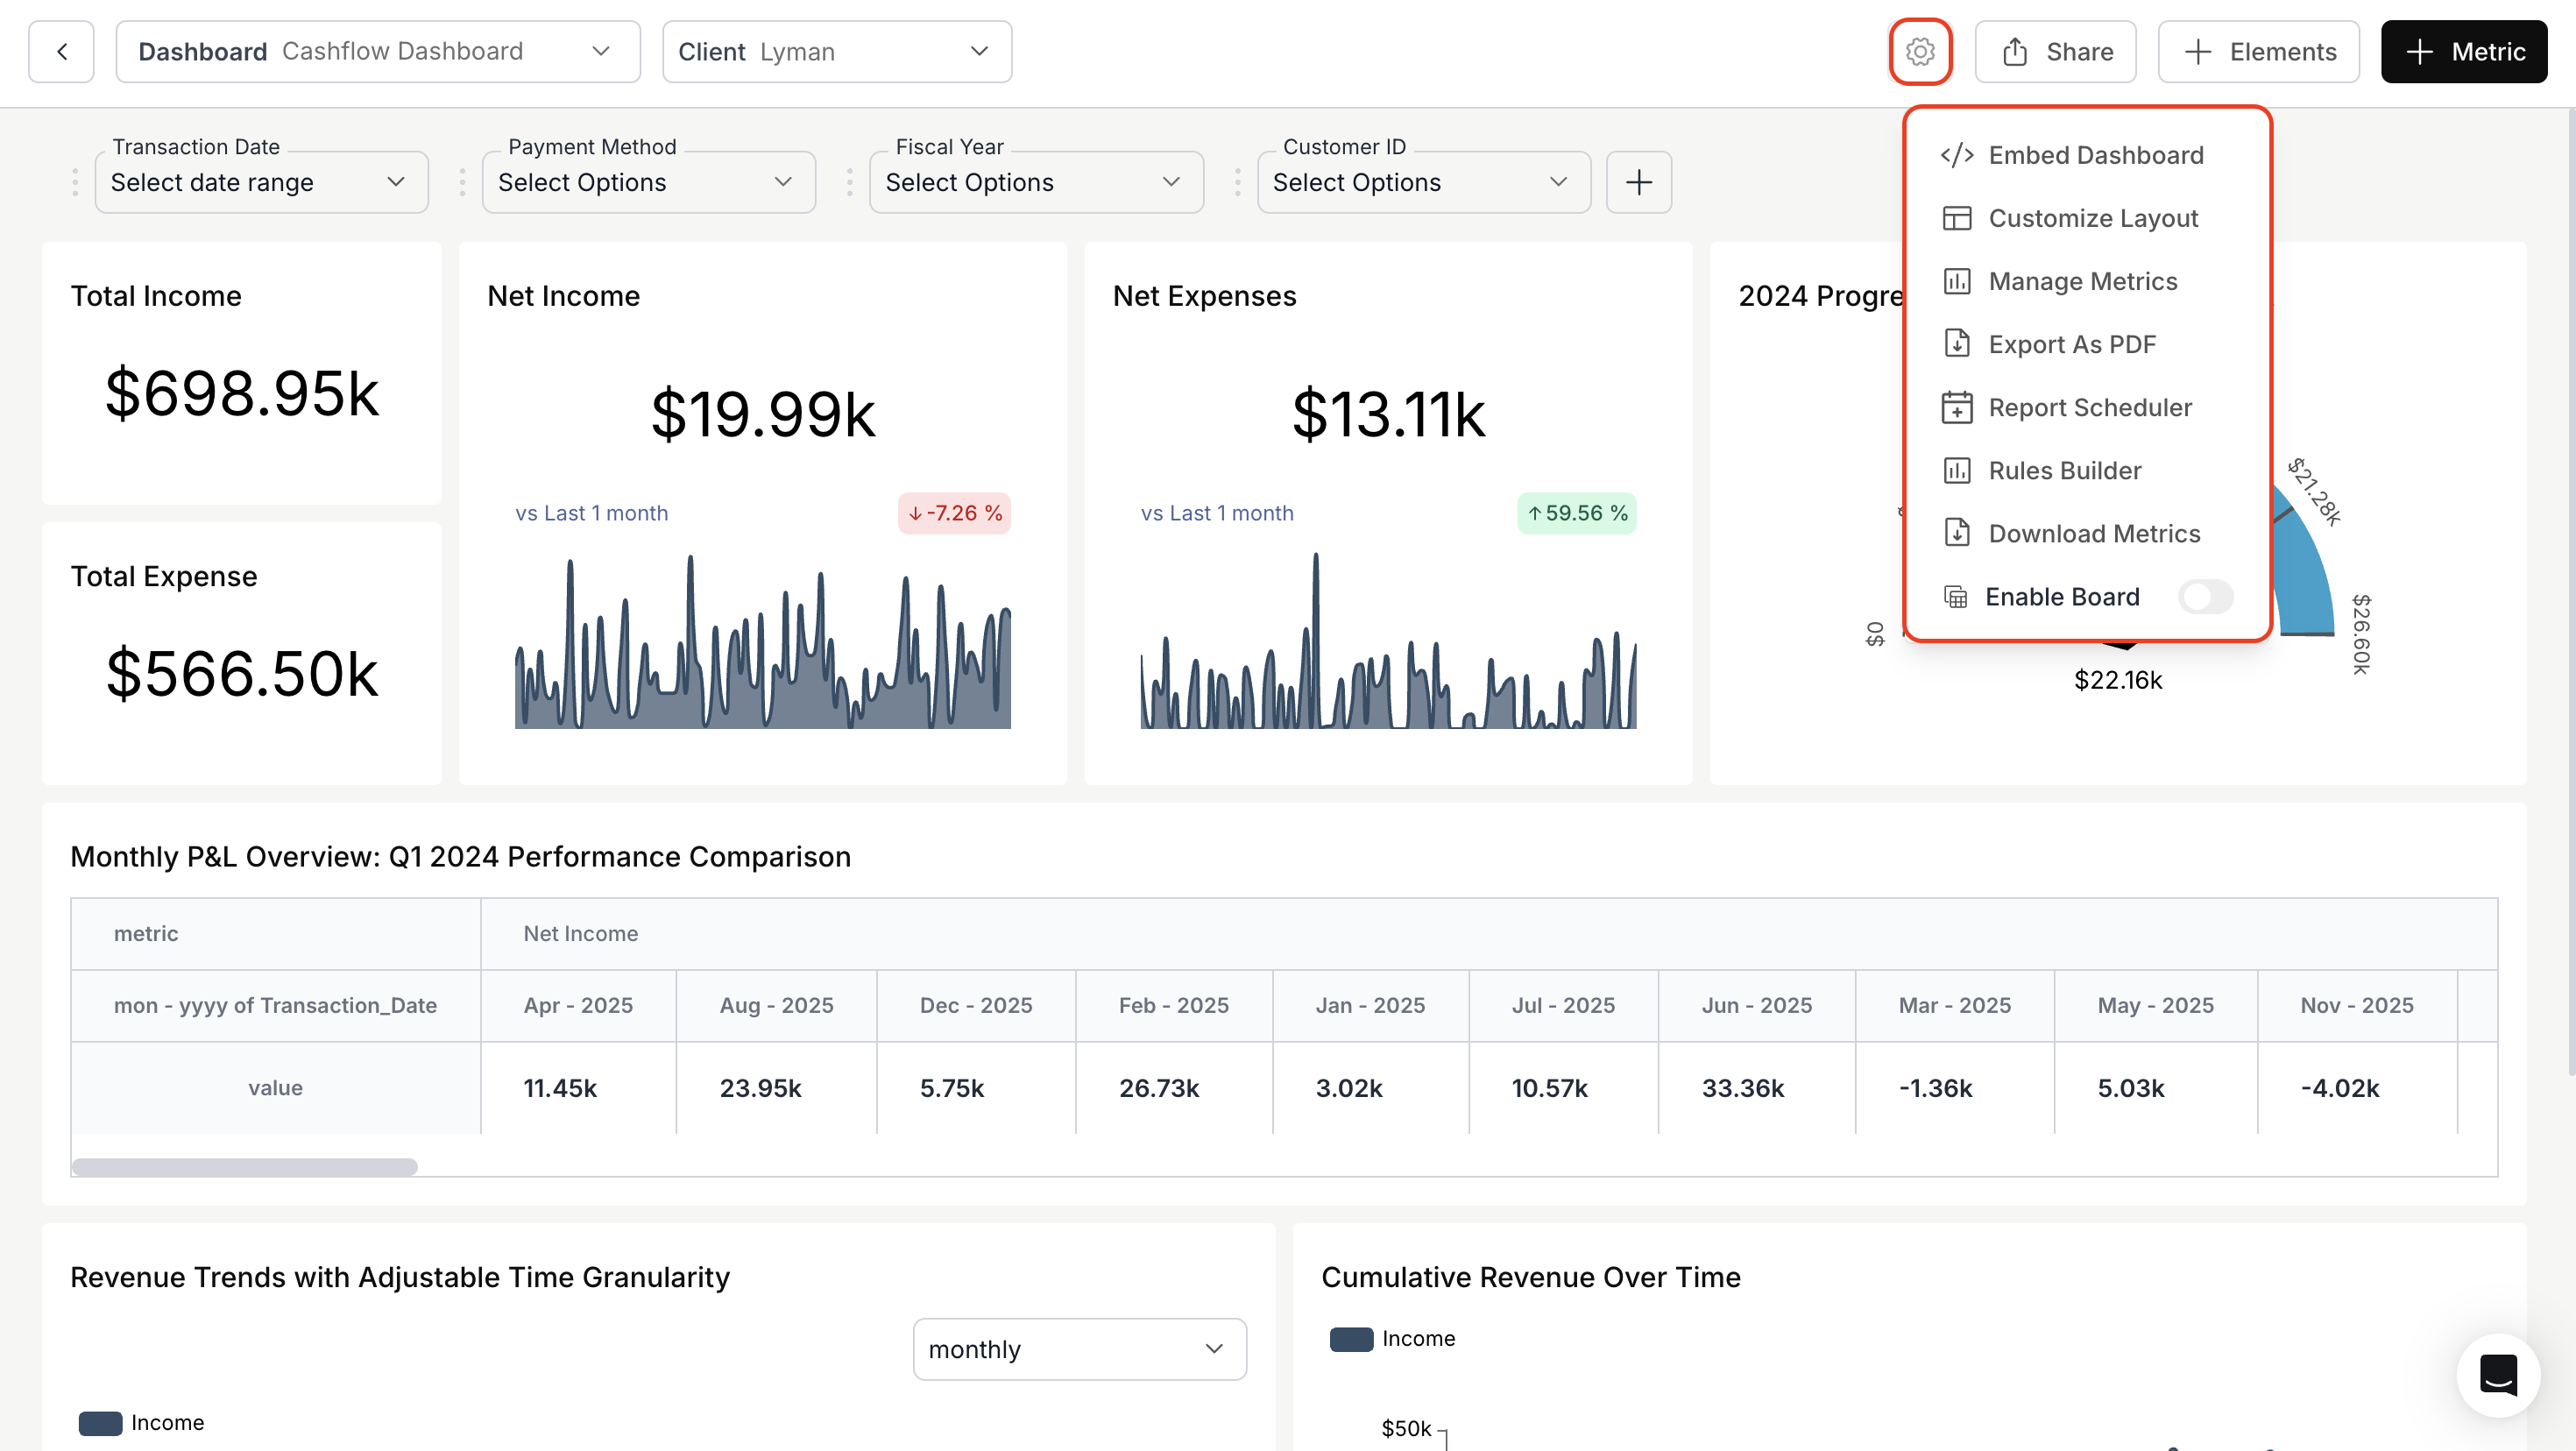
  1. </> Embed Dashboard:

Here, you can retrieve the embeddable code or the Databrain app dashboard UI plugin, available in both React and Vue languages.

  1. Customize Layout:

  • Organize your dashboard metrics to create a personalized view.

  • For more details, please refer to the link below:

  1. Manage Metrics:

  • This tool lets you oversee the metric cards on the dashboard.

  • From the dropdown, decide which metrics to display and which to hide. Unselected metrics are sent to the archive metric store. If needed, you can recover them later by unarchiving.

  1. Report Scheduler

  • Create, schedule, and manage automated dashboard reports with customizable delivery options to meet your reporting needs.

  • For more details, please refer to the link below:

By utilizing these settings, you can ensure an optimal and tailored dashboard experience in Databrain.

🔍
Customize Layout
Report Scheduler