- Navigate to the dashboard you want to edit.
- Managing Dashboards:
- Click on the three-dot icon next to the dashboard name to access options to “Rename”, “Export” or “Delete” your dashboard
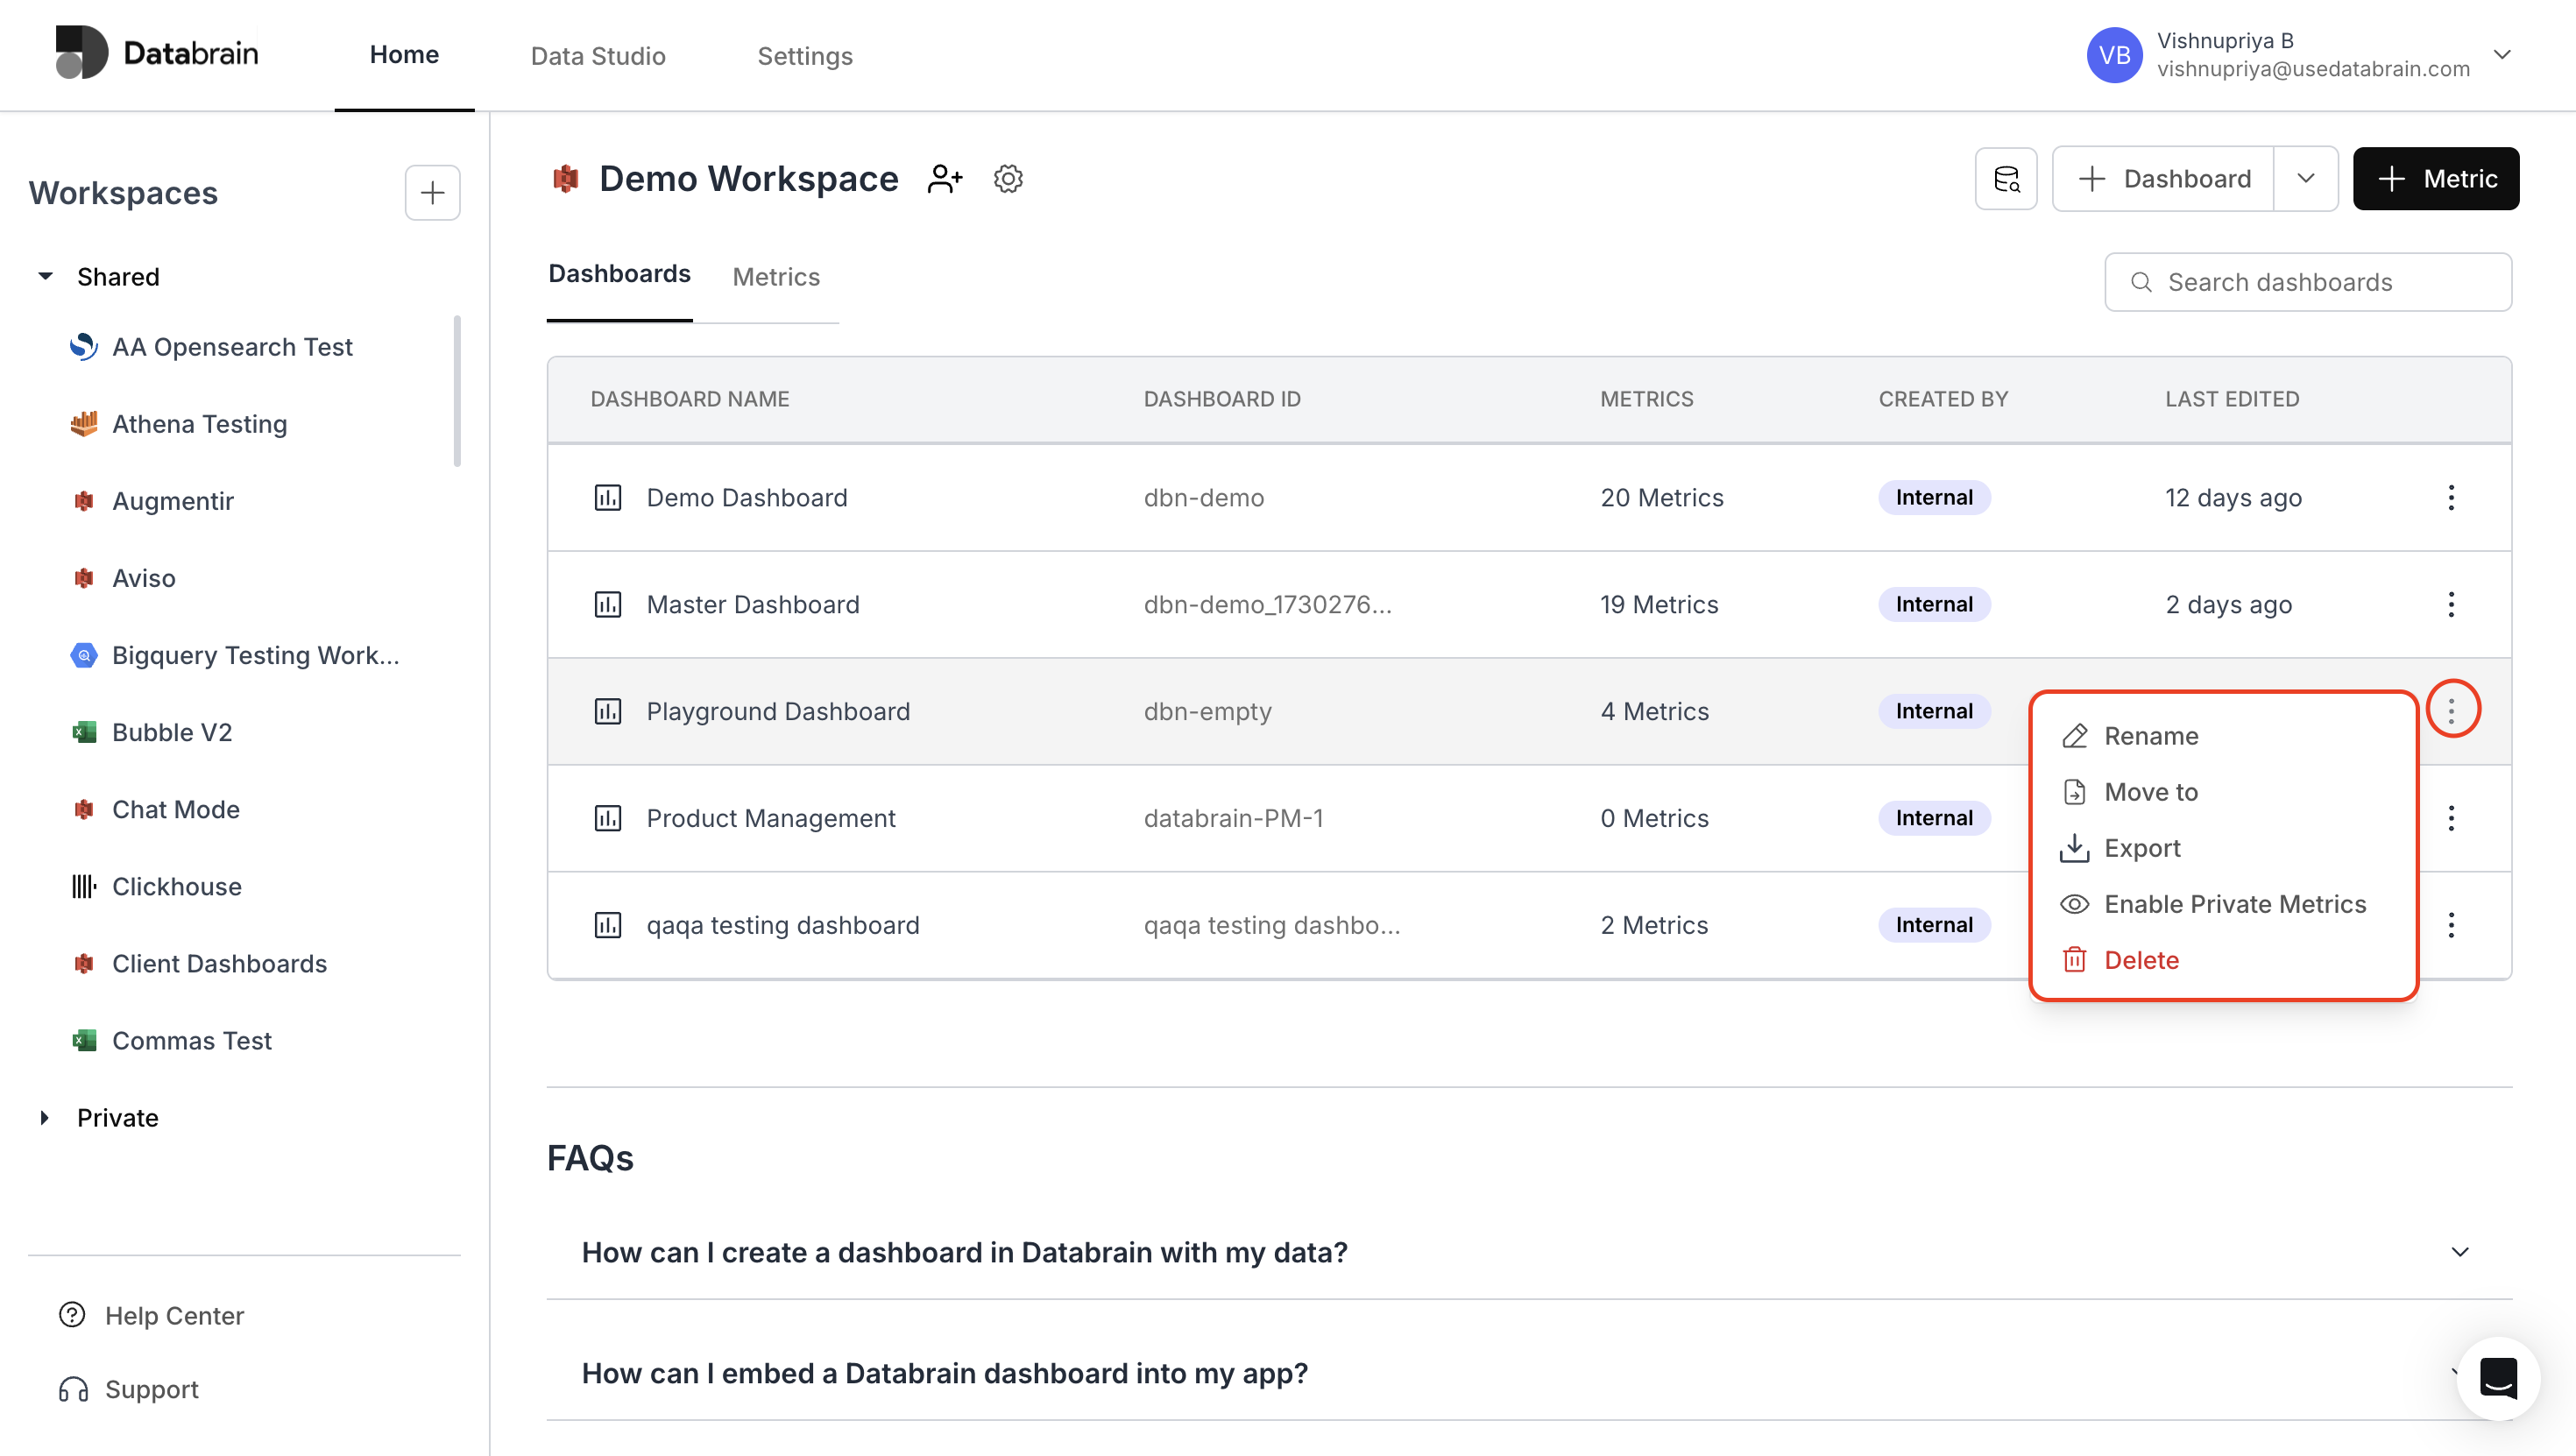
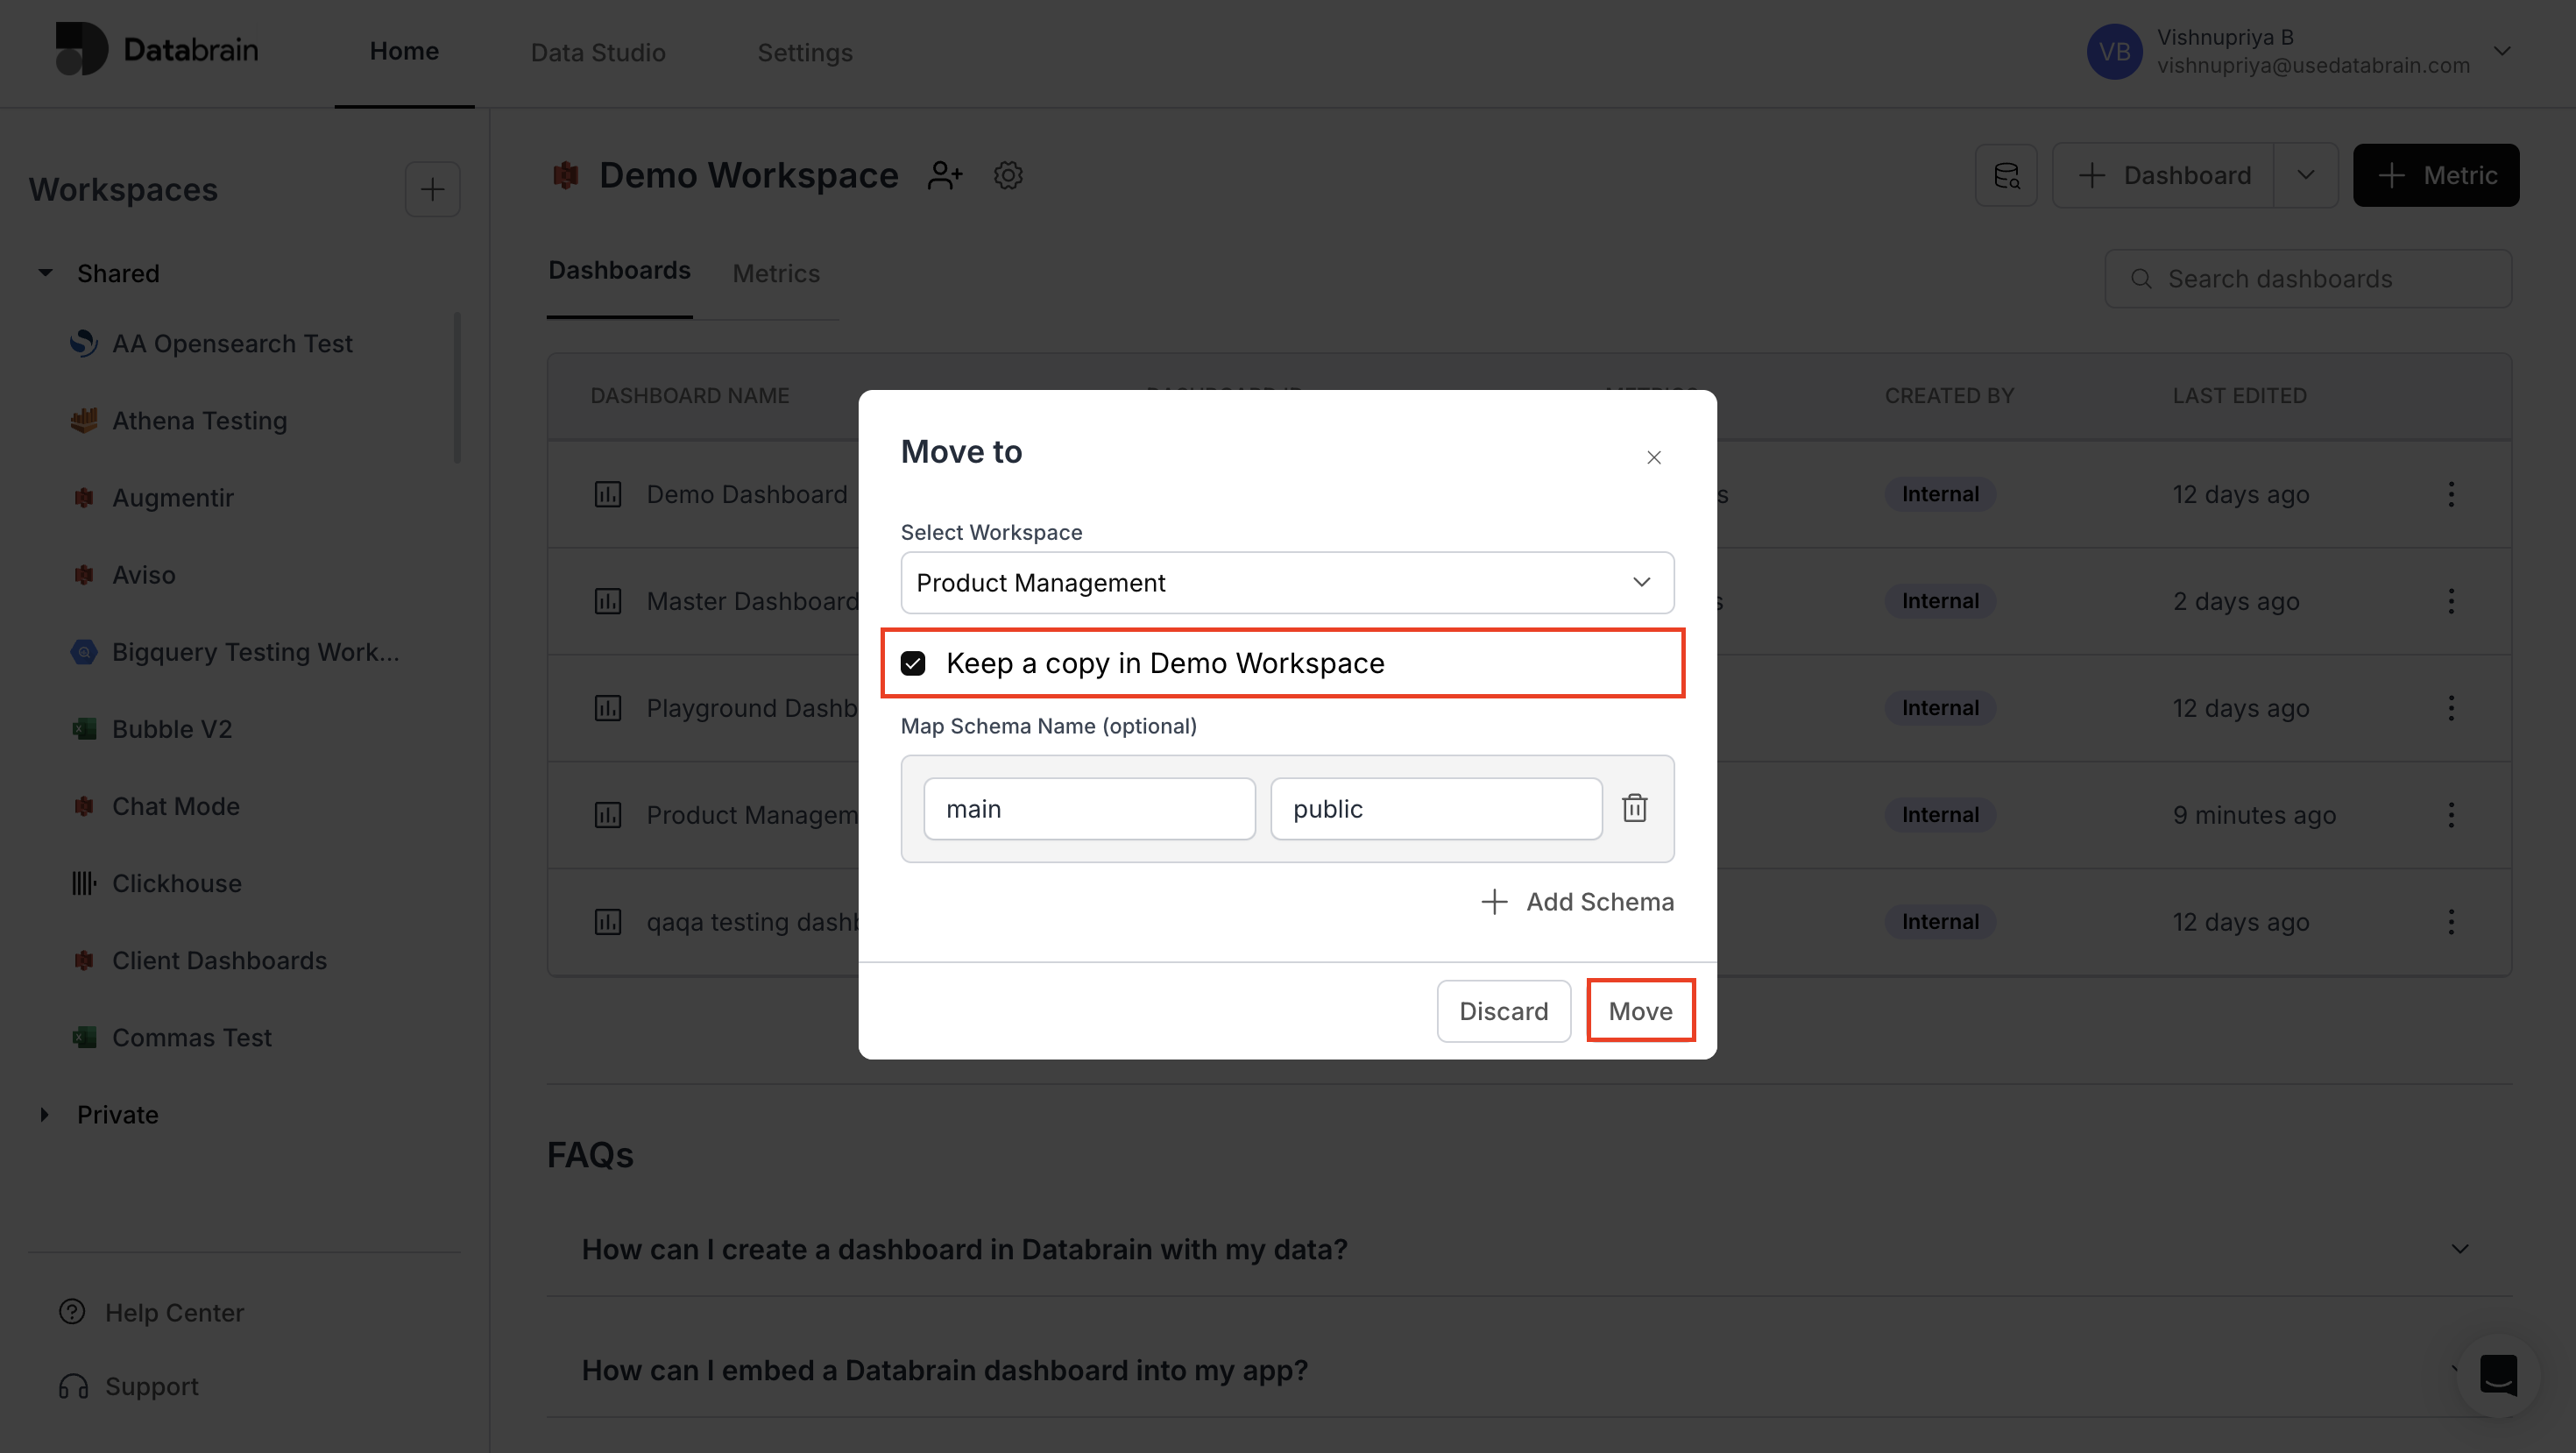
- Use the “Move to” option to transfer your dashboard to another workspace.
- Check the box to keep a copy of the dashboard in the current or testing workspace, if needed.
Dashboard update completed. Your dashboard configuration changes are now applied and ready for use.