Creating a Dashboard Filter in DataBrain
To add a dashboard filter, click on the ”+” sign located below the dashboard’s name. Start by selecting the datatype for the filter, which will influence the available filter option types—auto, manual, or custom. Note that the option type may vary based on the selected datatype.Customizations Based on Datatype:
- Filter Variant: Choose between single select, multi-select, or search options for how users can interact with the filter.
- Select Default Value: Automatically select a default value or allow users to choose one. This setting depends on the datatype.
- Scope to Client: Filter options will be tailored based on the client. This ensures that filter choices are relevant to a specific client’s data context.
- Label Column Setup: Configure a label column that displays descriptive labels for the values being filtered. This enhances readability and user understanding of what each filter value represents.
Dependent Filters
Use dependent filters when the available options in one filter should be constrained by the selection in another filter (for example, Store City depending on Store State).Columns from Same Table
Create two filters (Store State and Store City) on the same dataset, and configure Store City to depend on Store State. Store State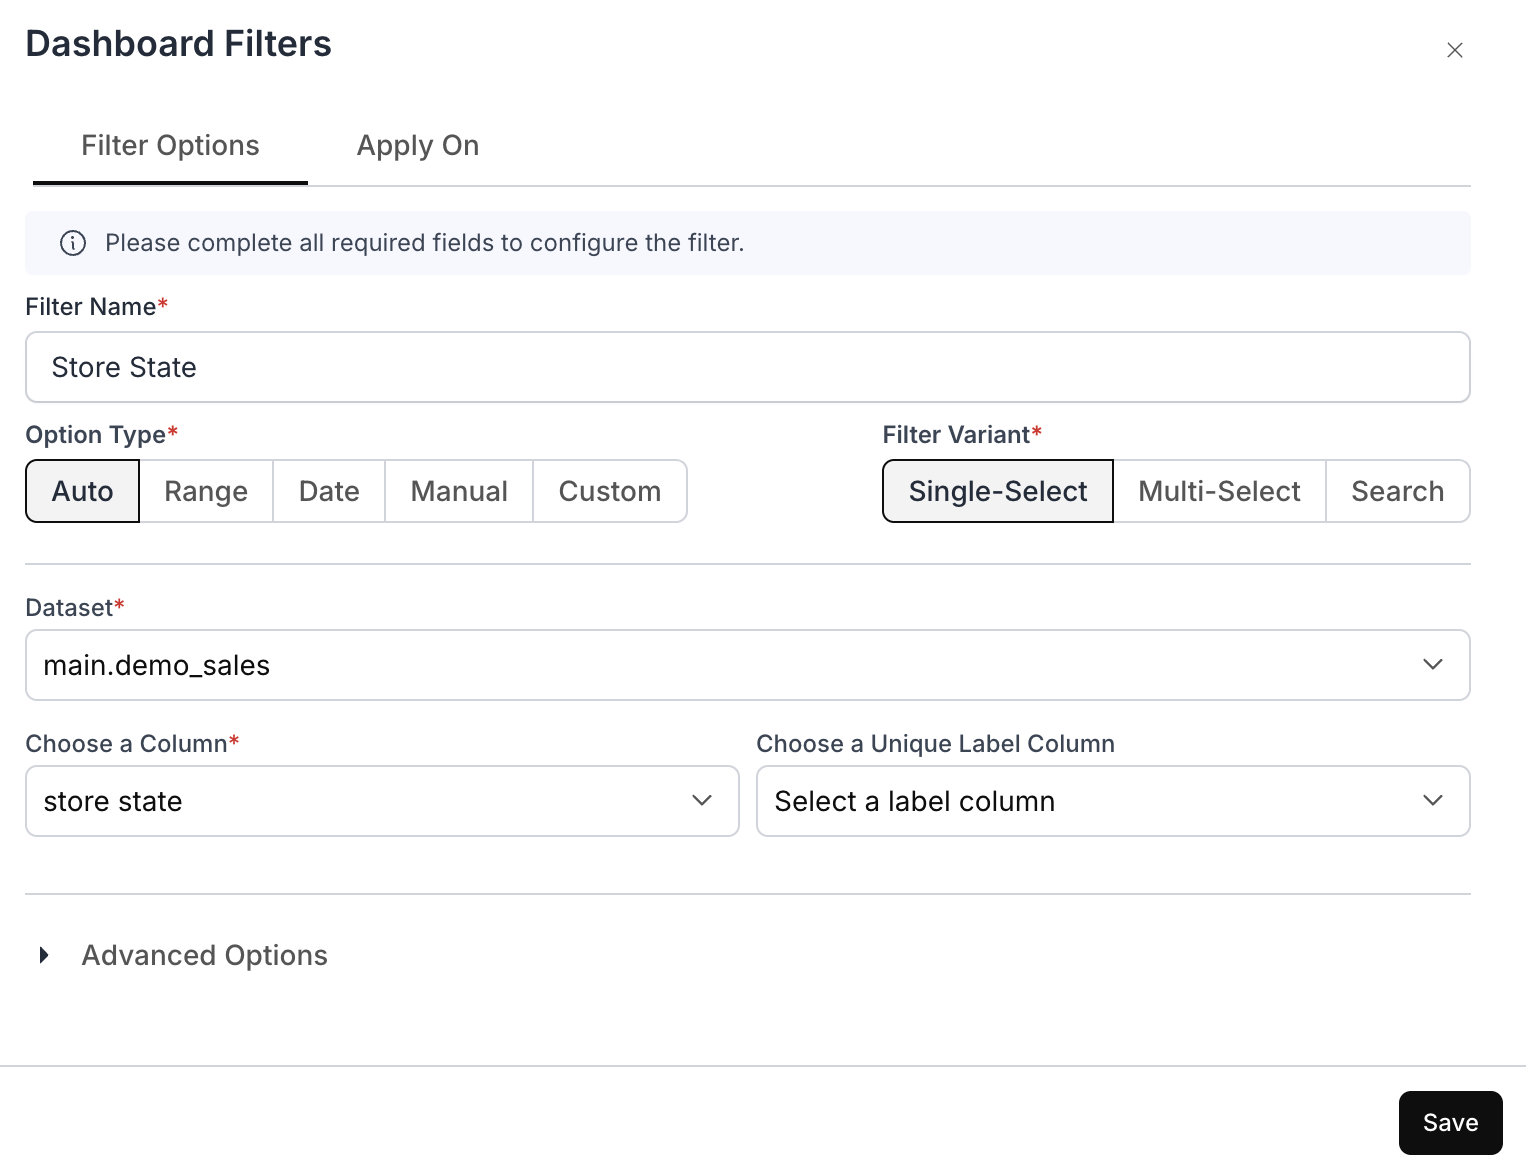
Columns from Different Tables
When the top-level and dependent filters use columns from different tables, configure the dependency using a custom SQL query that joins the tables. Step 1: Configure the Top-Level Filter Set up the first-level filter as you normally would.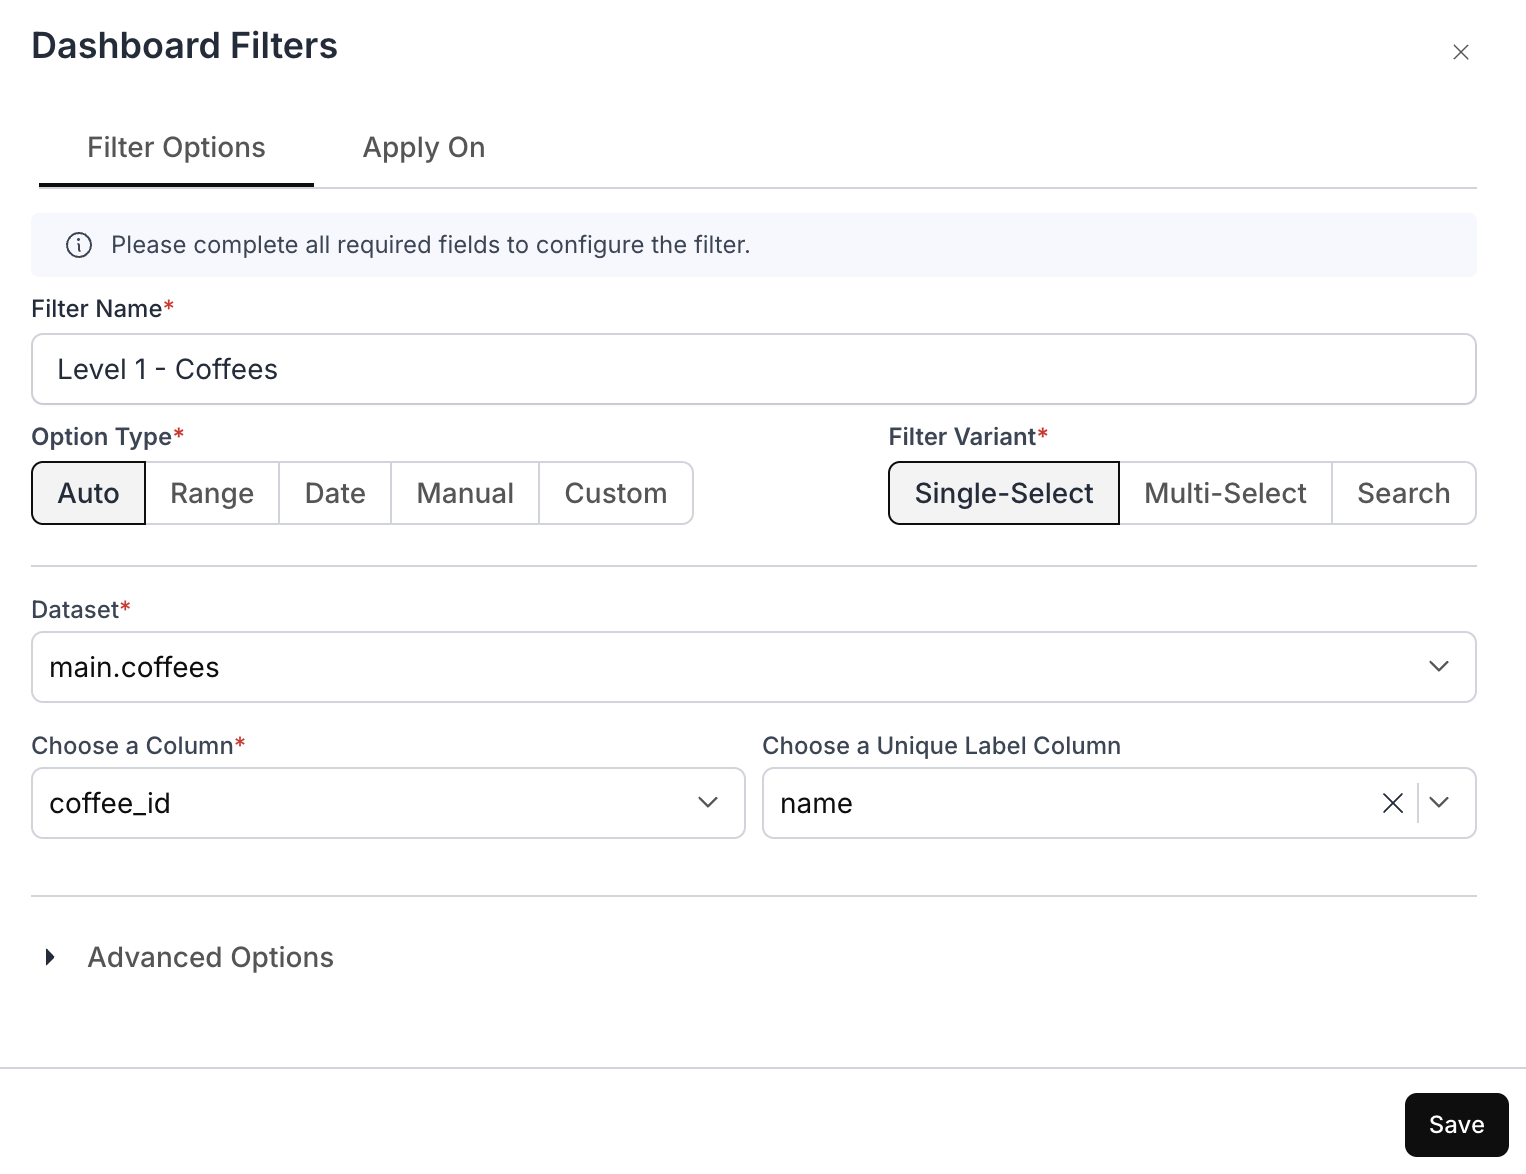
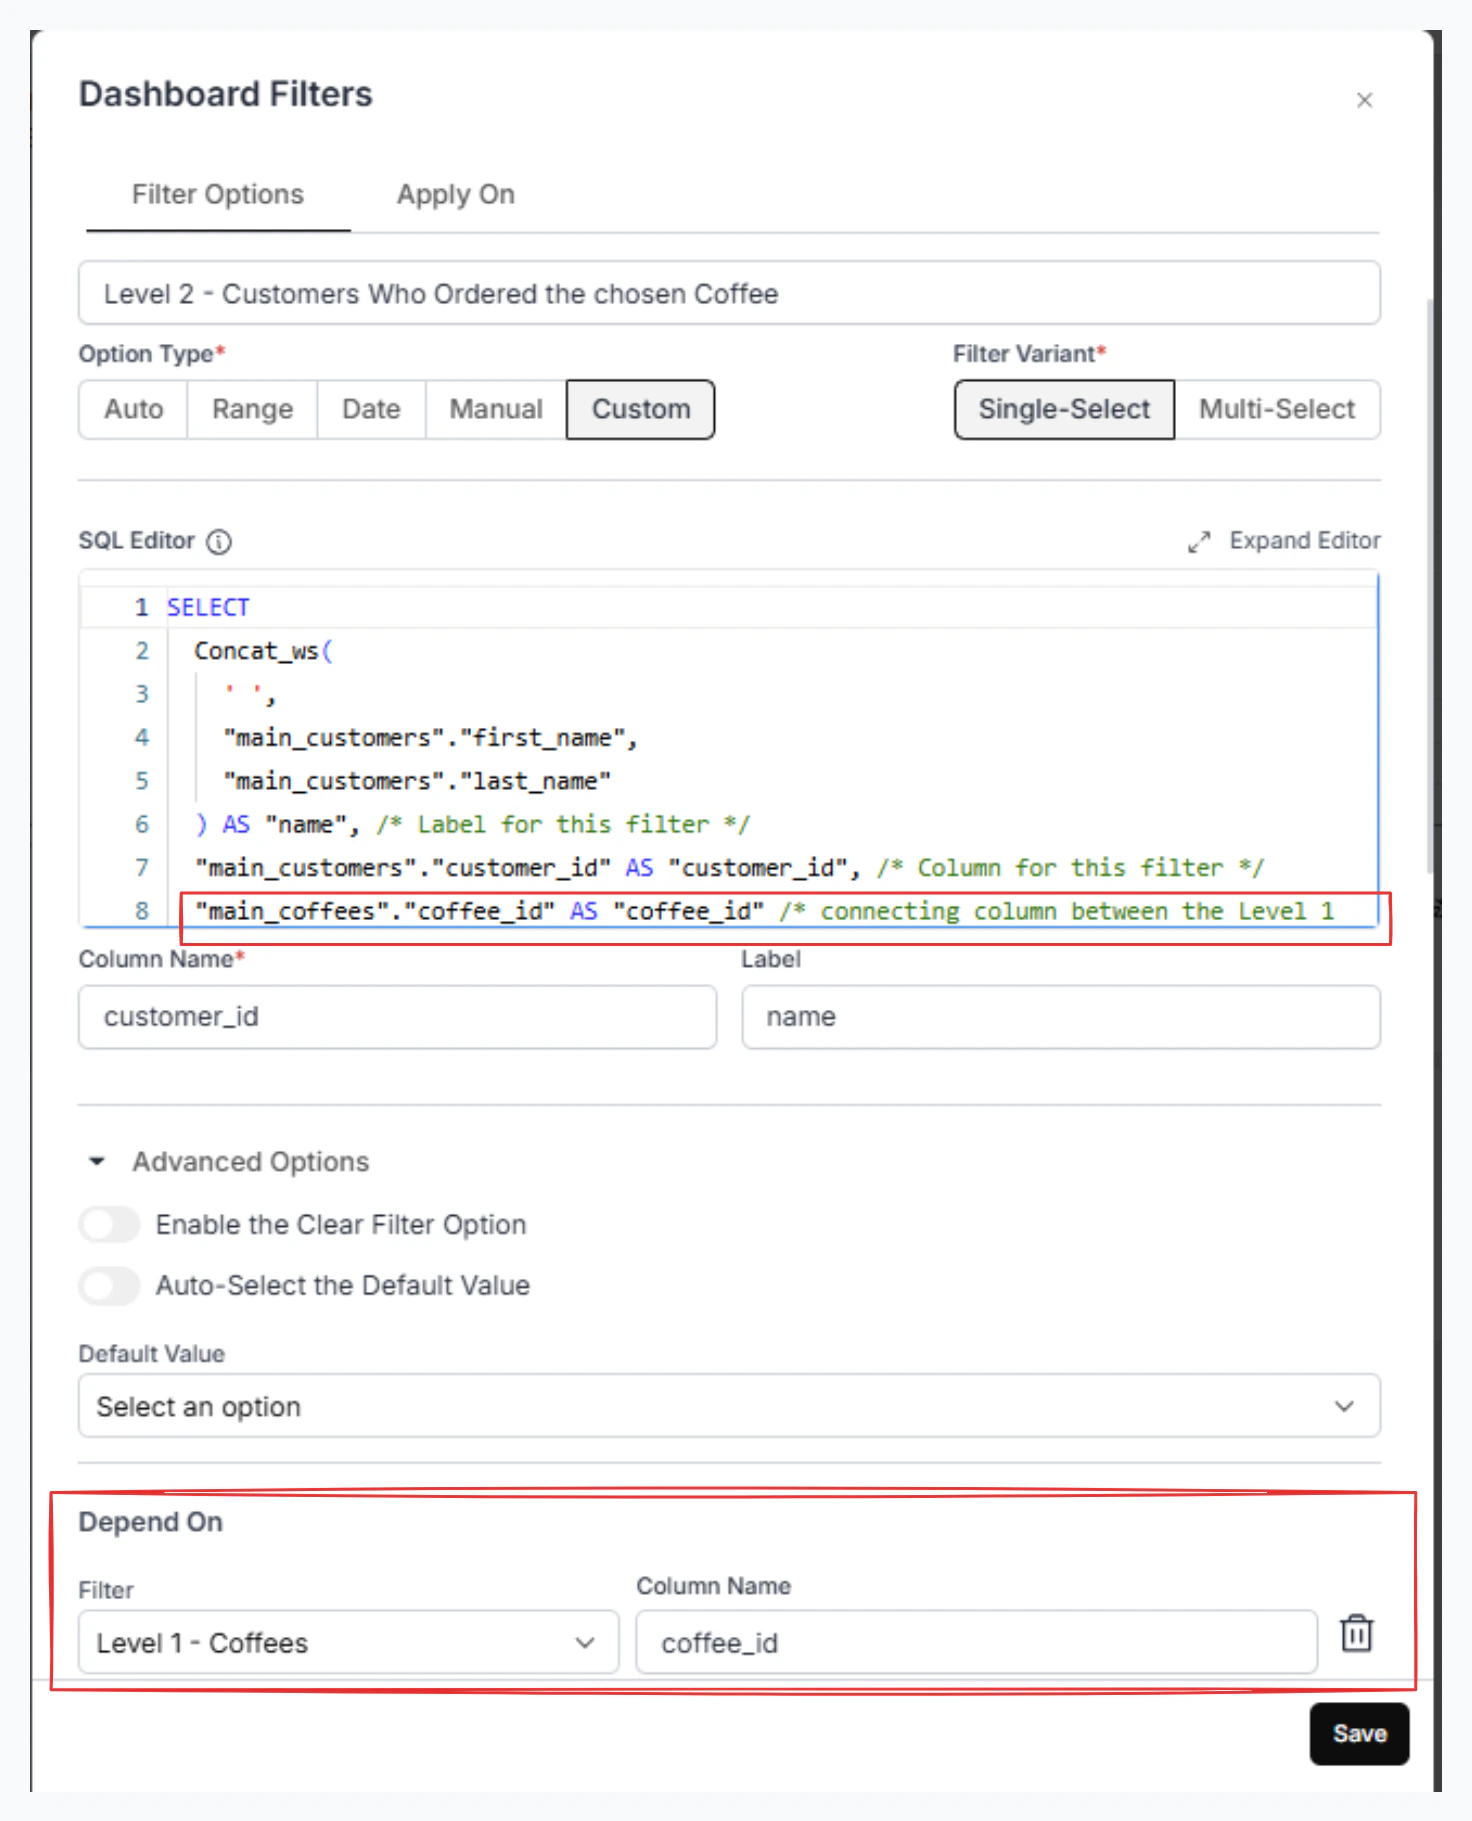
Make sure the query includes the connecting column between Level 1 and Level 2.
- In Advanced Options, under Depend On, type the connecting column from Filter 1 to ensure linkage.
Applying the Filter:
Once the filter settings are configured, decide where to apply these filters within the dashboard:- Direct Apply: Immediately apply the filter to the dashboard elements.
- Variable for Custom SQL: Obtain a variable that can be used in your custom SQL queries, allowing for more tailored data interactions.
Dashboard Filter - Variable Apply On
View detailed guide on how to use Variable Apply On for filters.
- Custom SQL: Directly write the left-hand side (LHS) equals the right-hand side (RHS) condition in the WHERE clause of your SQL query.