1. Switch X Axis:
Click on the ”+” icon on top of the metric and click on “Switch X Axis” button.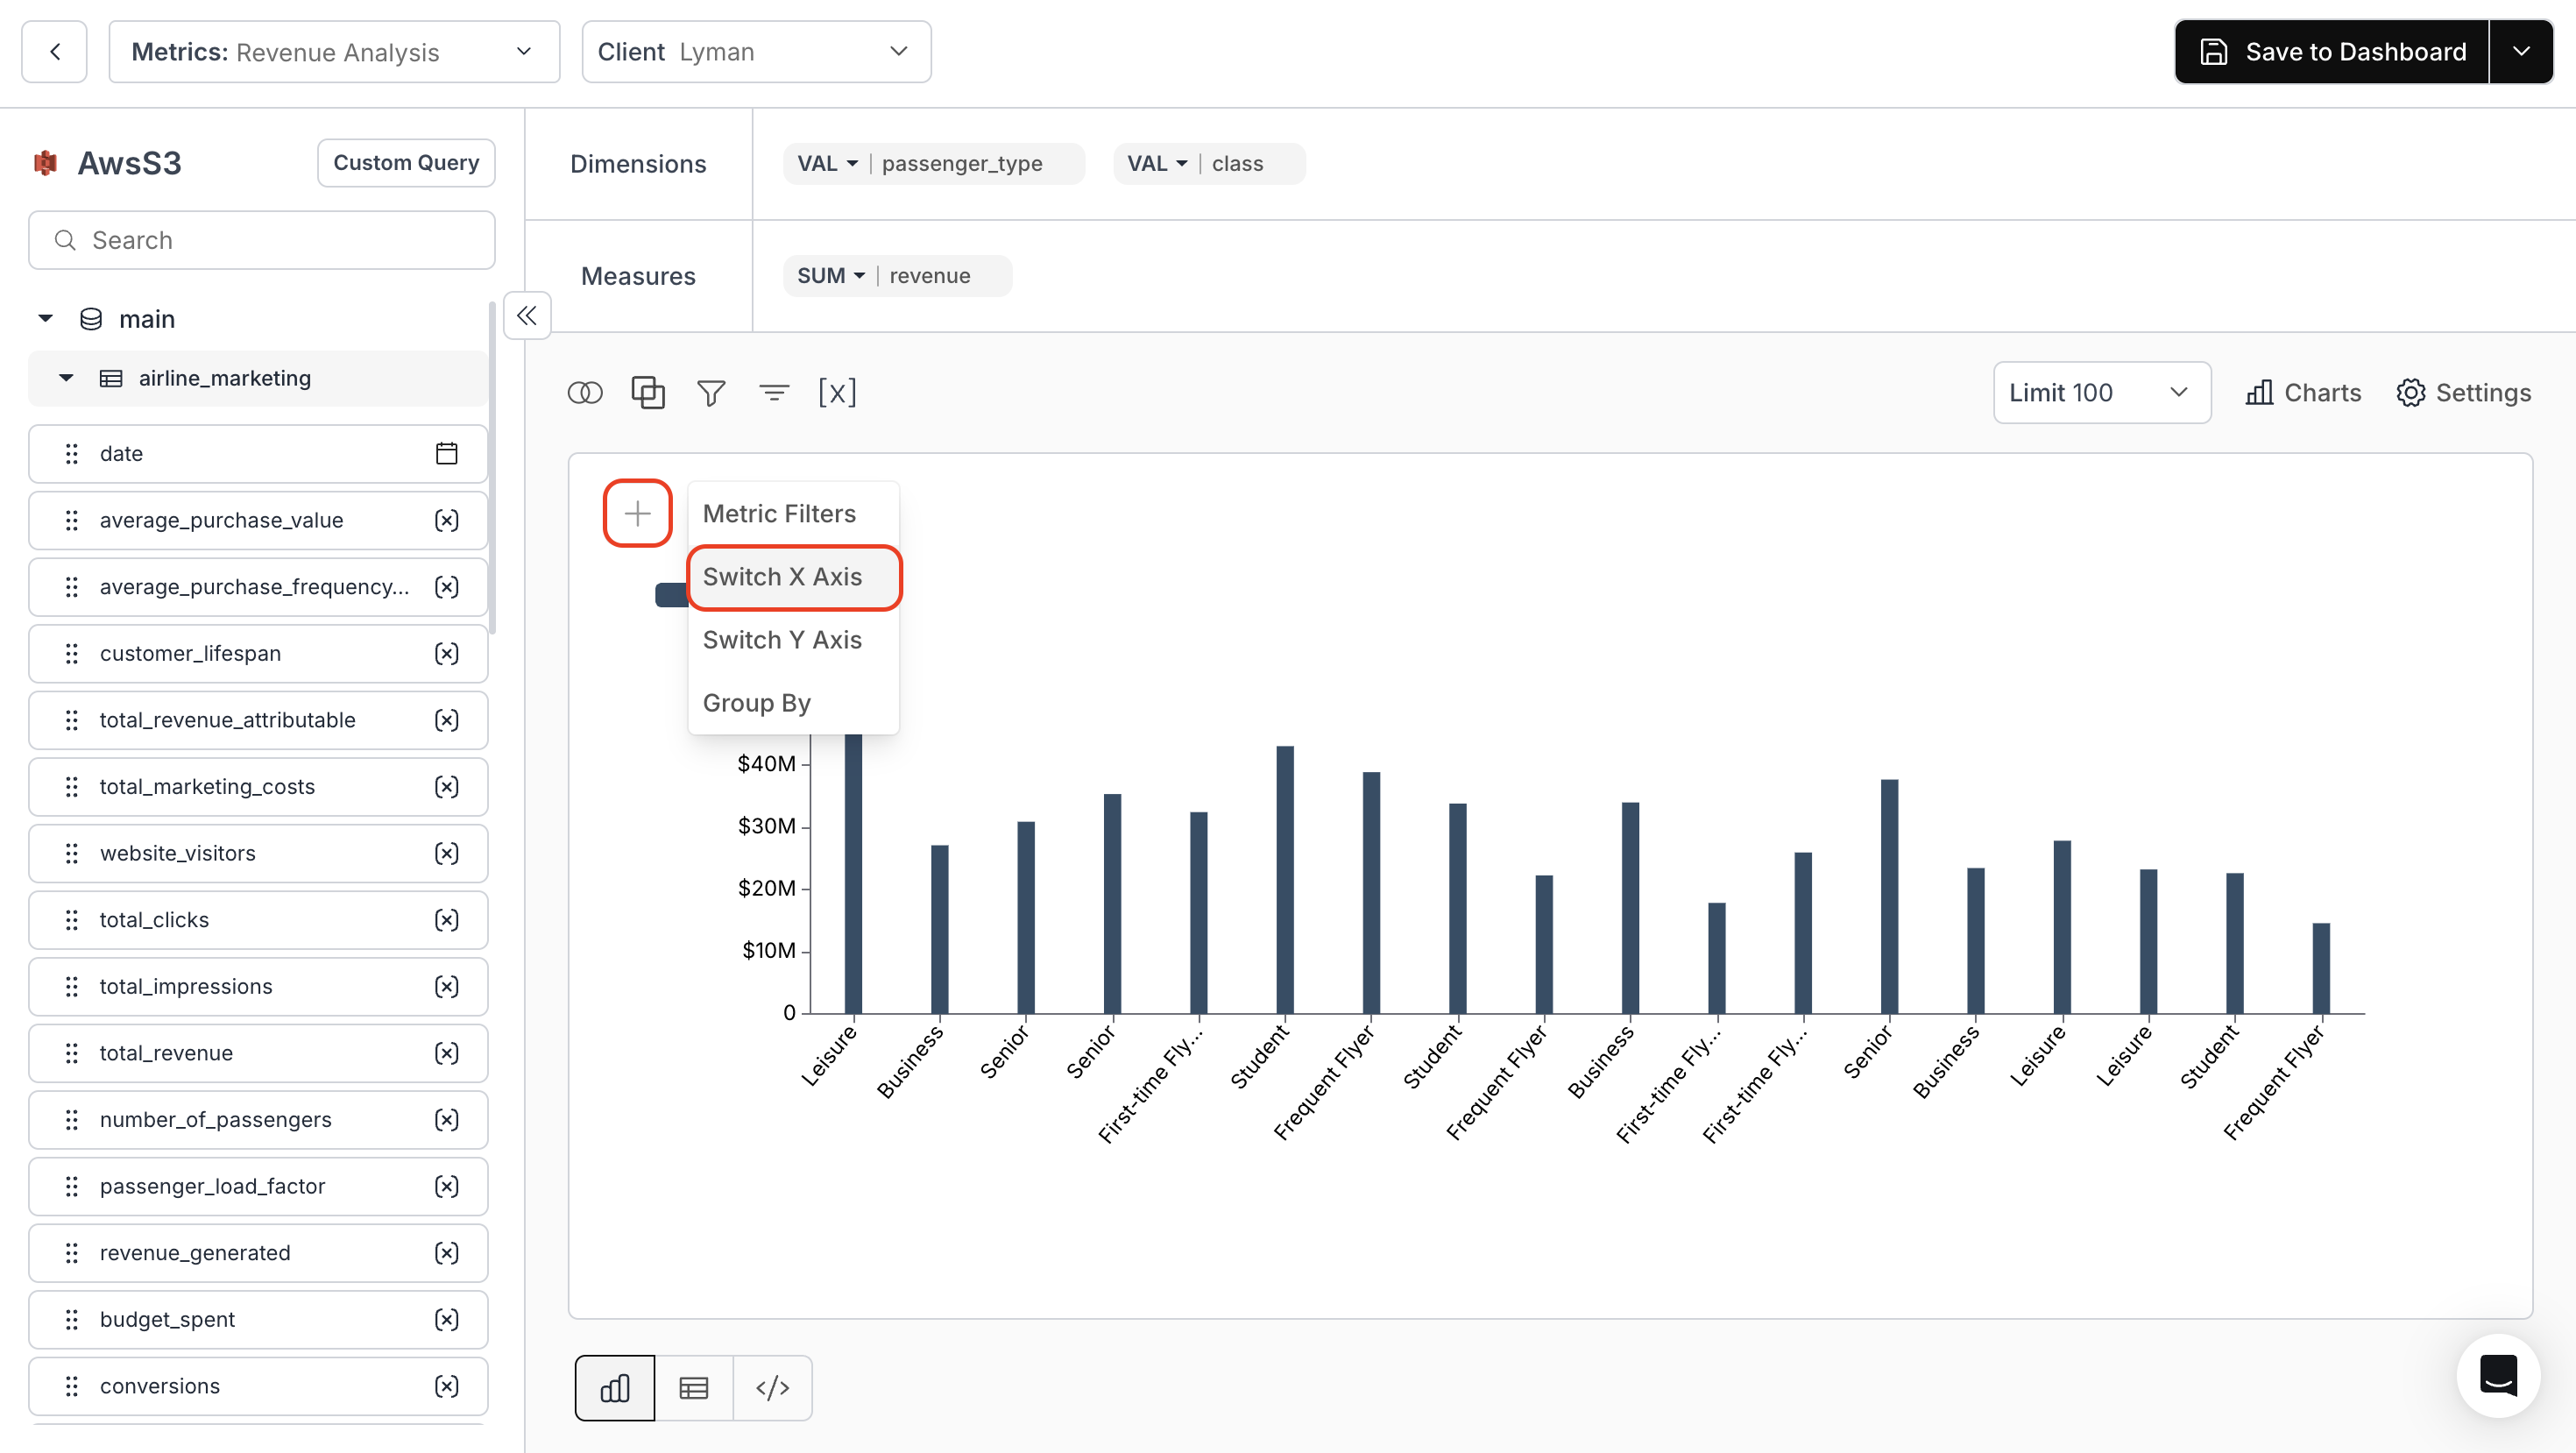
2. Switch Y Axis:
Click on the ”+” icon on top of the metric and click on “Switch Y Axis” button.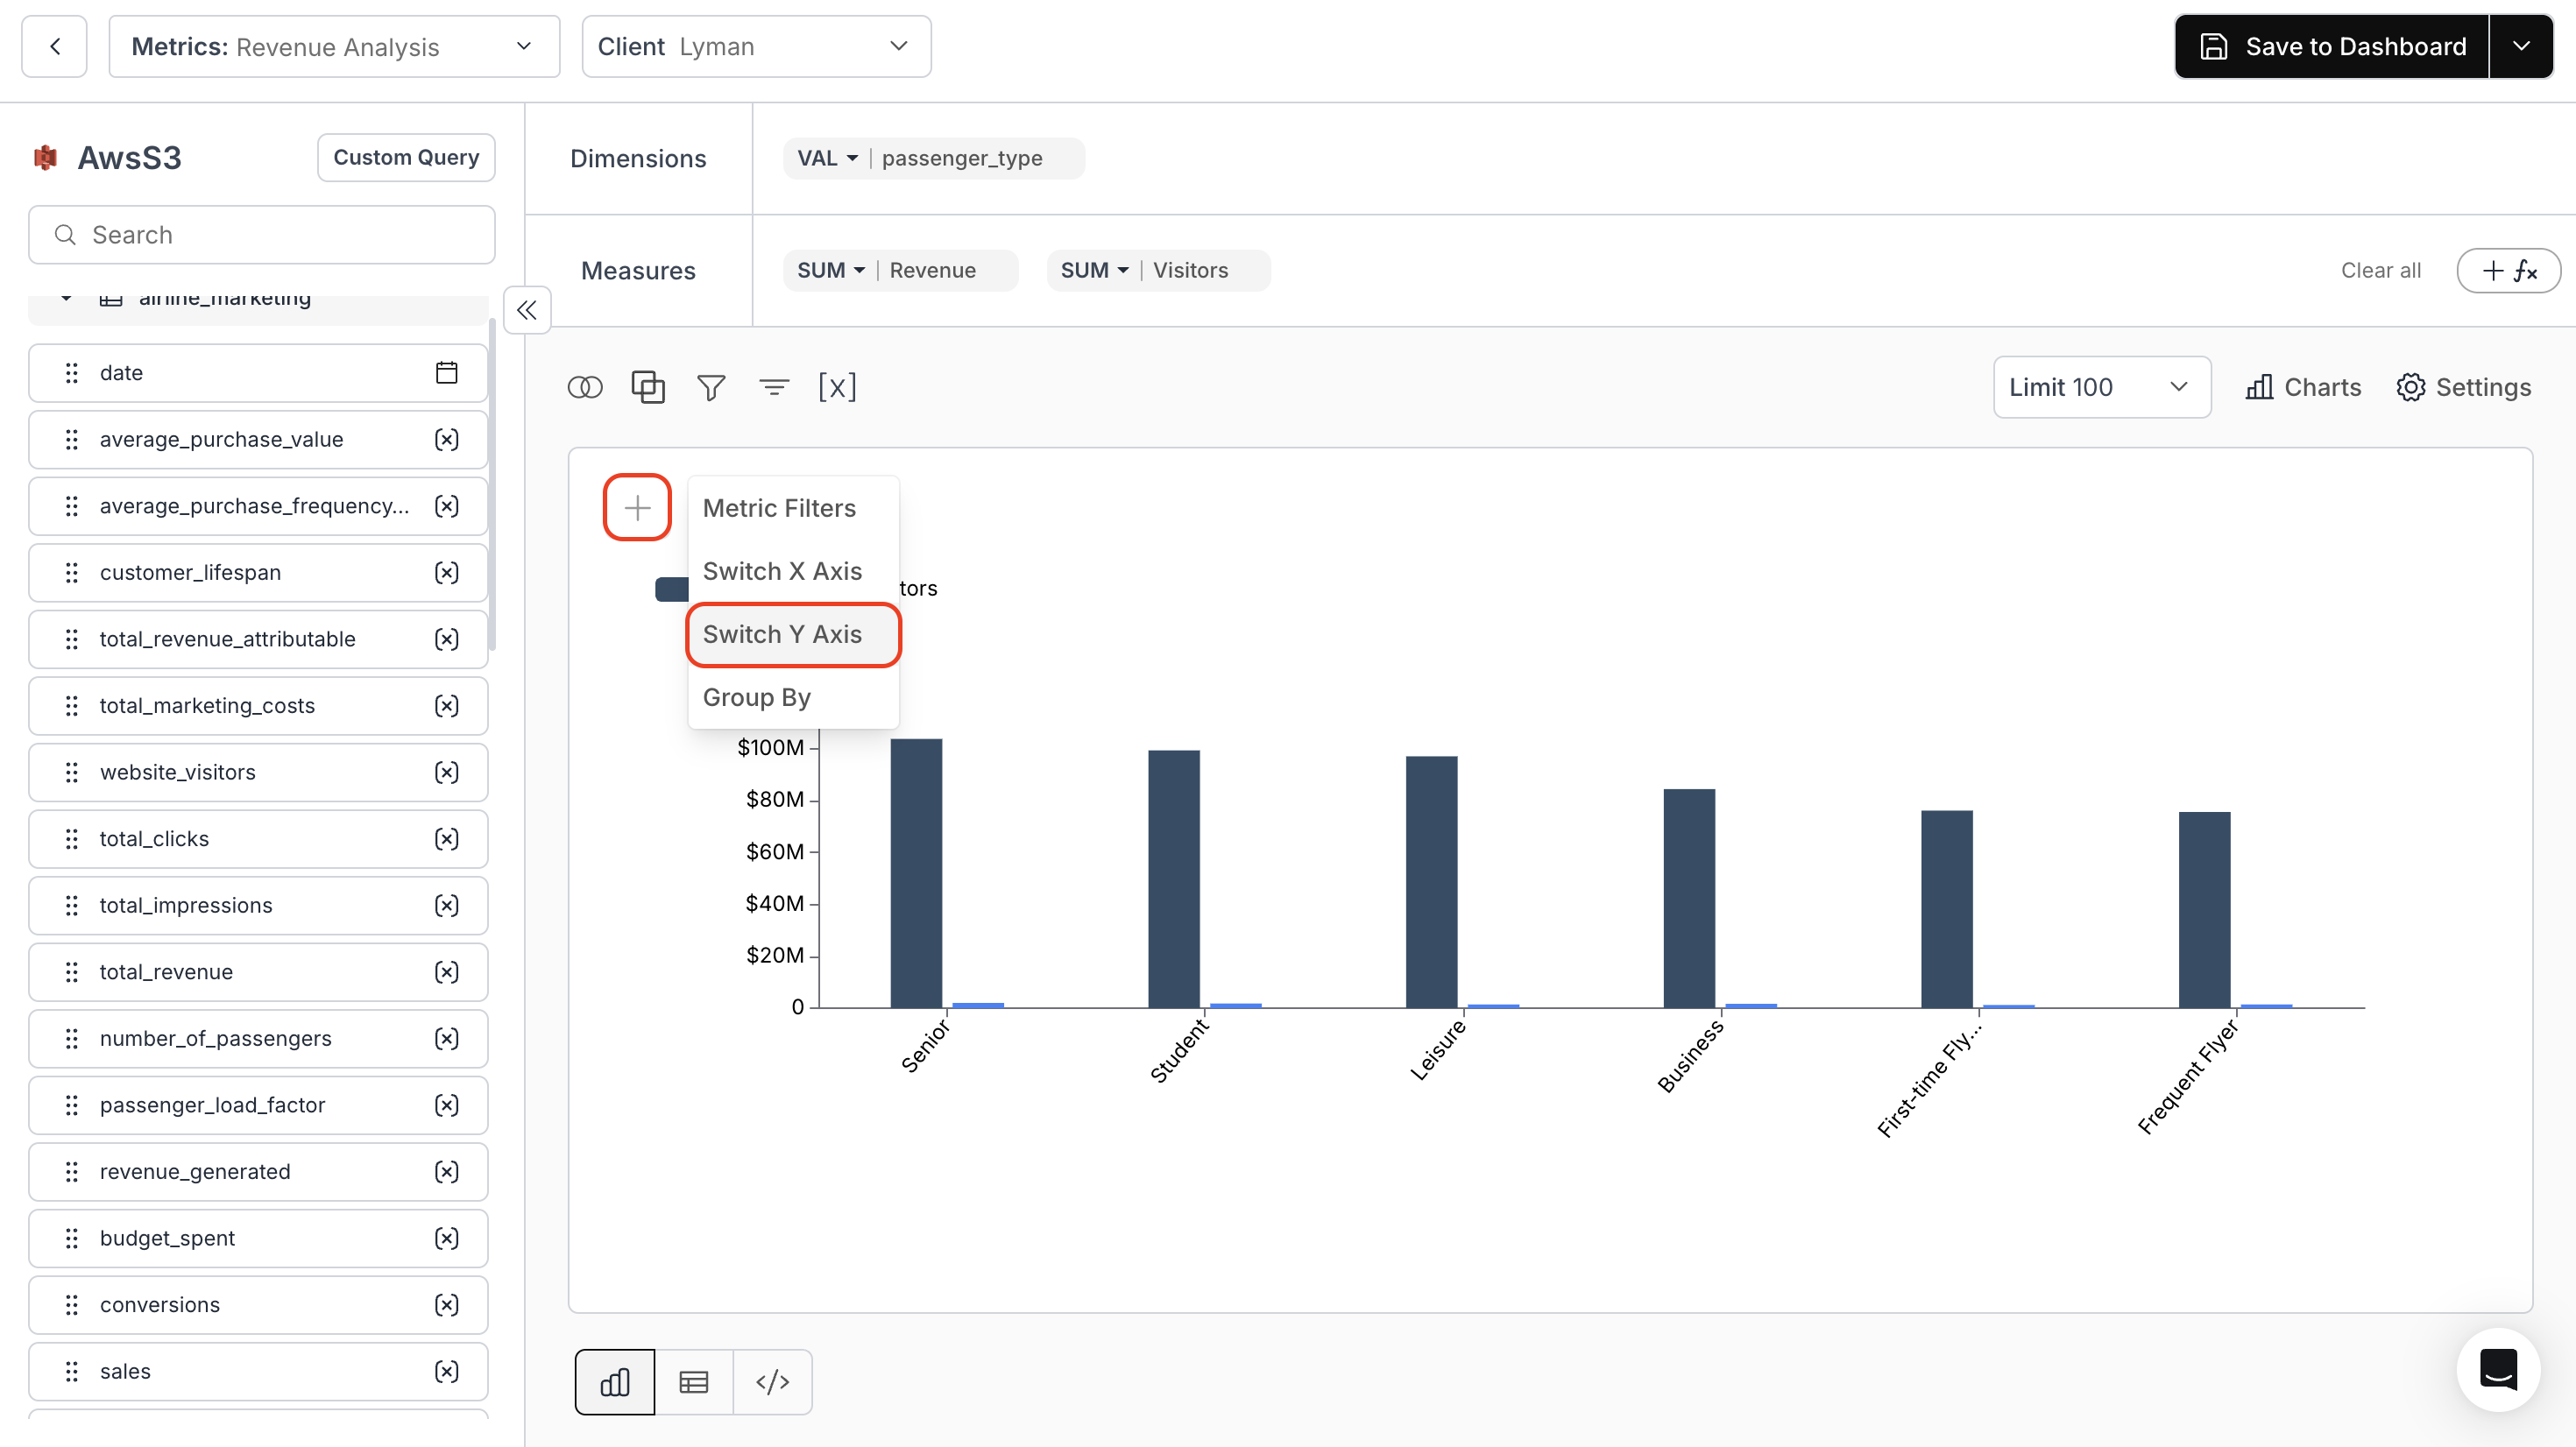
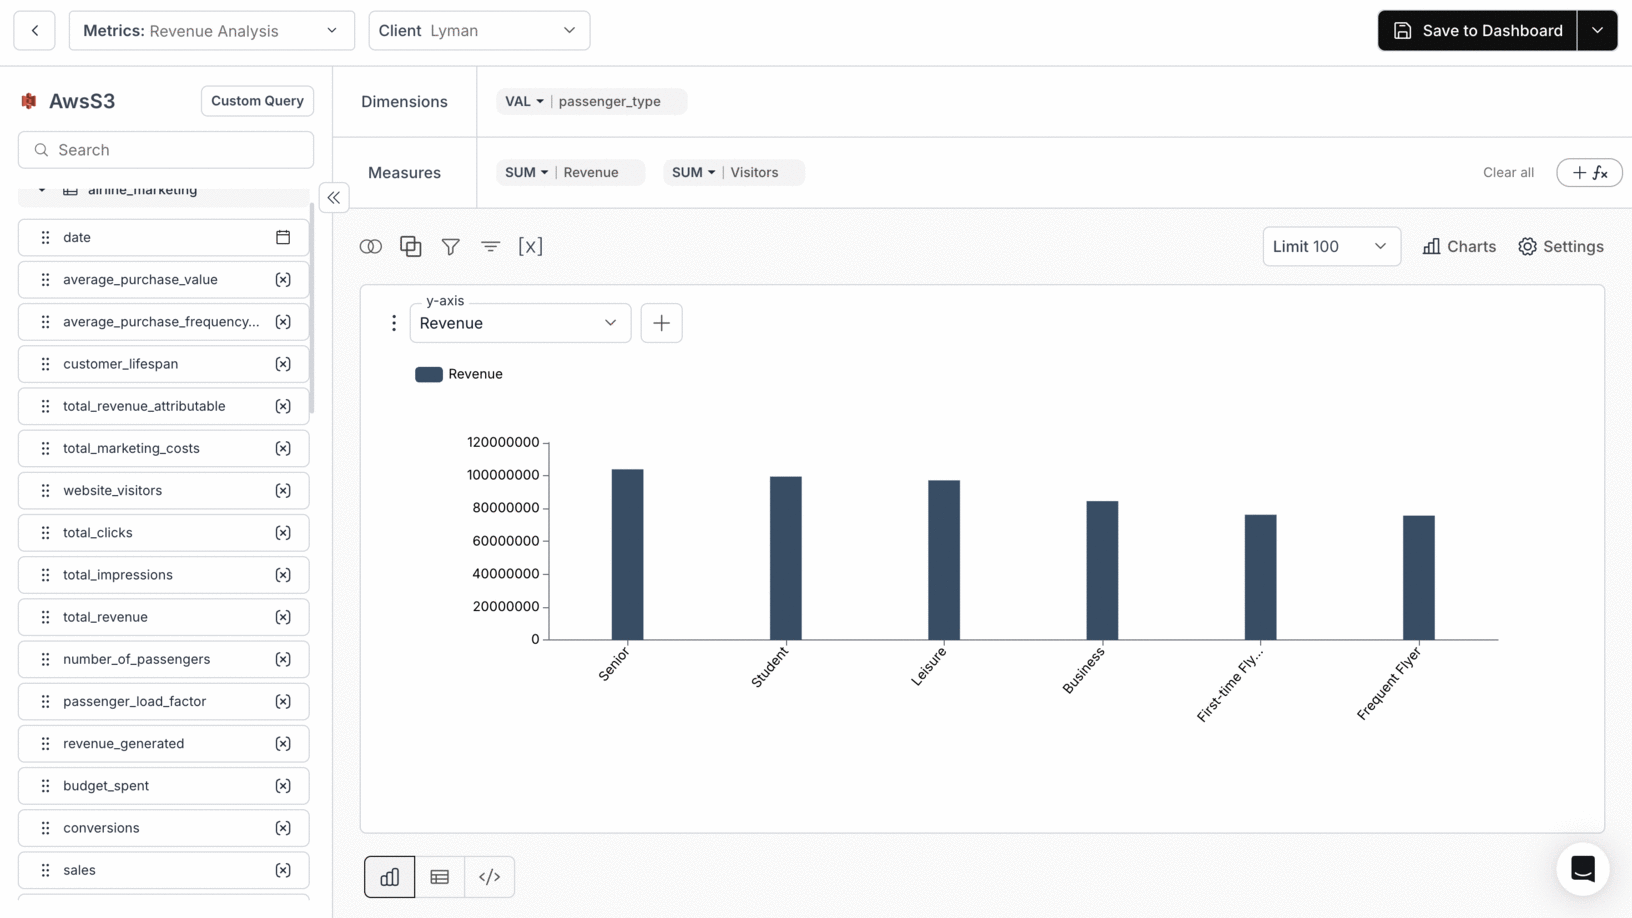
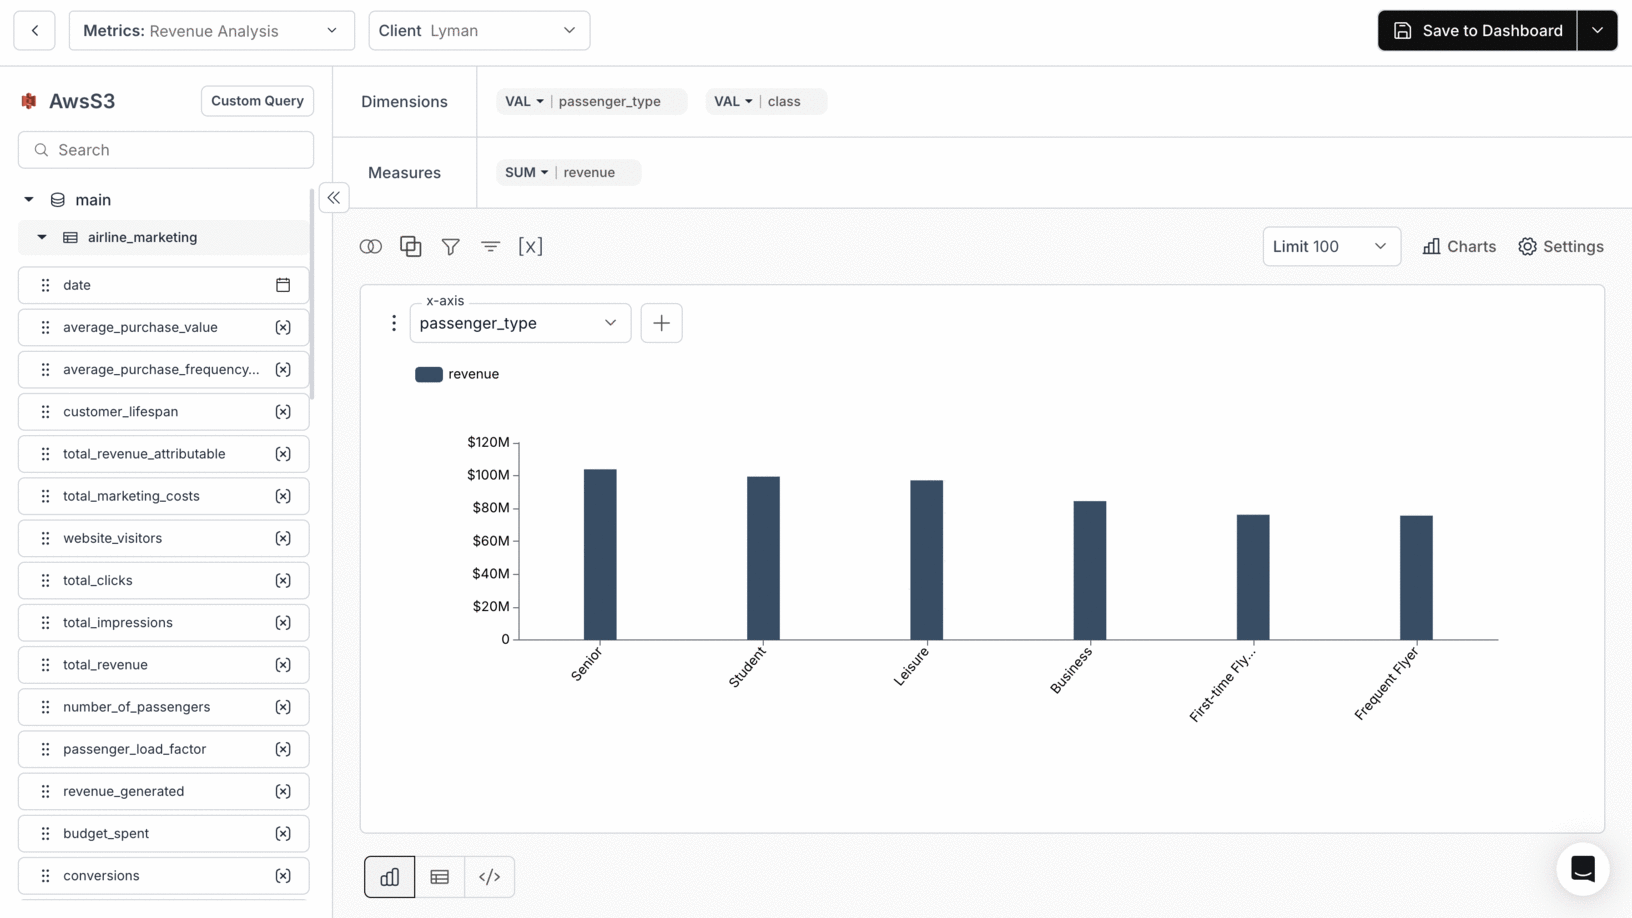
You’ve successfully switched the X and Y axes in your metric!
Your visualizations will now adapt dynamically, allowing deeper analysis from multiple perspectives.
Your visualizations will now adapt dynamically, allowing deeper analysis from multiple perspectives.