Guides
Visit our websiteDeveloper Docs
  • Getting Started with Databrain
    • What is Databrain?
  • ❄️Onboarding & Configuration
    • 📝Sign-Up
    • ✍️Sign-In
    • ✏️Google Sign In Setup for Self-hosted app
    • 🤔Forgot password? Recover your Databrain Account
    • 🌟Onboarding
    • 💾Add a Data Source
    • 🧑Configure Tenants
    • 🆕Create a Workspace
    • 🔓Create a Private Workspace
    • 🆕Create a Dashboard
    • 💠Create a Metric
      • Create Custom Columns
      • Create a Metric using Chat Mode
      • Create a Metric using Custom SQL
    • Workspace Settings
      • General Settings
      • Access Control Settings
      • Cache Settings
      • Download Settings
    • 🗄️Explore Data
  • 🛢️Datasources
    • Connecting Data Sources to Databrain
      • Amazon Redshift
      • Snowflake
      • BigQuery
      • MySQL
      • Postgres
      • MongoDB
      • ElasticSearch
      • DataBricks
      • ClickHouse
      • MSSQL
      • Amazon S3
      • CSV
      • Firebolt
      • SingleStore
      • Athena
    • Allow Access to our IP
    • Add a Data Source
    • Configure Tenants
    • How to Sync a Data Source
    • Edit Tenancy
    • Create a Datamart
    • Semantic Layer
    • Create a Data App
    • Creating a Custom Dataset/View in a Multi-Datasource Environment
  • Workspace
    • Multi Datasource Workspace
  • 🔍DASHBOARDS
    • Edit a Dashboard
    • Share Dashboard
    • Dashboard Settings
    • Create/Modify Dashboard Filter
      • Dashboard Filter - Variable Apply On
      • Add LHS and RHS custom sql support for dashboard filter
    • Customize Layout
    • Adding Elements to Dashboard
    • Import/Export Dashboard
    • Report Scheduler
  • 📉METRIC
    • Edit a Metric
    • Joins , Filter, Sort, Group By
    • Complex Filter
    • Apply Metric Filter
      • Metric Filter - Variable
      • Metric Filter - Custom
    • Switch X axis and Switch Y axis
    • Group By
    • Footnote and Long Description
    • Dynamic Property
    • Archive/Unarchive Metric Card
    • Download Metric Card
    • Download Underlying Data
    • Metric Summary
    • Metric Expression for Single Value Card
    • AI Summary
    • Merge Metrics
    • Section Filters
    • View Unpublished Metrics
  • 📊VISUALIZATIONS - ACTIONS & APPEARANCE
    • Chart Actions
      • Chart Click Action
      • Chart Click Action with Metric
      • Card Click Action
      • Drill Down
      • Cross Dashboard Drill Down
    • Chart Appearance
      • Chart-Specific Appearance Options
  • 🛢️PREVIEW OF DASHBOARDS
    • Email Settings for Scheduled Reports
    • Scheduled Reports for End User
  • 🔍FILTERS
    • Dashboard Filter
    • Metric Filter
    • App filter
  • 💡Features
    • Python Editor Console
    • Custom SQL Console
    • Custom SQL Query Guidelines
  • 🏢Integrating Plugin
    • ✳️Get an auth token
    • 🙏Get a guest token
  • 🛃THEMEING & CUSTOMIZATION
    • 🎨Creating a theme
    • 🖼️View the theme in action
    • ⚙️Reset a saved theme
  • 📊Metric Component (upto version v0.11.15)
    • ✨Quick start
  • 🕸️Web Components
    • ✨Quick start
    • ⚛️Framework Specific Guide
  • 🚀Product Changelog
  • 🤳Self Hosted Changelog
Powered by GitBook
On this page
  1. METRIC

Metric Summary

This guide provides a straightforward process for creating metric summaries. These summaries can be added directly as text boxes within your dashboard, providing quick insights at a glance.

PreviousDownload Underlying DataNextMetric Expression for Single Value Card

Last updated 1 month ago

  1. Navigate to Elements section

Open your dashboard and click the Elements icon located next to the Add Metric button.
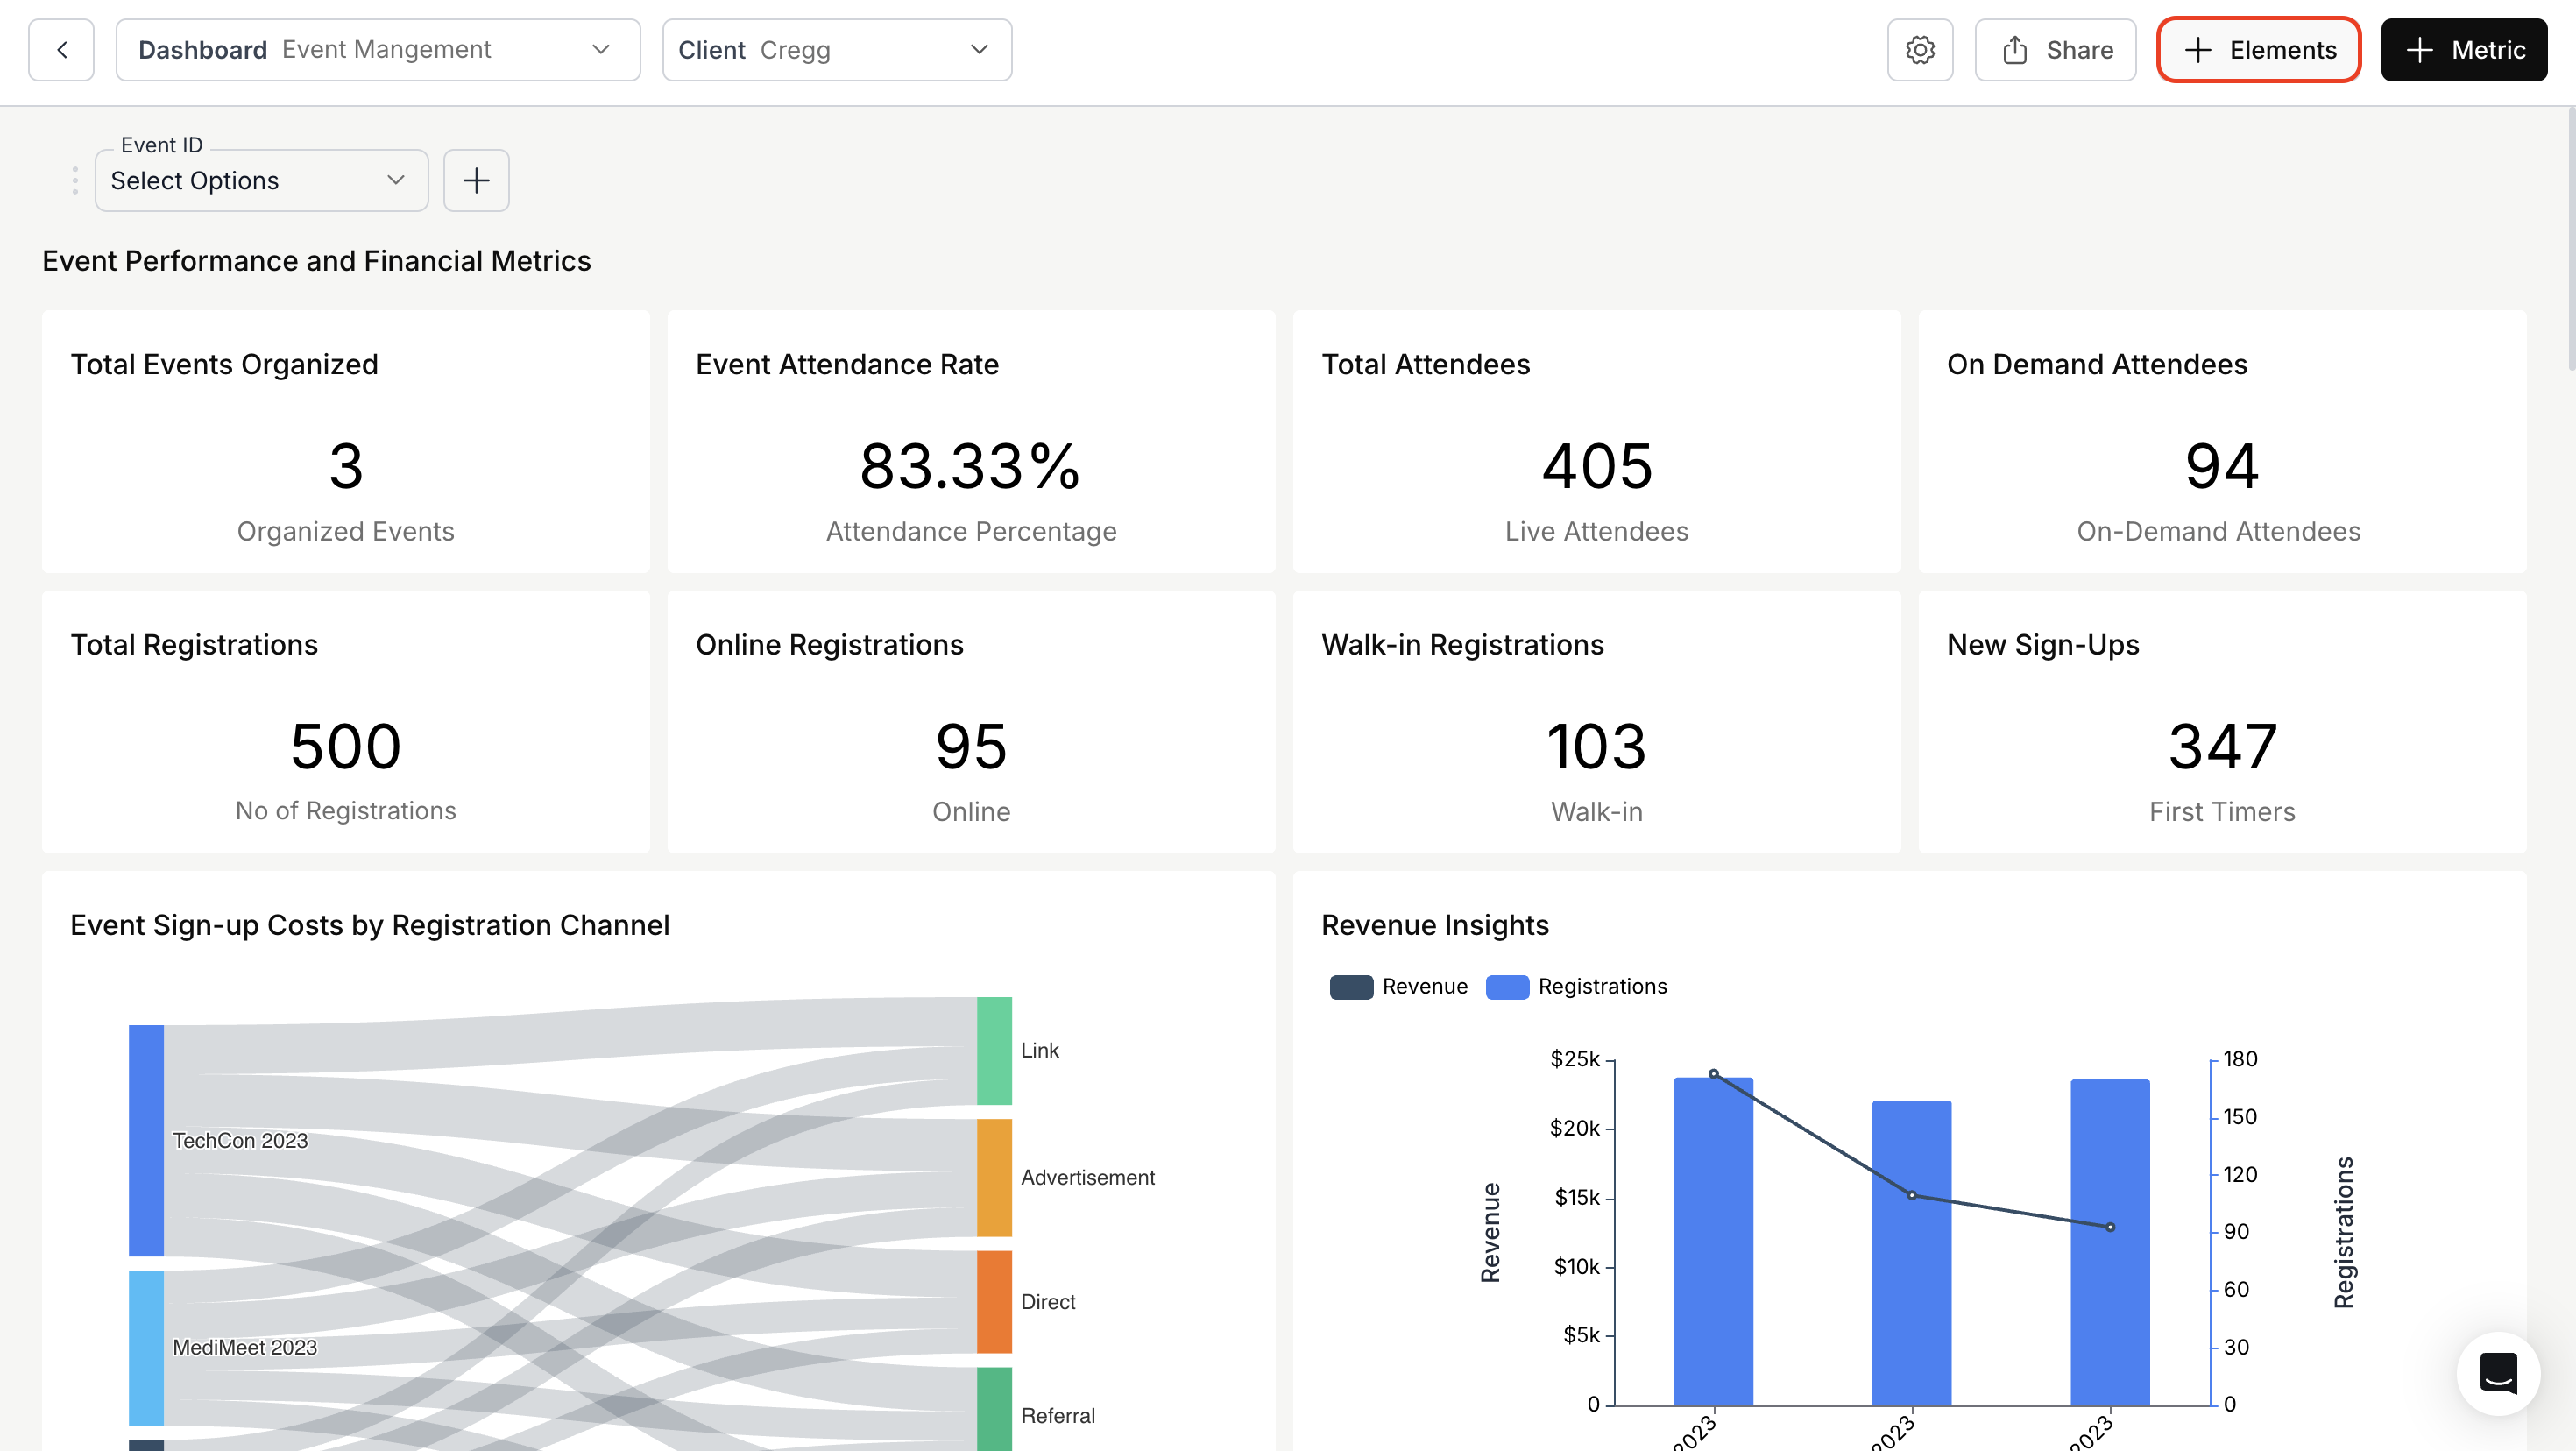
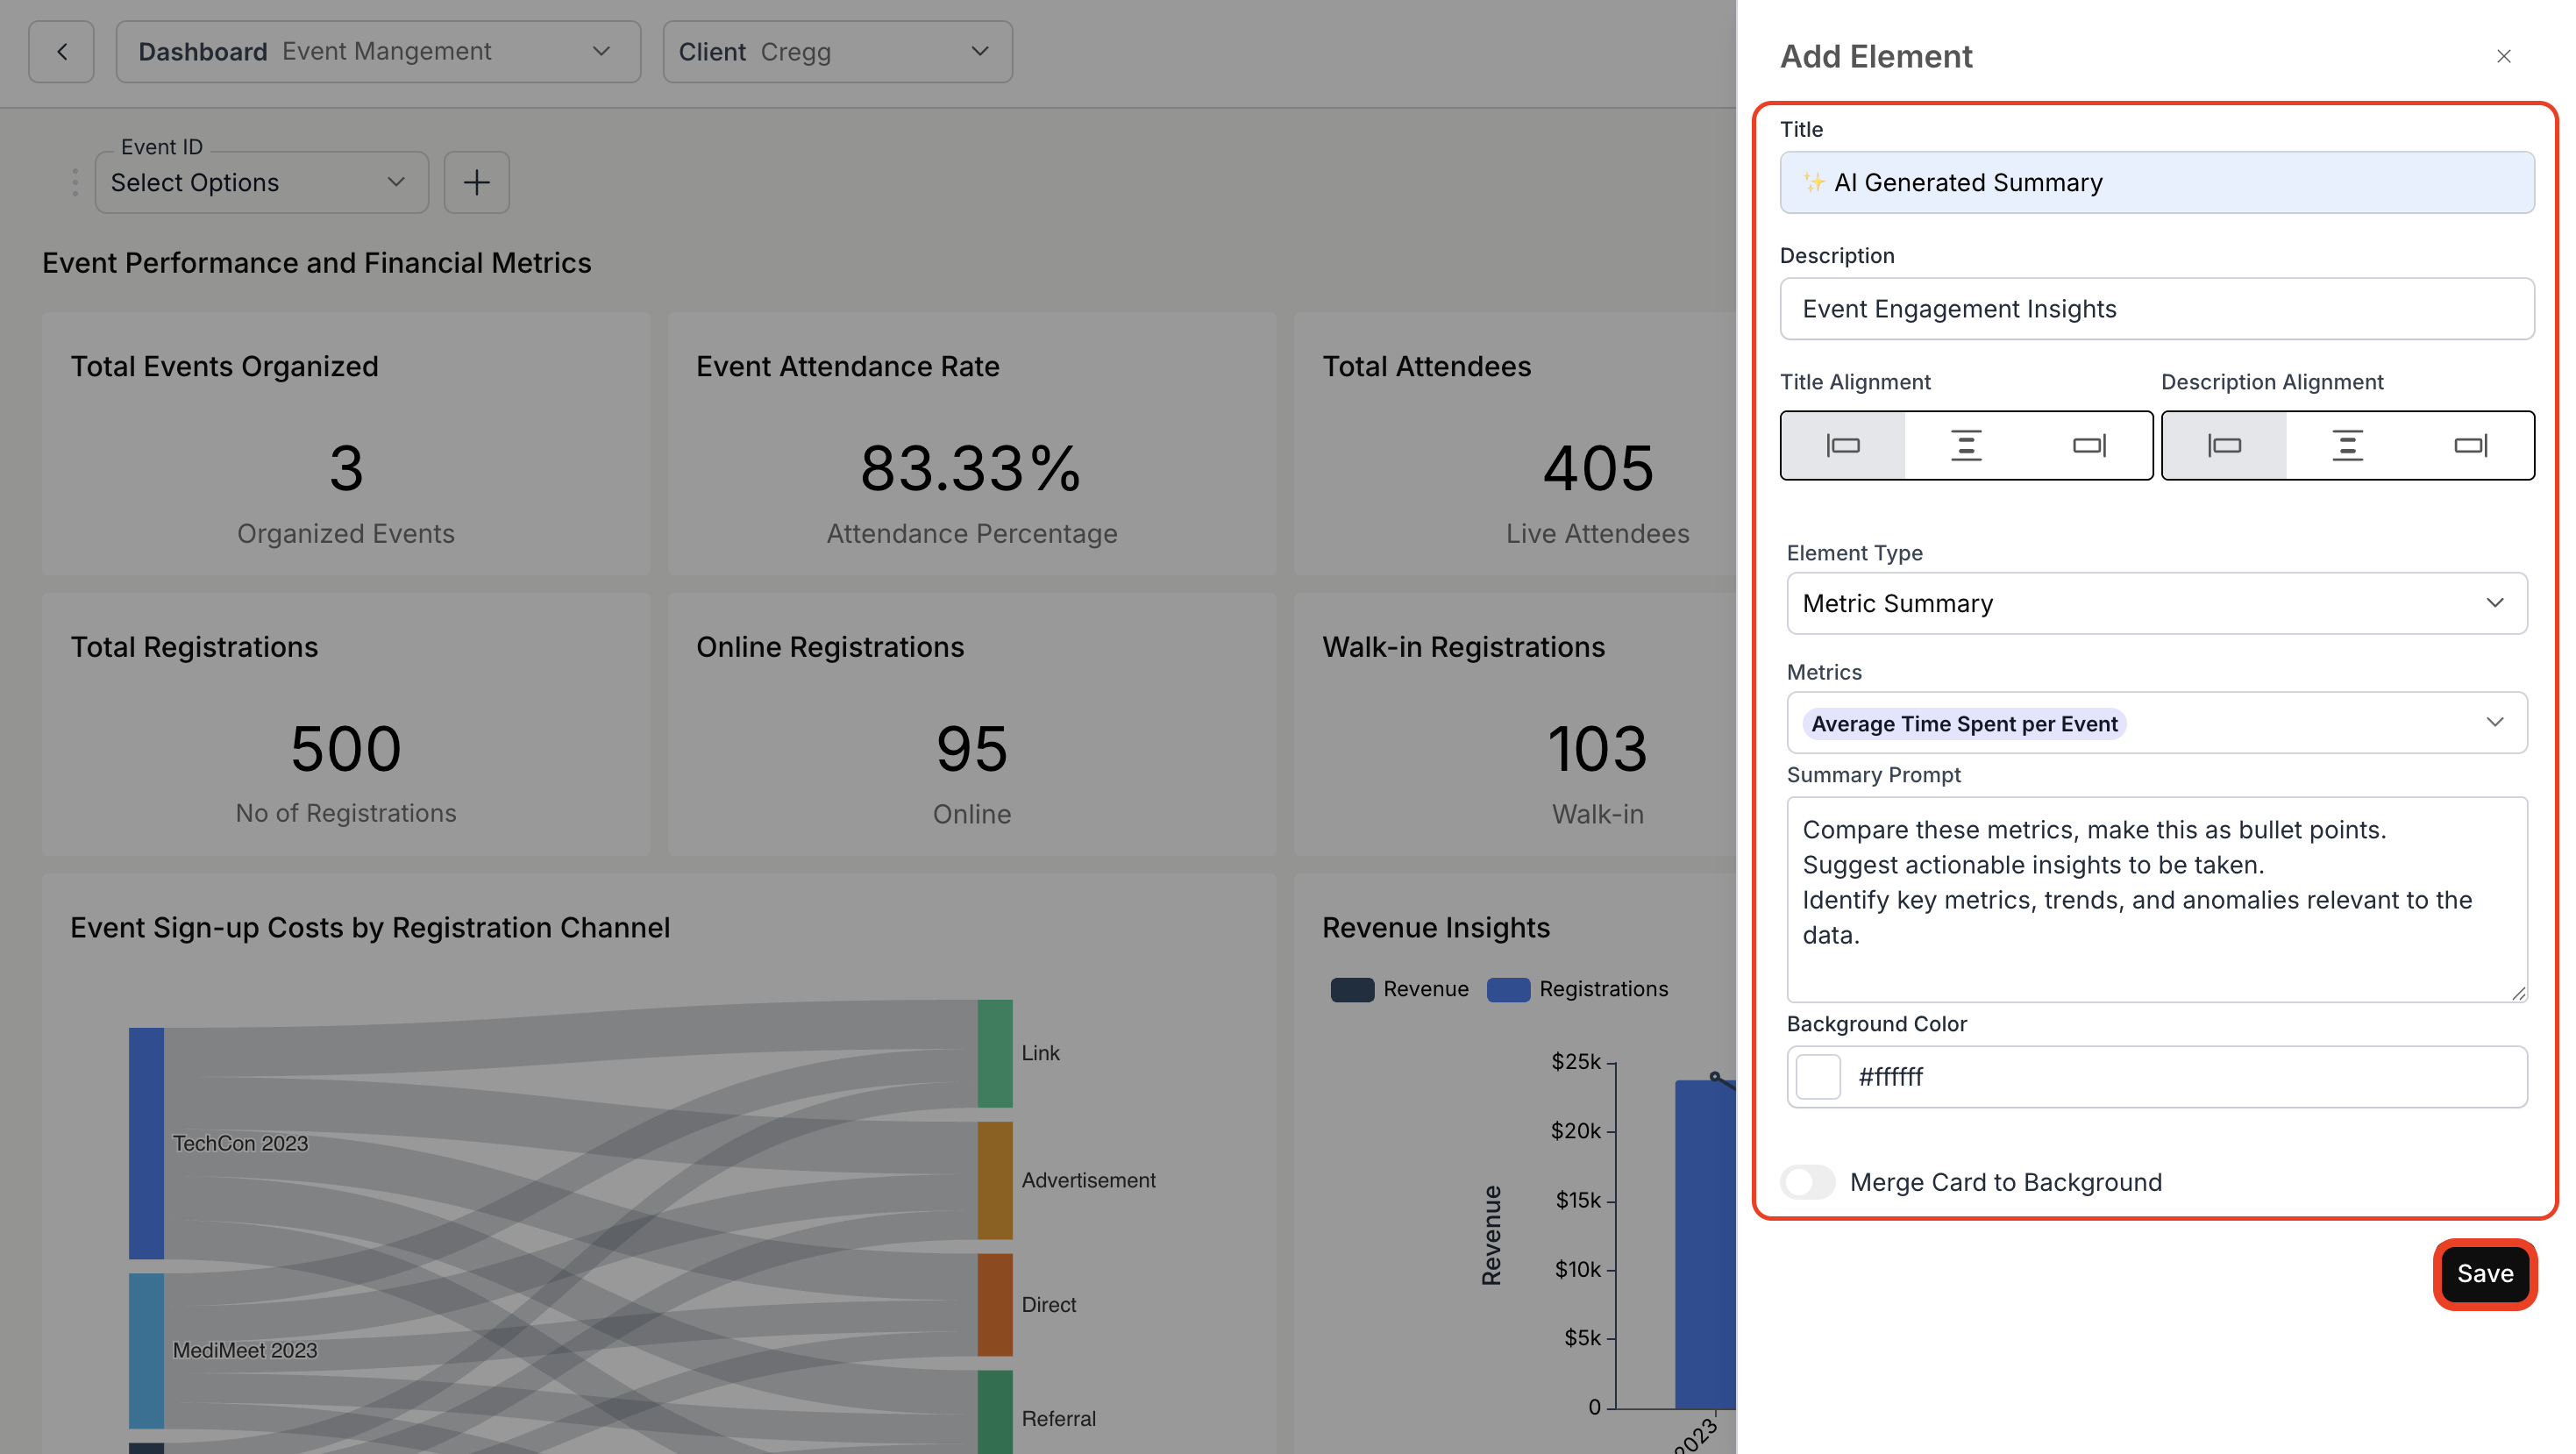
  1. Add an Element

  • Enter a title and description for your summary.

  • Adjust the alignment of the title and description as needed.

  • Select the relevant metrics from the dropdown to generate a combined summary, and input your question in the Summary Prompt.

  • Configure the font styles for the summary: font family, font size, and font weight.

  • Click Save to add the metric summary to your dashboard.

  1. View Metric Summary:

Your new metric summary will now be visible on the dashboard.
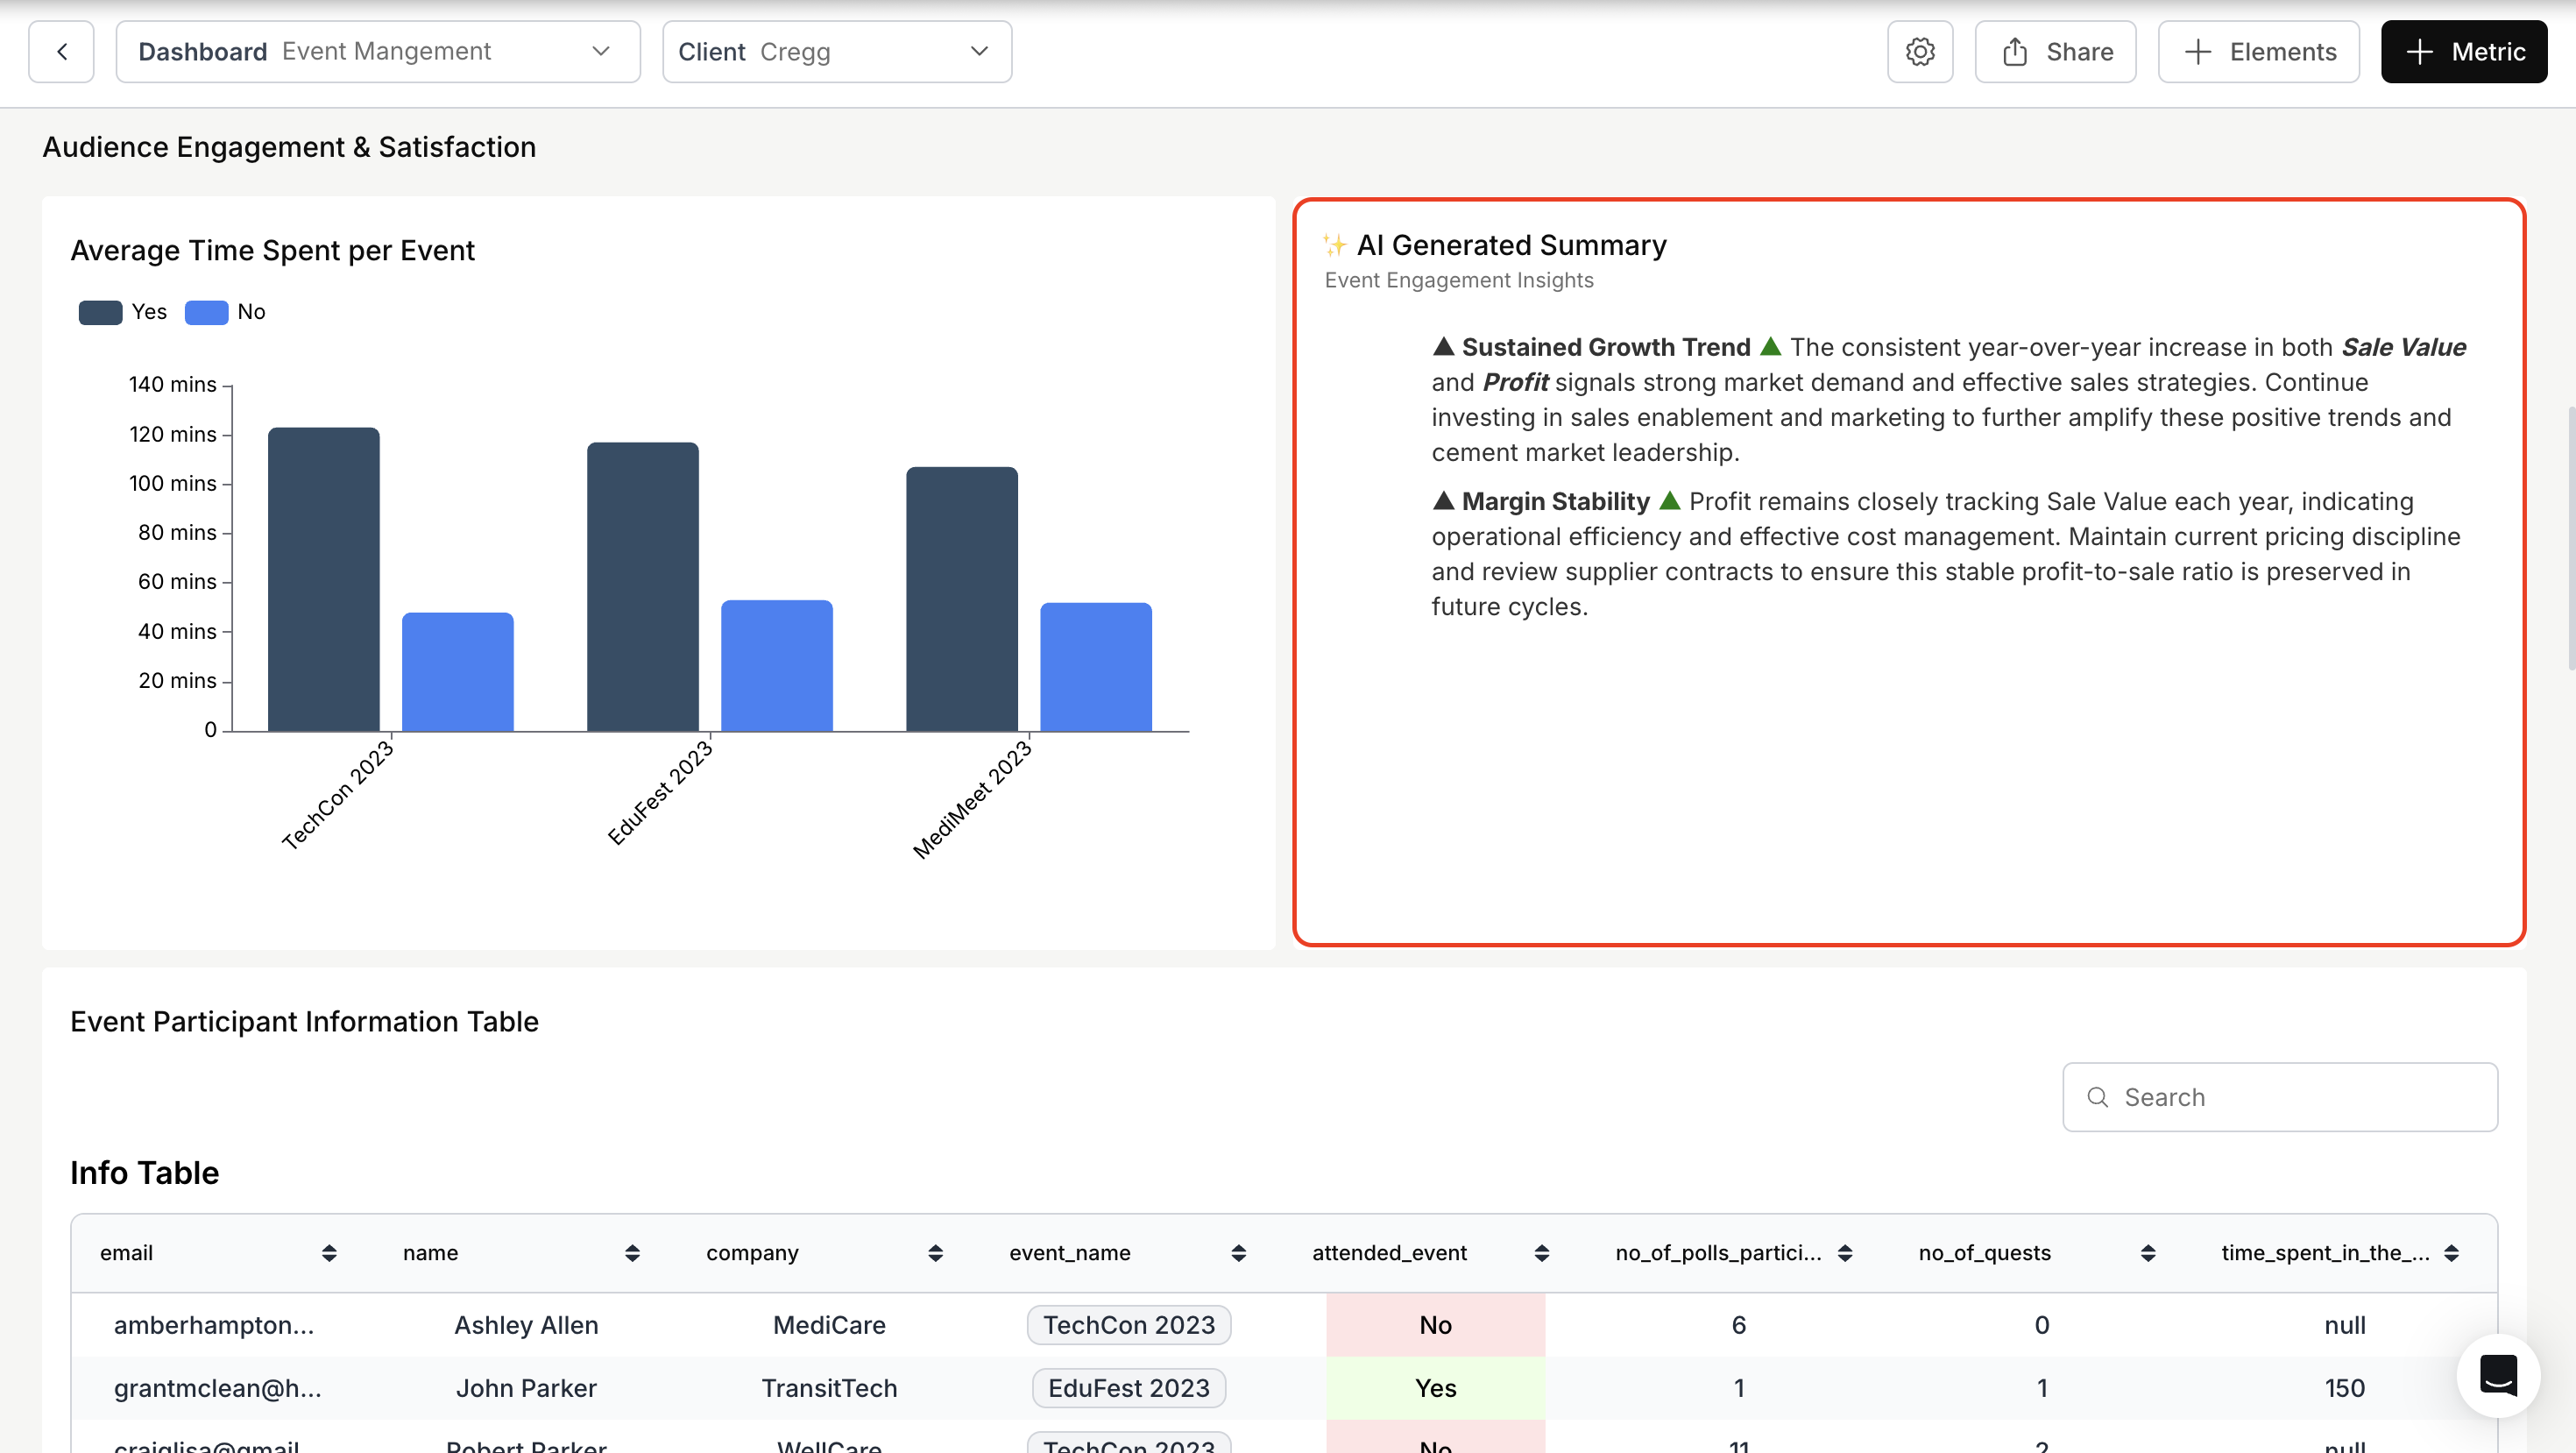
📉