Metric Expressions allow you to perform calculations using single-value card metrics by referencing their values with their Metric IDs.
Example:
We have two single value cards:
- Sales with Metric ID
{{Sales_hwPED}}, valued at $2.89B- Profit with Metric ID
{{Profi_qjvSWB}}, valued at $2.84B
To calculate the Sales Profitability Ratio, we can use a Metric Expression:
ROUND({{Sales_hwPED}}/{{Profi_qjvSWB}}, 2)
Output: A single-value card displaying 1.02
Alternatively using,
{{Sales_hwPED}}/{{Profi_qjvSWB}}
Output: A single-value card displaying
2891075848.0202847 / 2840122818.152845
1. Access Elements
Navigate to your dashboard and click on ”+ Elements” button near the create metric button.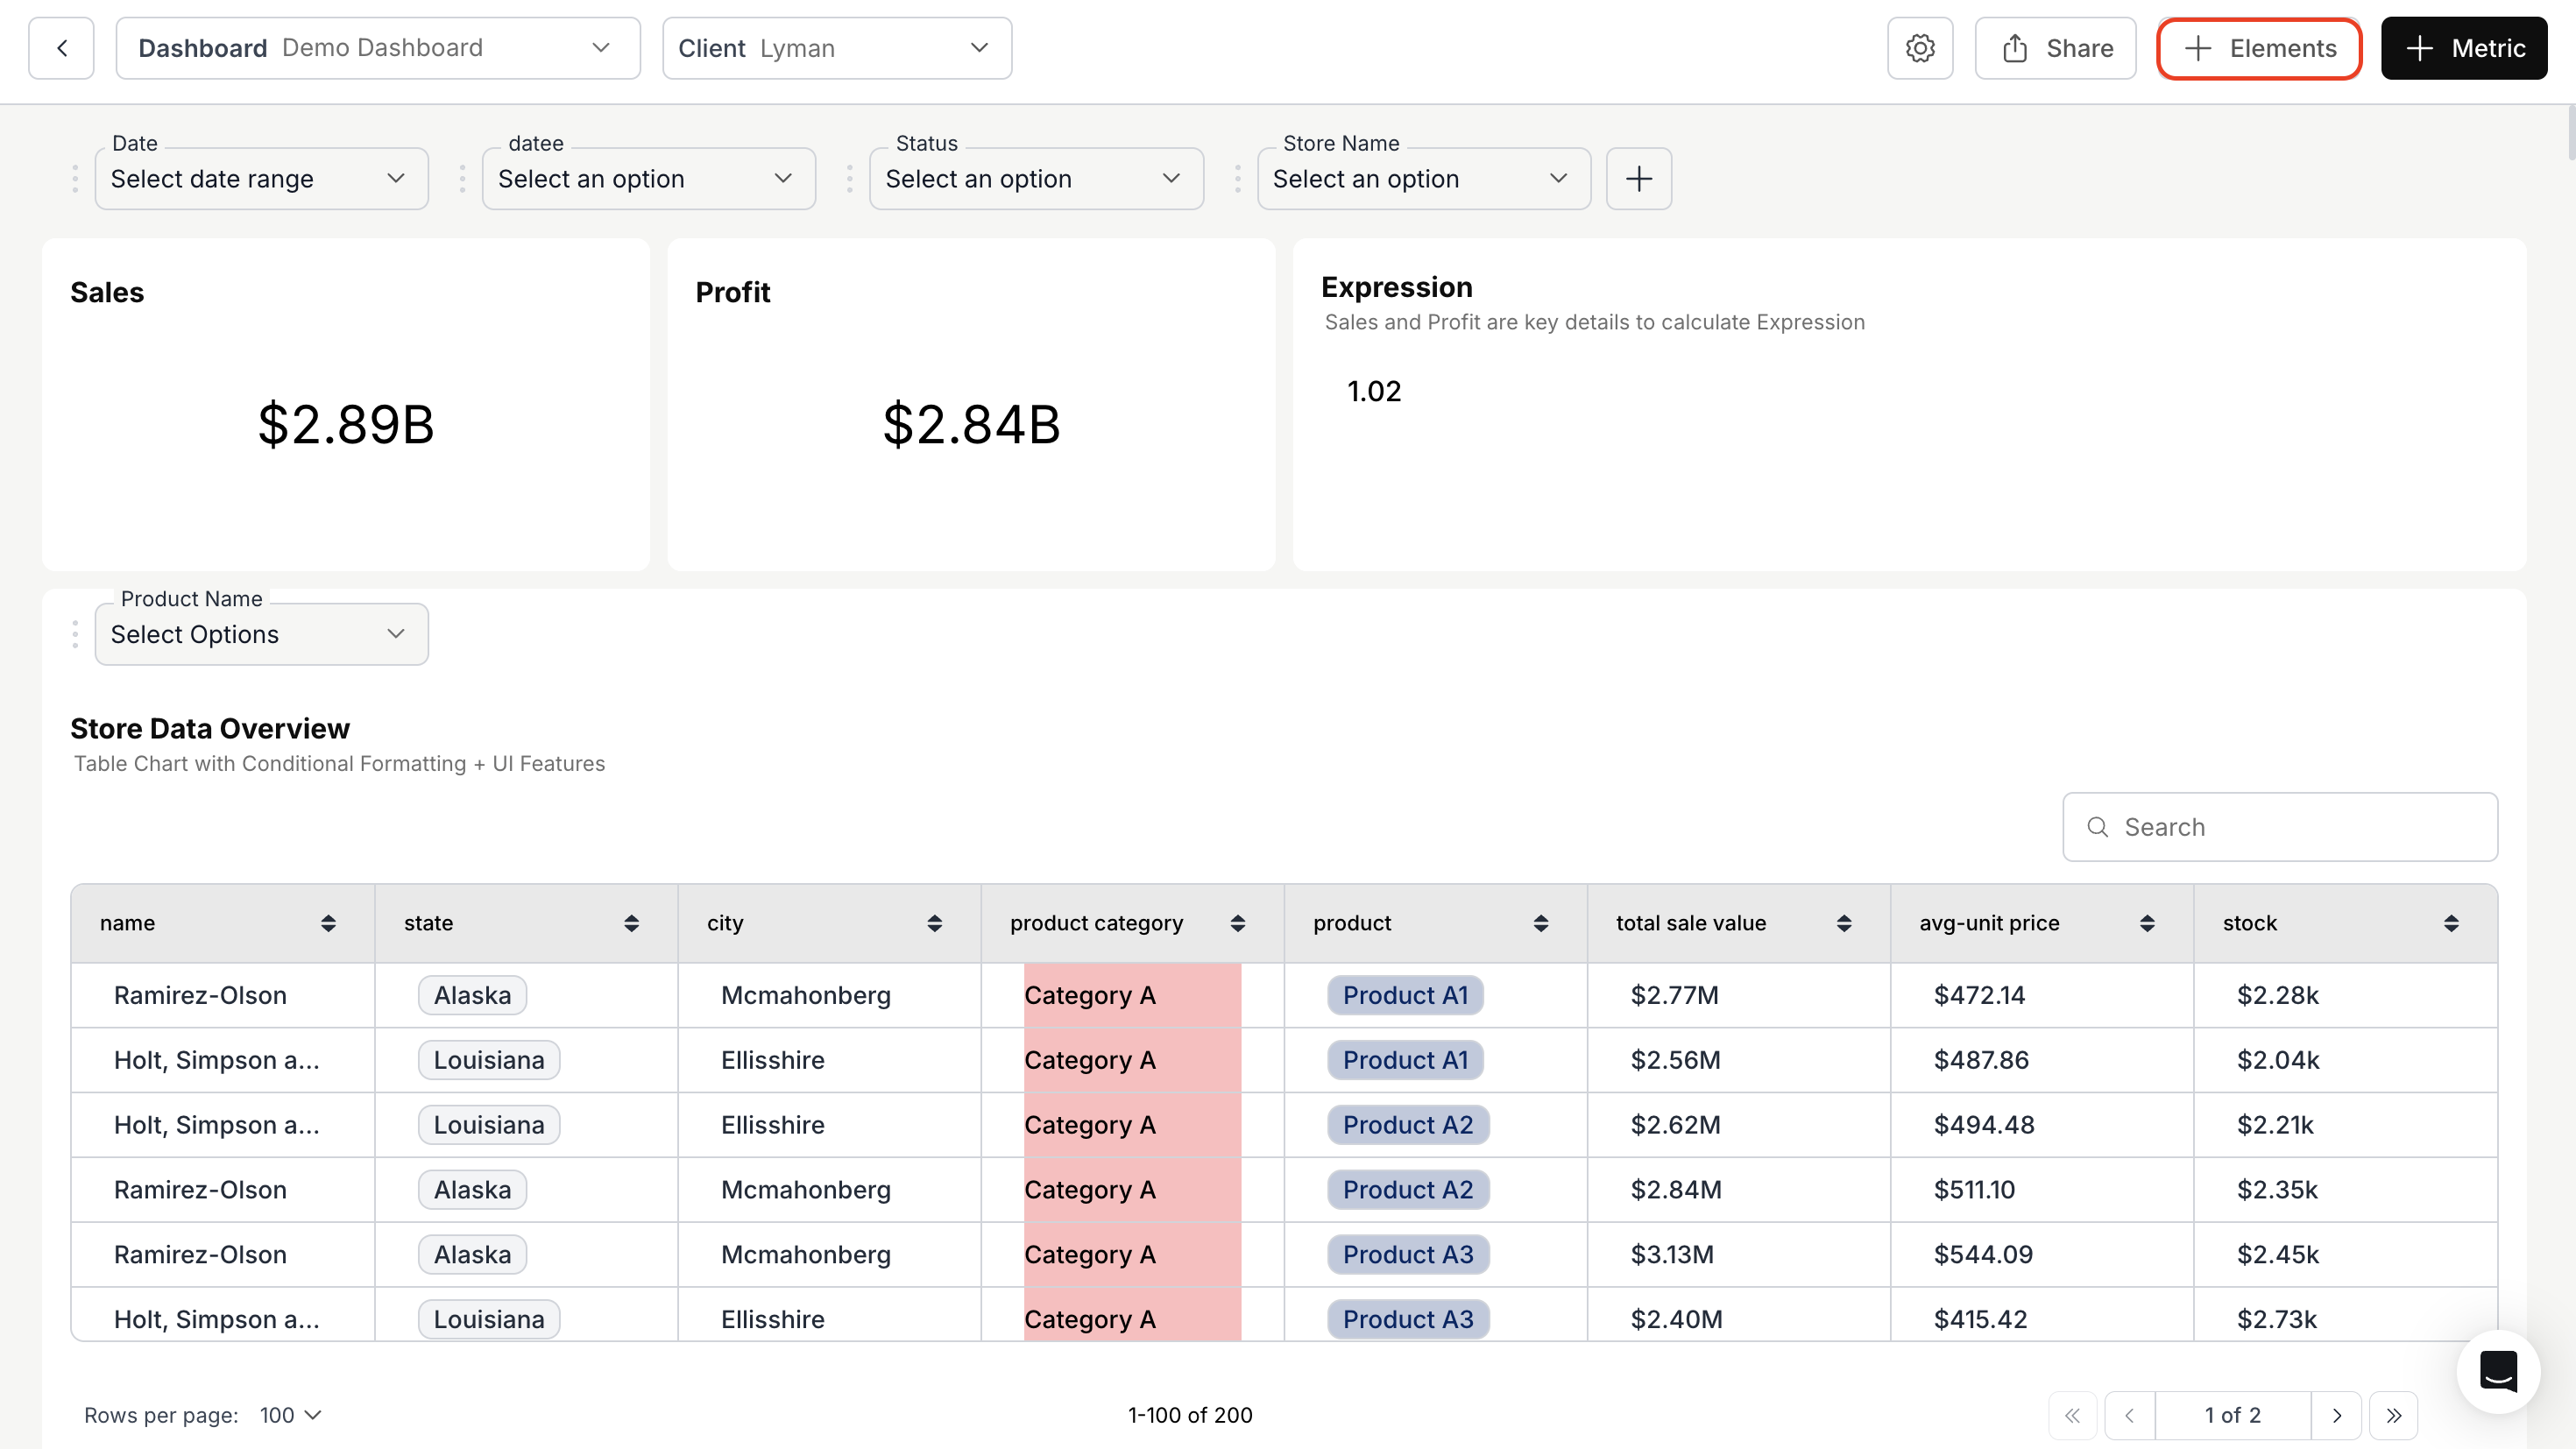
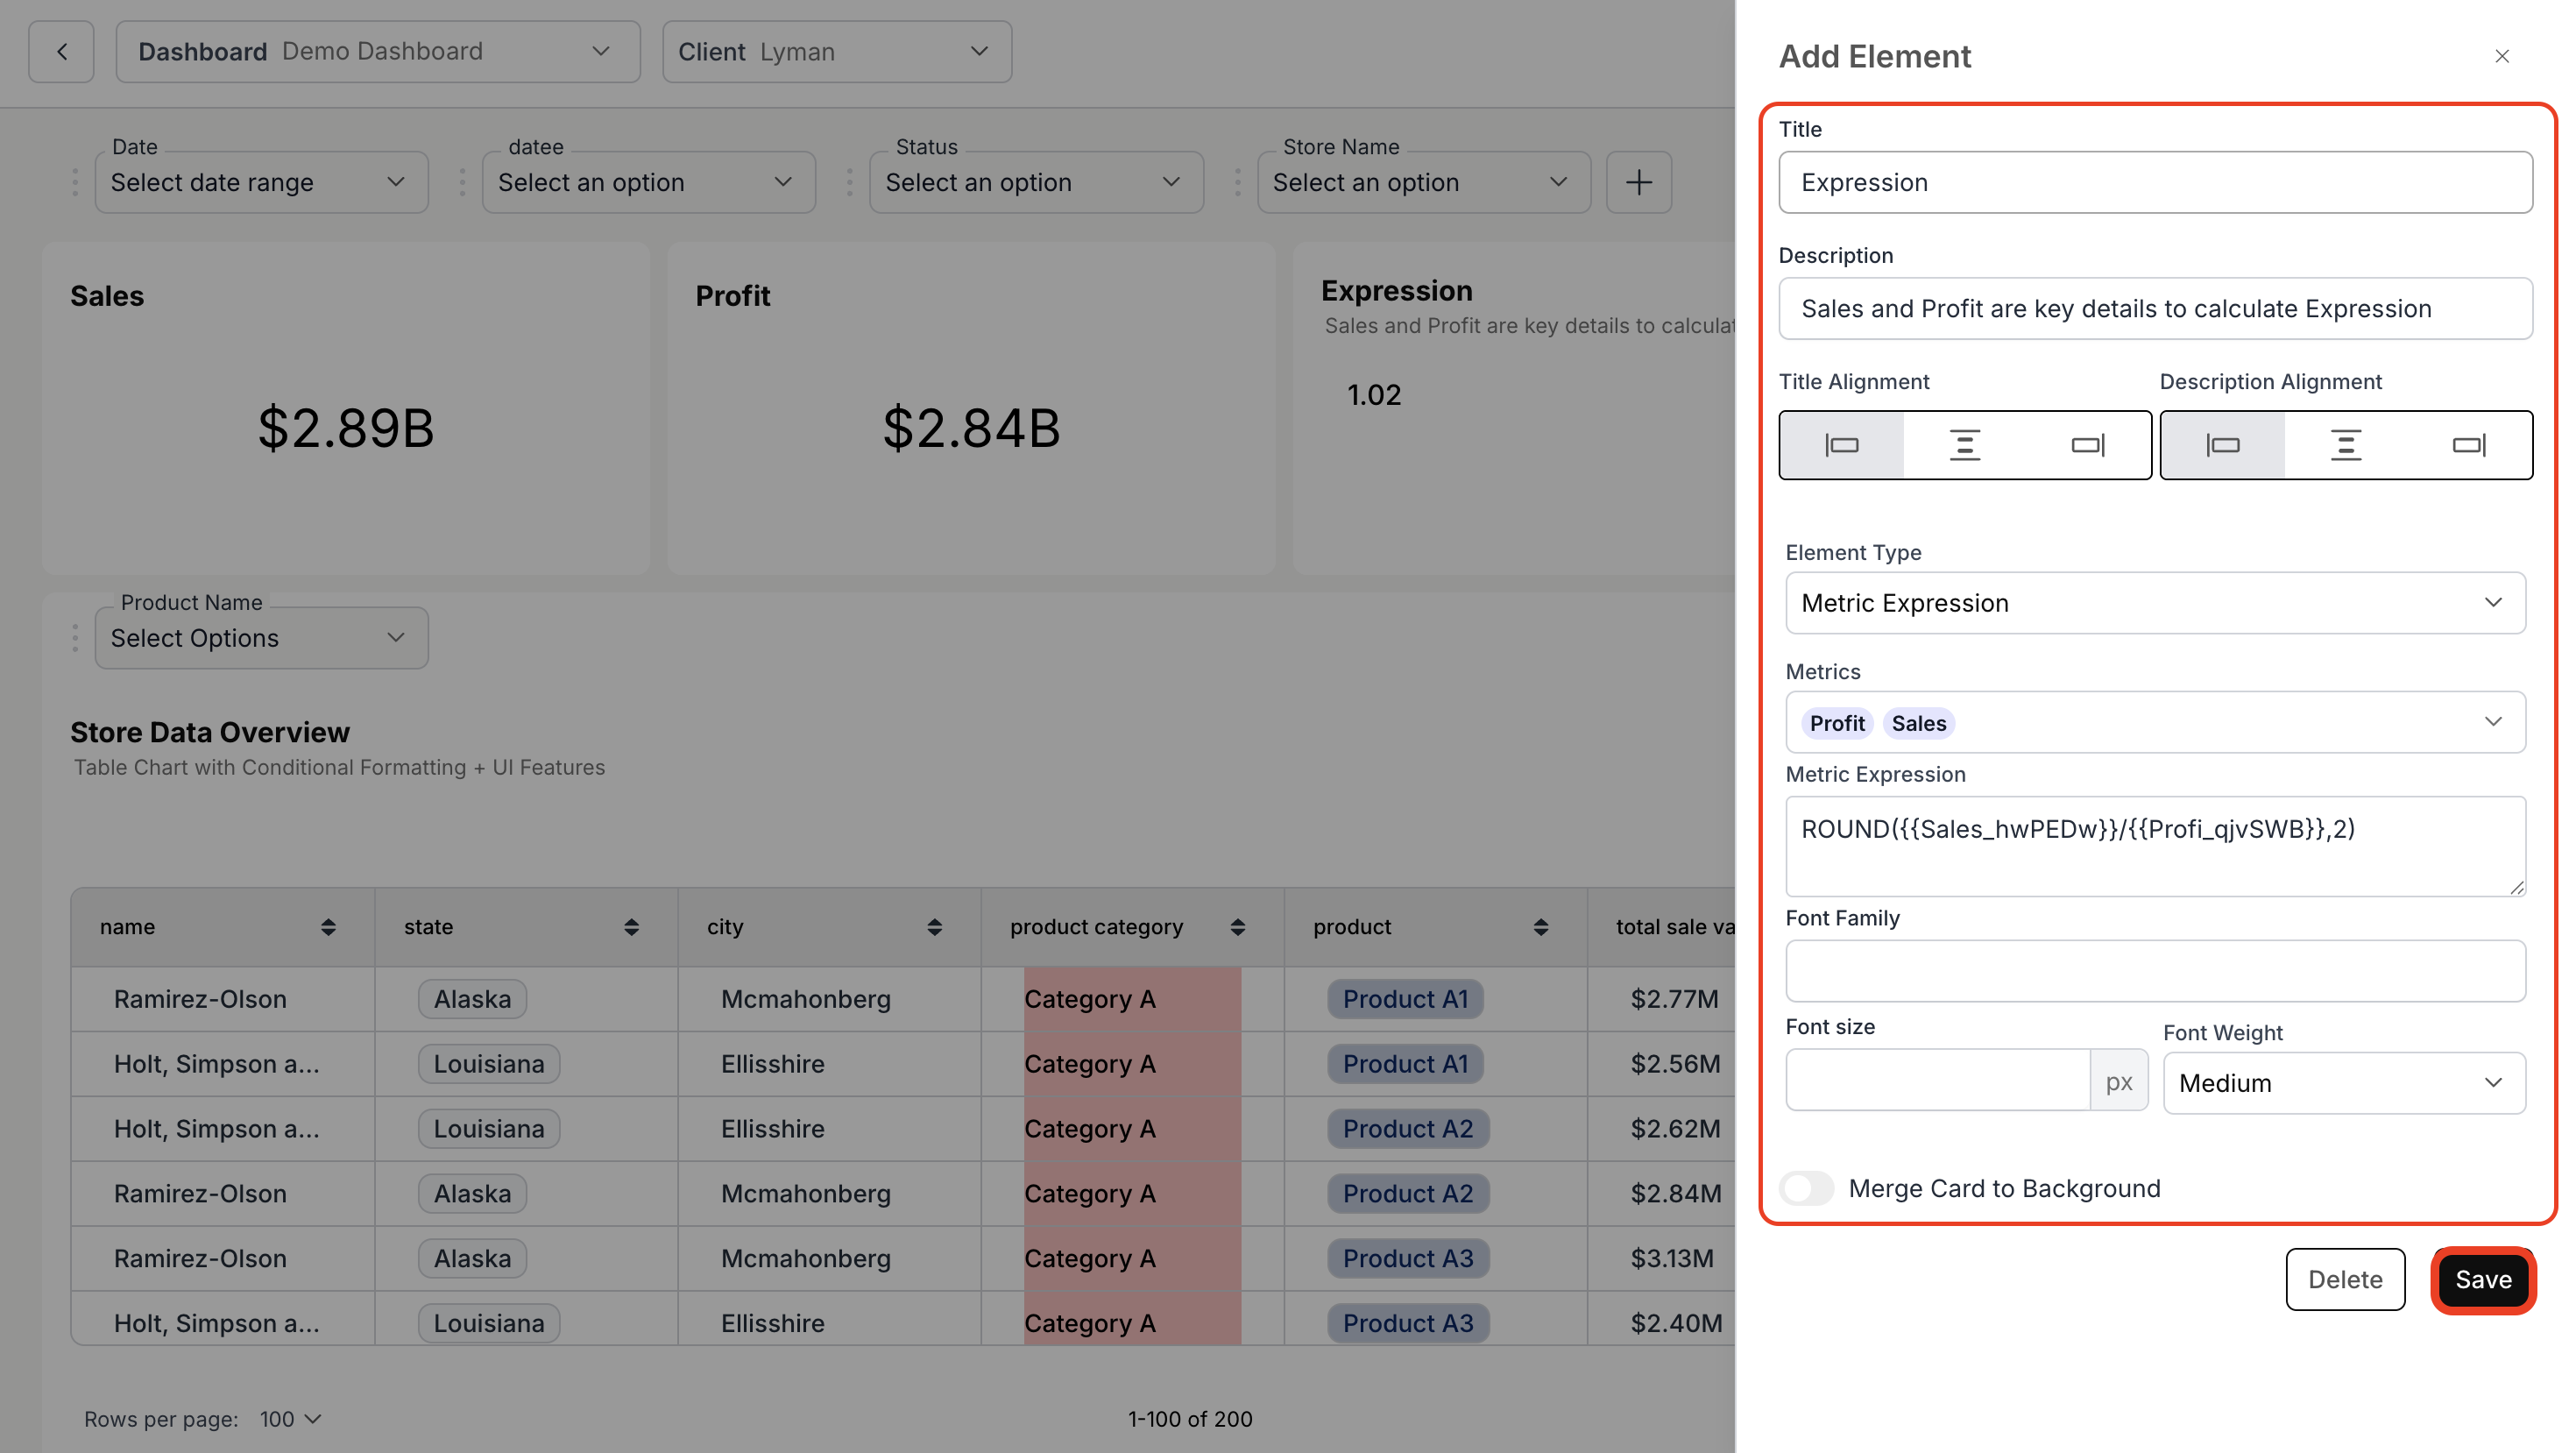
2. Configure Metric Expression
- Enter your suitable title and description for the metric expression.
- Choose the Element Type as “Metric Expression”.
- Select the metrics you want to include in the computation.
- In the “Metric Expression” text box, write the formula to be applied to the chosen single-value cards.
Reference the value of a single-value card using its Metric ID like
{{metricid}} - Customize the appearance of the single-value card using font options such as font family, font size, and font weight.
- (Optional) Enable “Merge Card to Background” if you want to blend the metric into the dashboard background.
- Click “Save” to complete the setup.
3. View the Metric Expression
Once saved, your Metric Expression will be displayed on the dashboard, reflecting the computed value based on the selected metrics.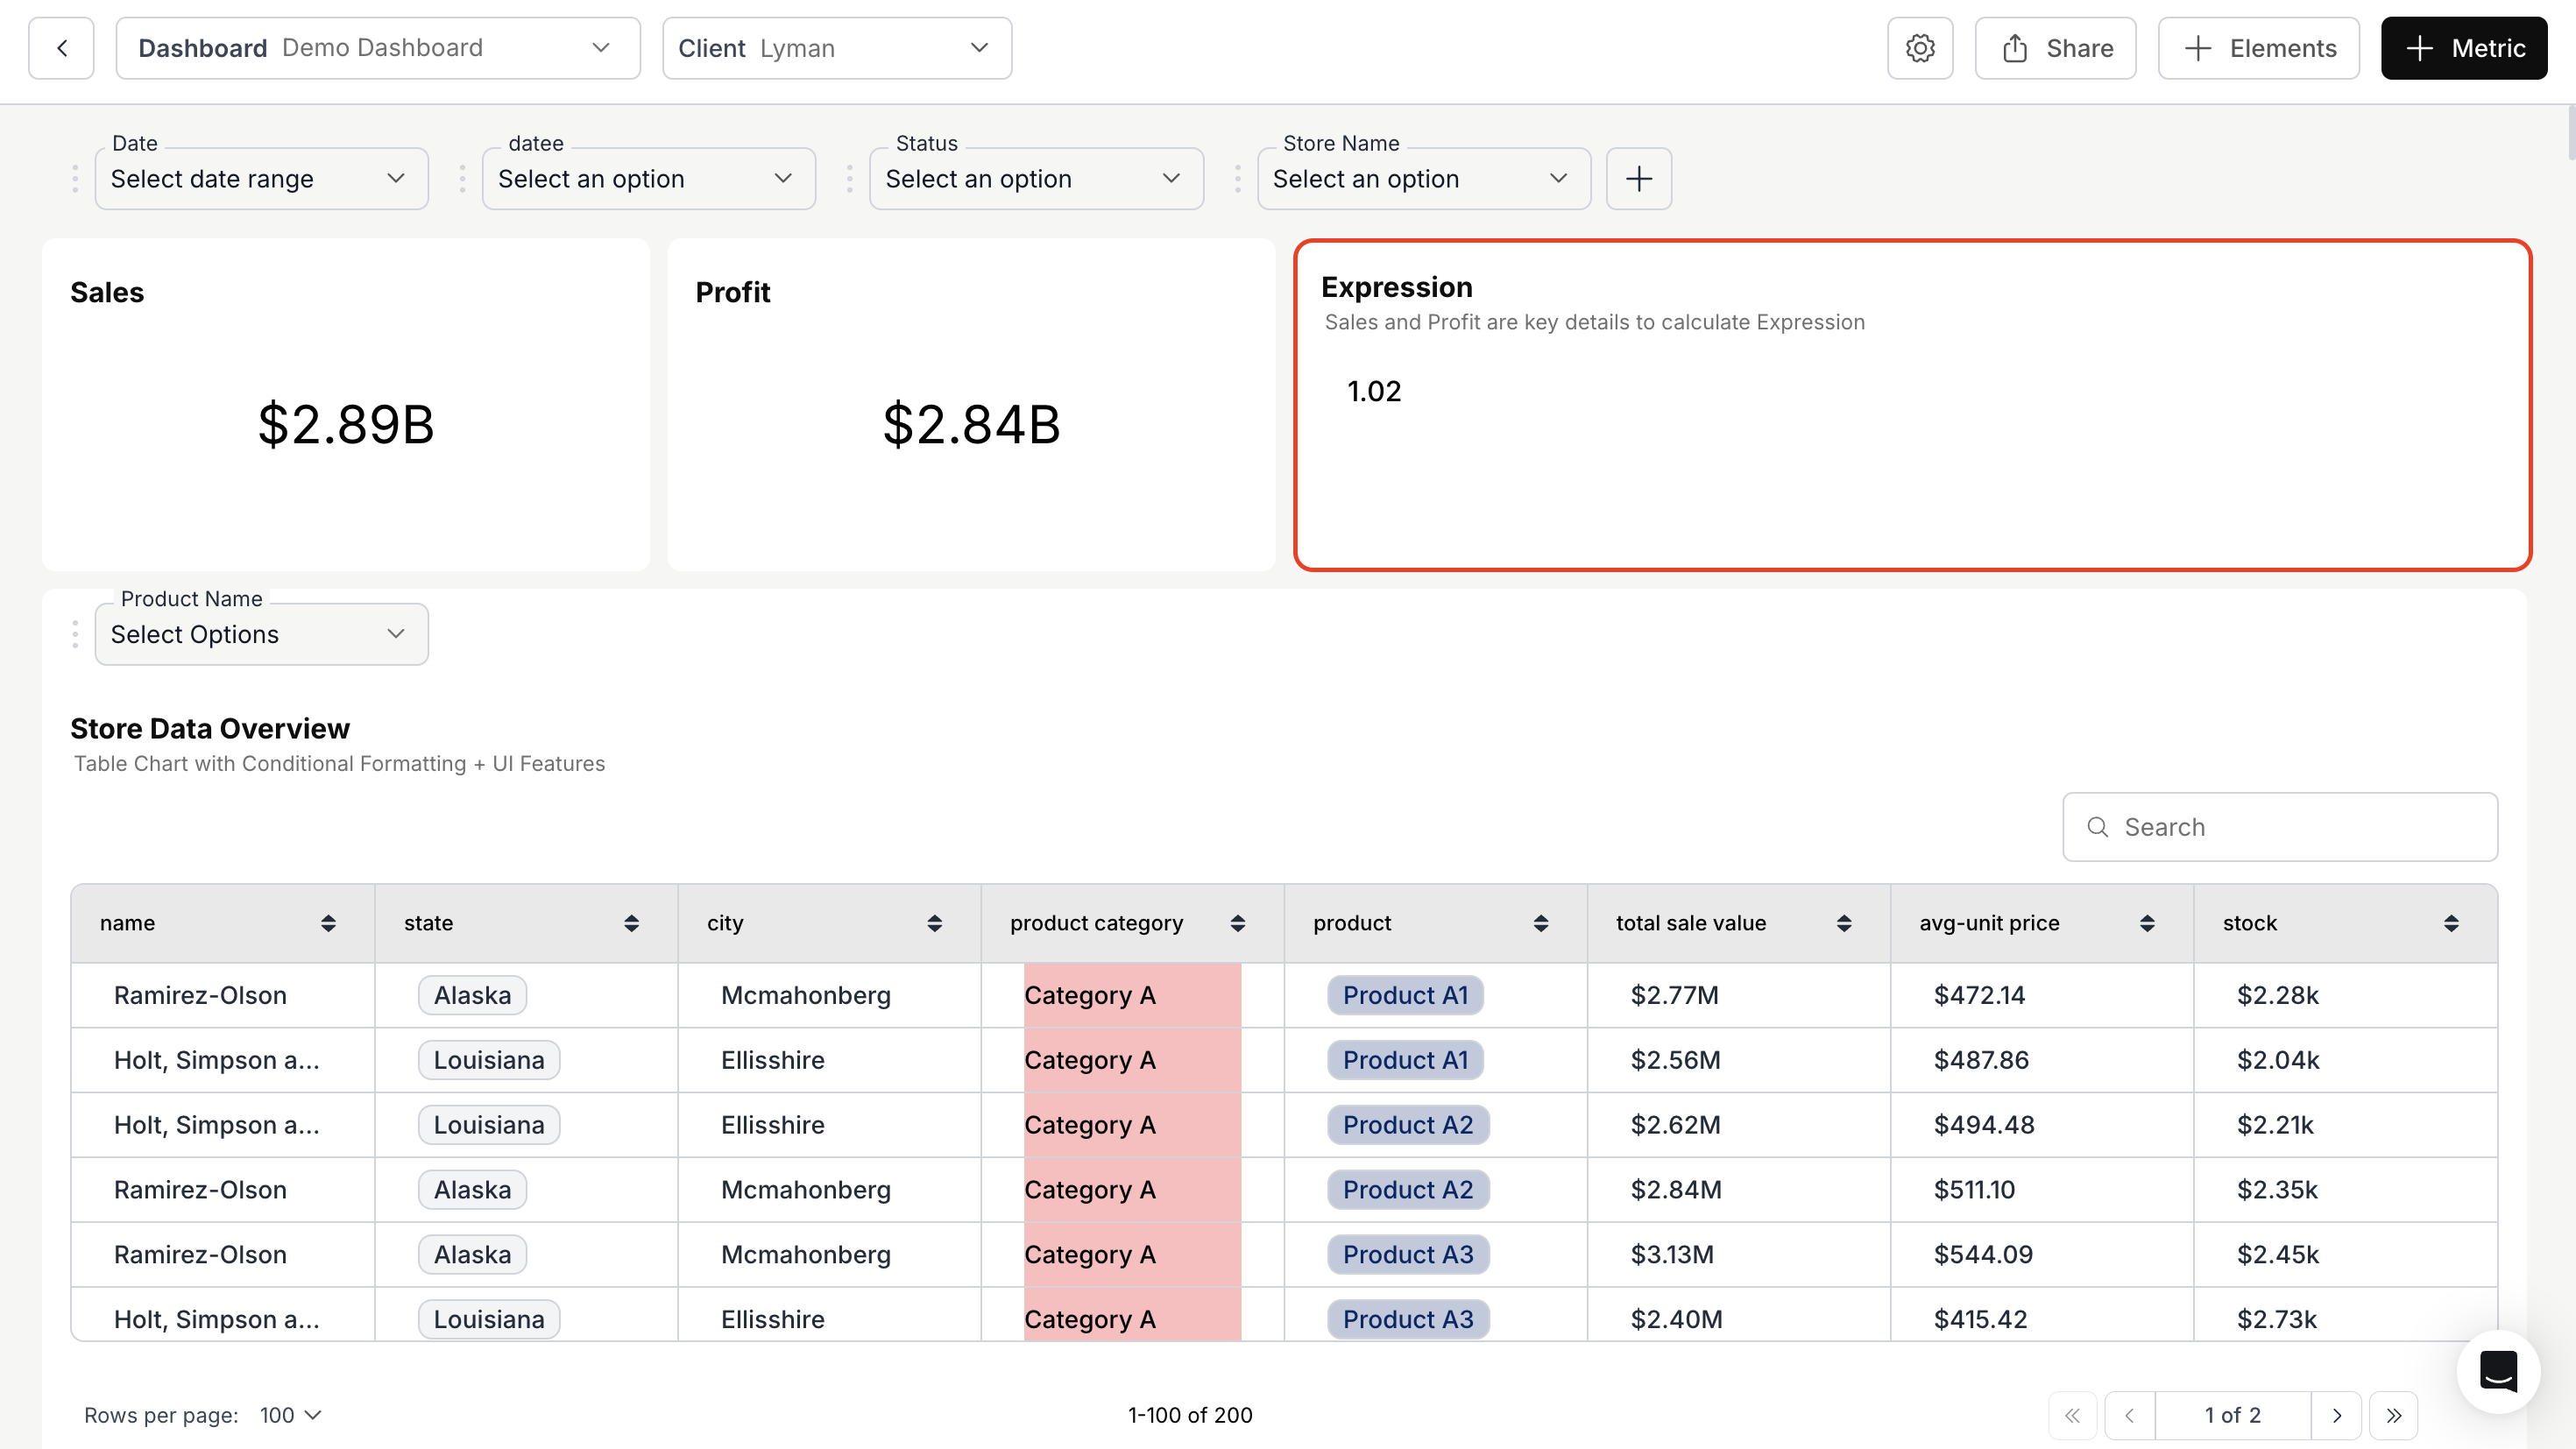
Metric Expression works only for single value cards!
You’ve successfully created a Metric Expression for your dashboard!
Your single-value cards can now perform real-time calculations, enabling smarter comparisons and deeper analytical insights.
Your single-value cards can now perform real-time calculations, enabling smarter comparisons and deeper analytical insights.