1. Adding a Long Description and Footnote:
- On the metric creation page, click the “Save to Dashboard” button in the top right corner.
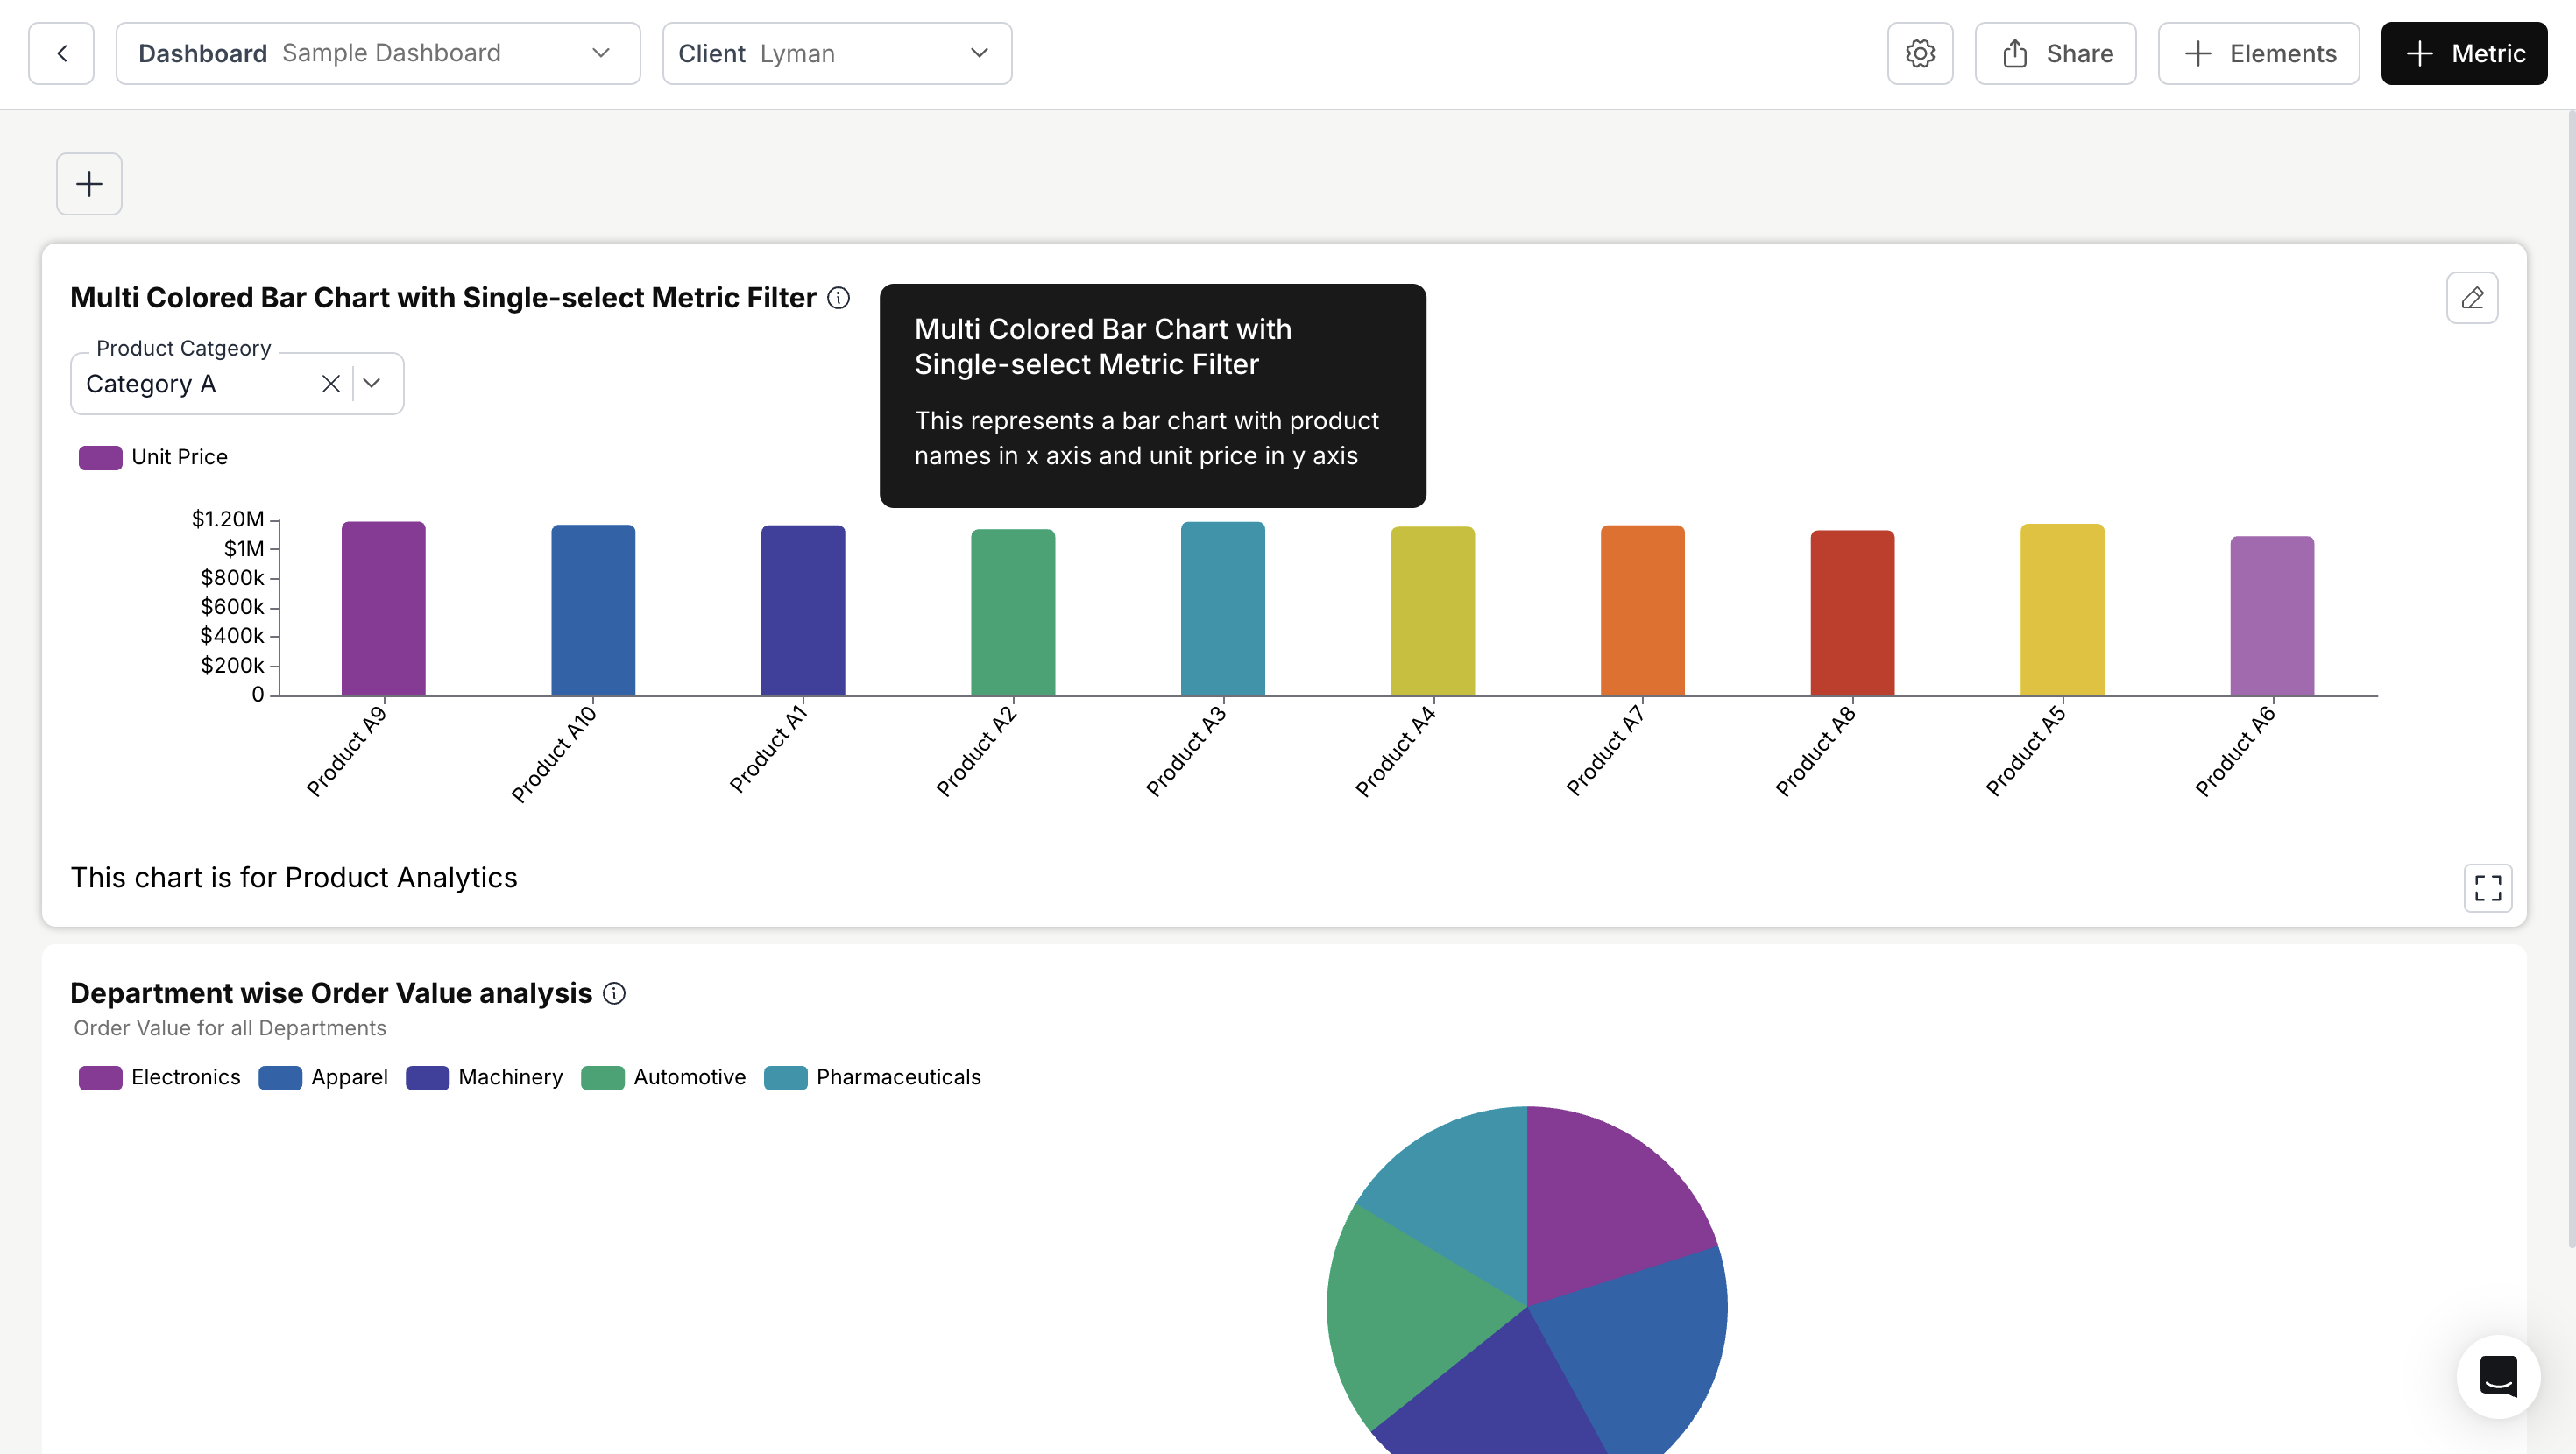
- In the Long Description field, enter a detailed description of the metric or add a link to redirect users to the required information.
- In the Footnote field, add any additional contextual information, links to redirect to the same existing page or a new page, or formatting options such as bold and italics for better customization.
- Click “Save” to save the metric to your dashboard.
Adding text to footnote and long description:
Adding links to footnote and long description:
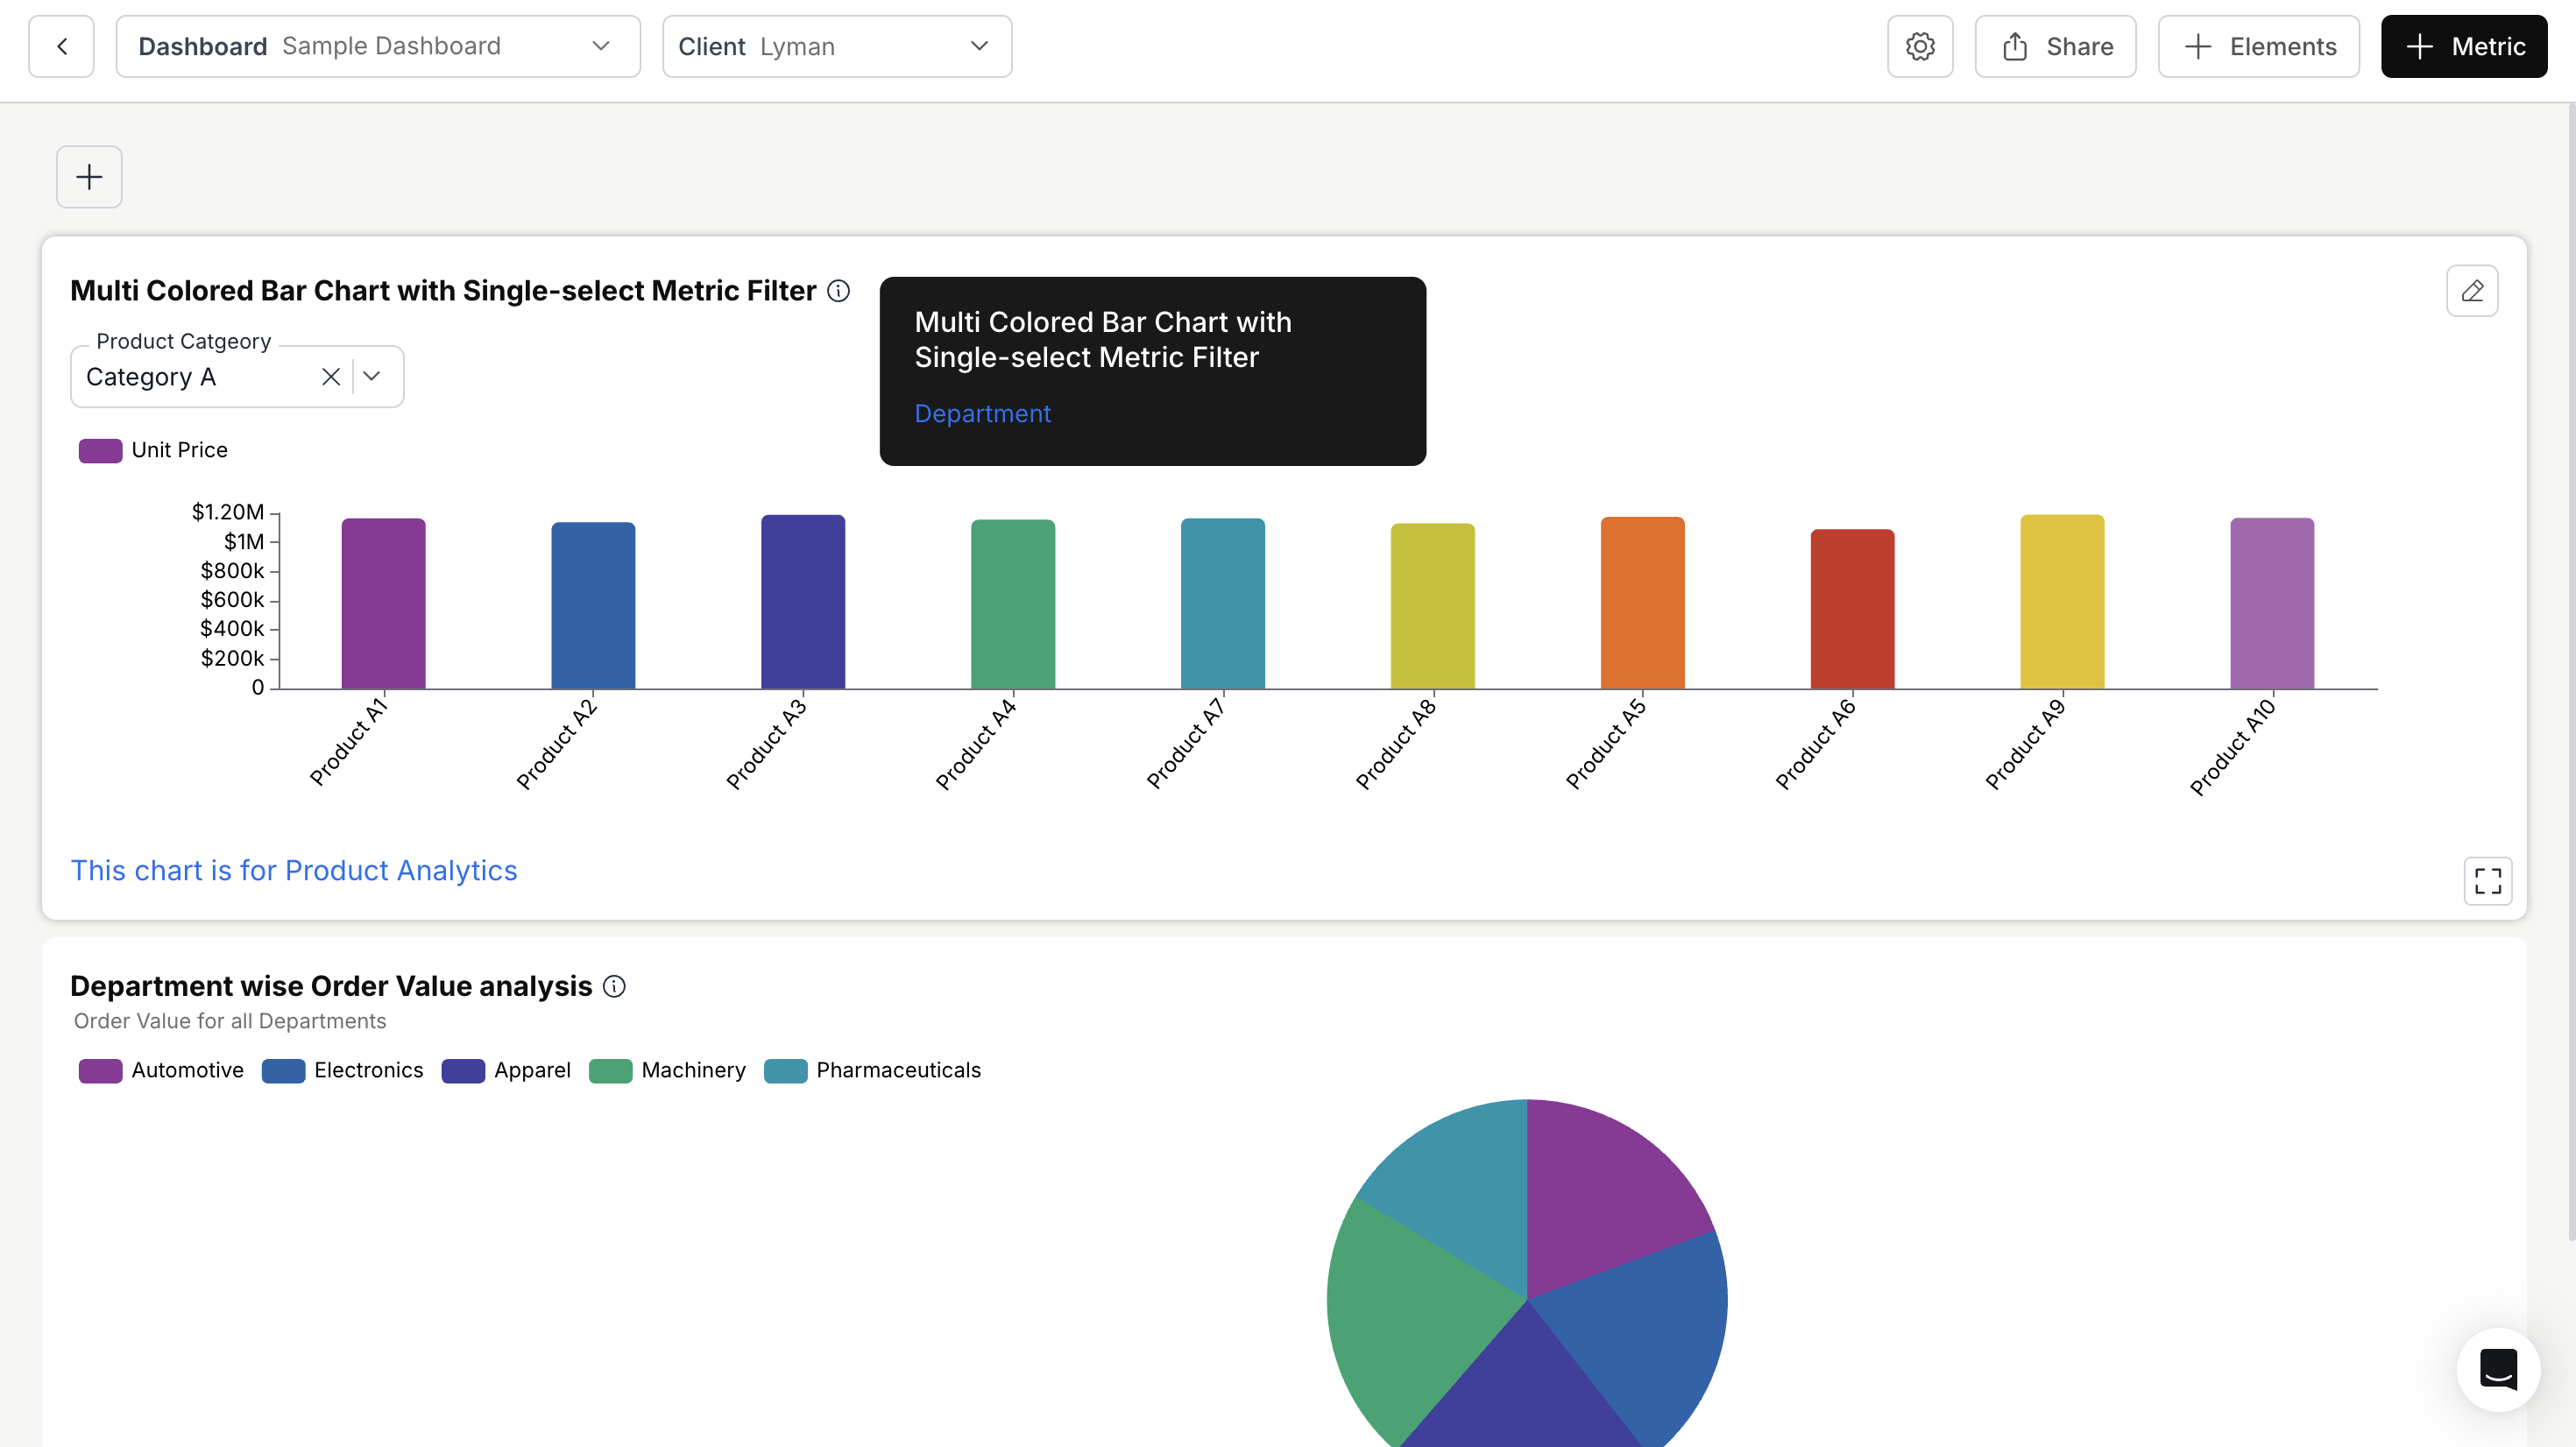
You can include clickable links in the Long Description and Footnote fields to provide quick access to external pages.
2. Viewing the Changes:
- The long description will appear when hovering over the information icon next to the metric name.
- The footnote will display directly below the metric on your dashboard.
You’ve successfully added and customized footnotes and long descriptions for your metric!
Your dashboard cards now provide richer context, clearer explanations, and easy access to supporting information.
Your dashboard cards now provide richer context, clearer explanations, and easy access to supporting information.