1
Open API Token Settings
Go to the Databrain app settings and then click on the API Token tab.
2
Locate your API Key
Find the API Key which has permission to access metrics and dashboards.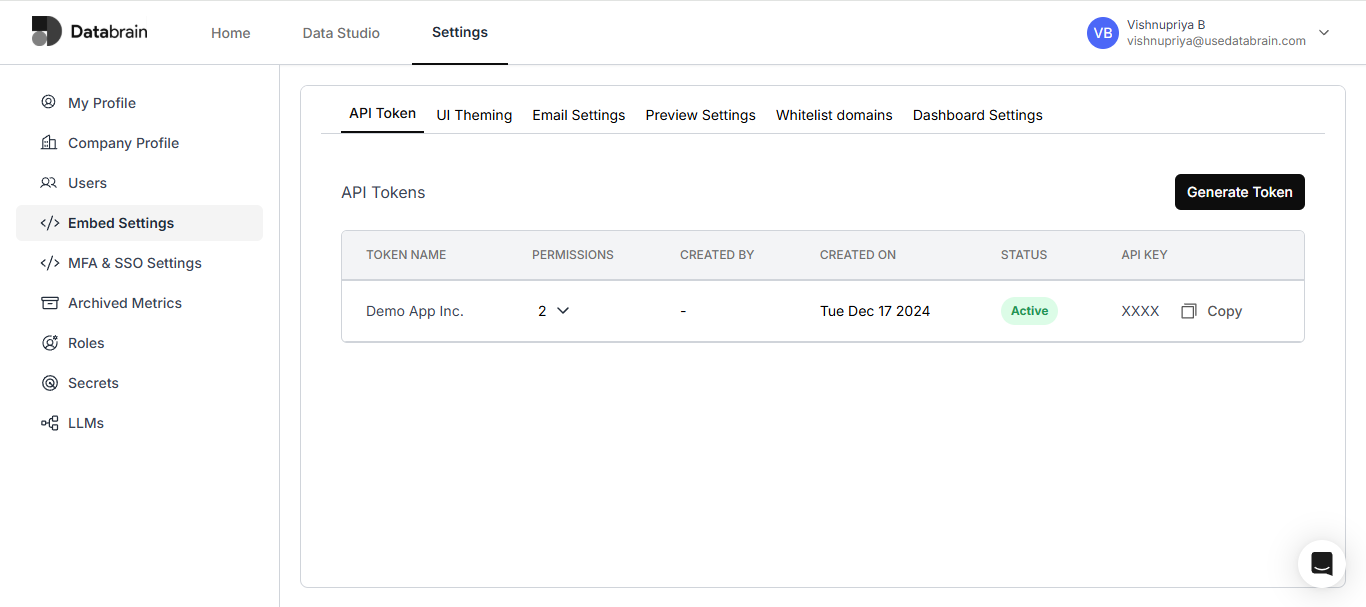
3
Send POST request from Postman
Open your Postman App and send a POST request to the URL -
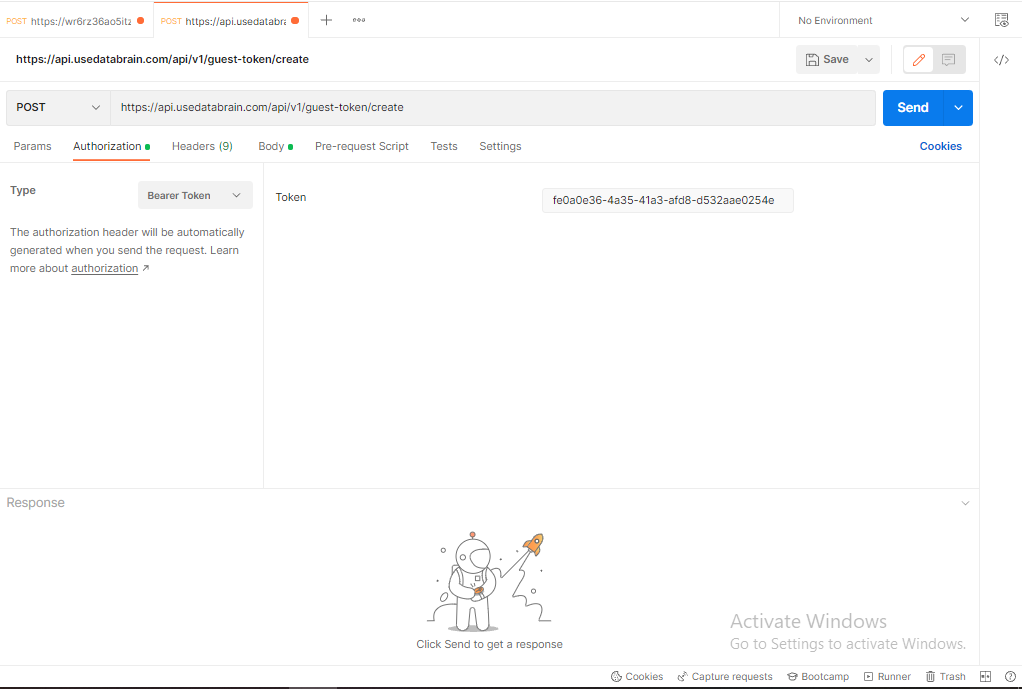
https://api.usedatabrain.com/api/v2/guest-token/create4
Set Bearer Token
Click on the Authorization tab, select type as Bearer Token, and paste the API Key copied from the Databrain App’s API Token tab.
5
Set raw JSON body in Postman
In the Body tab of Postman, choose raw and JSON.
You’ll need a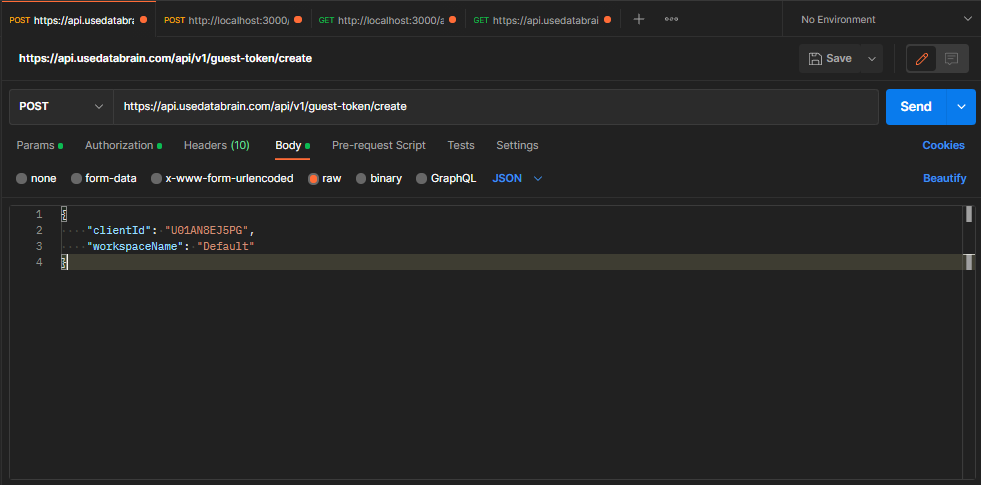
You’ll need a
clientId which should come from your user’s session—since this API will be called from your app ideally.6
Advanced JSON body with RLS (Row Level Security)
The minimum required JSON structure is:If you want to add some Row Level of Security settings then in params you can also add another key “rlsSettings” It is an array of objects which has “metricId” - the id of the metric you want to have rls settings enabled for along with the key “values” which is an object of rls condition name and its value pair filter for the particular metric.Now our new json body structure would be -If you use SQL query to generate the metric data and want to add metric filters but don’t want end users to use them then you can add appFilters.Please refer to this article to know more about app filters.To add app filters it’s the same process as rls settings. Here you have to add another key “appFilters” and then you can specify the value same as rls settings.
App filter
Learn how to use app-level filters to restrict data visibility at runtime.
7
Send the Request and Retrieve the Token
Click on the Send button in Postman. In the response, you will receive the generated token.
Copy this token and use it within your Databrain plugin configuration.
Copy this token and use it within your Databrain plugin configuration.