
Query Execution
In the Query Editor, enter your custom SQL query.Use the “Format Query with AI” option to align with Databrain’s best practices.Click “Run Query” to execute.
Preview the Results
Once the query runs, review the Query Result section to view your raw SQL output in a table.You can download the results as CSV if needed.
Save your Query Result
Click Use Results > to proceed. You can save it in the following ways:
1. Table ChartClick “Use as Table Chart”, configure additional settings, and save it to your dashboard.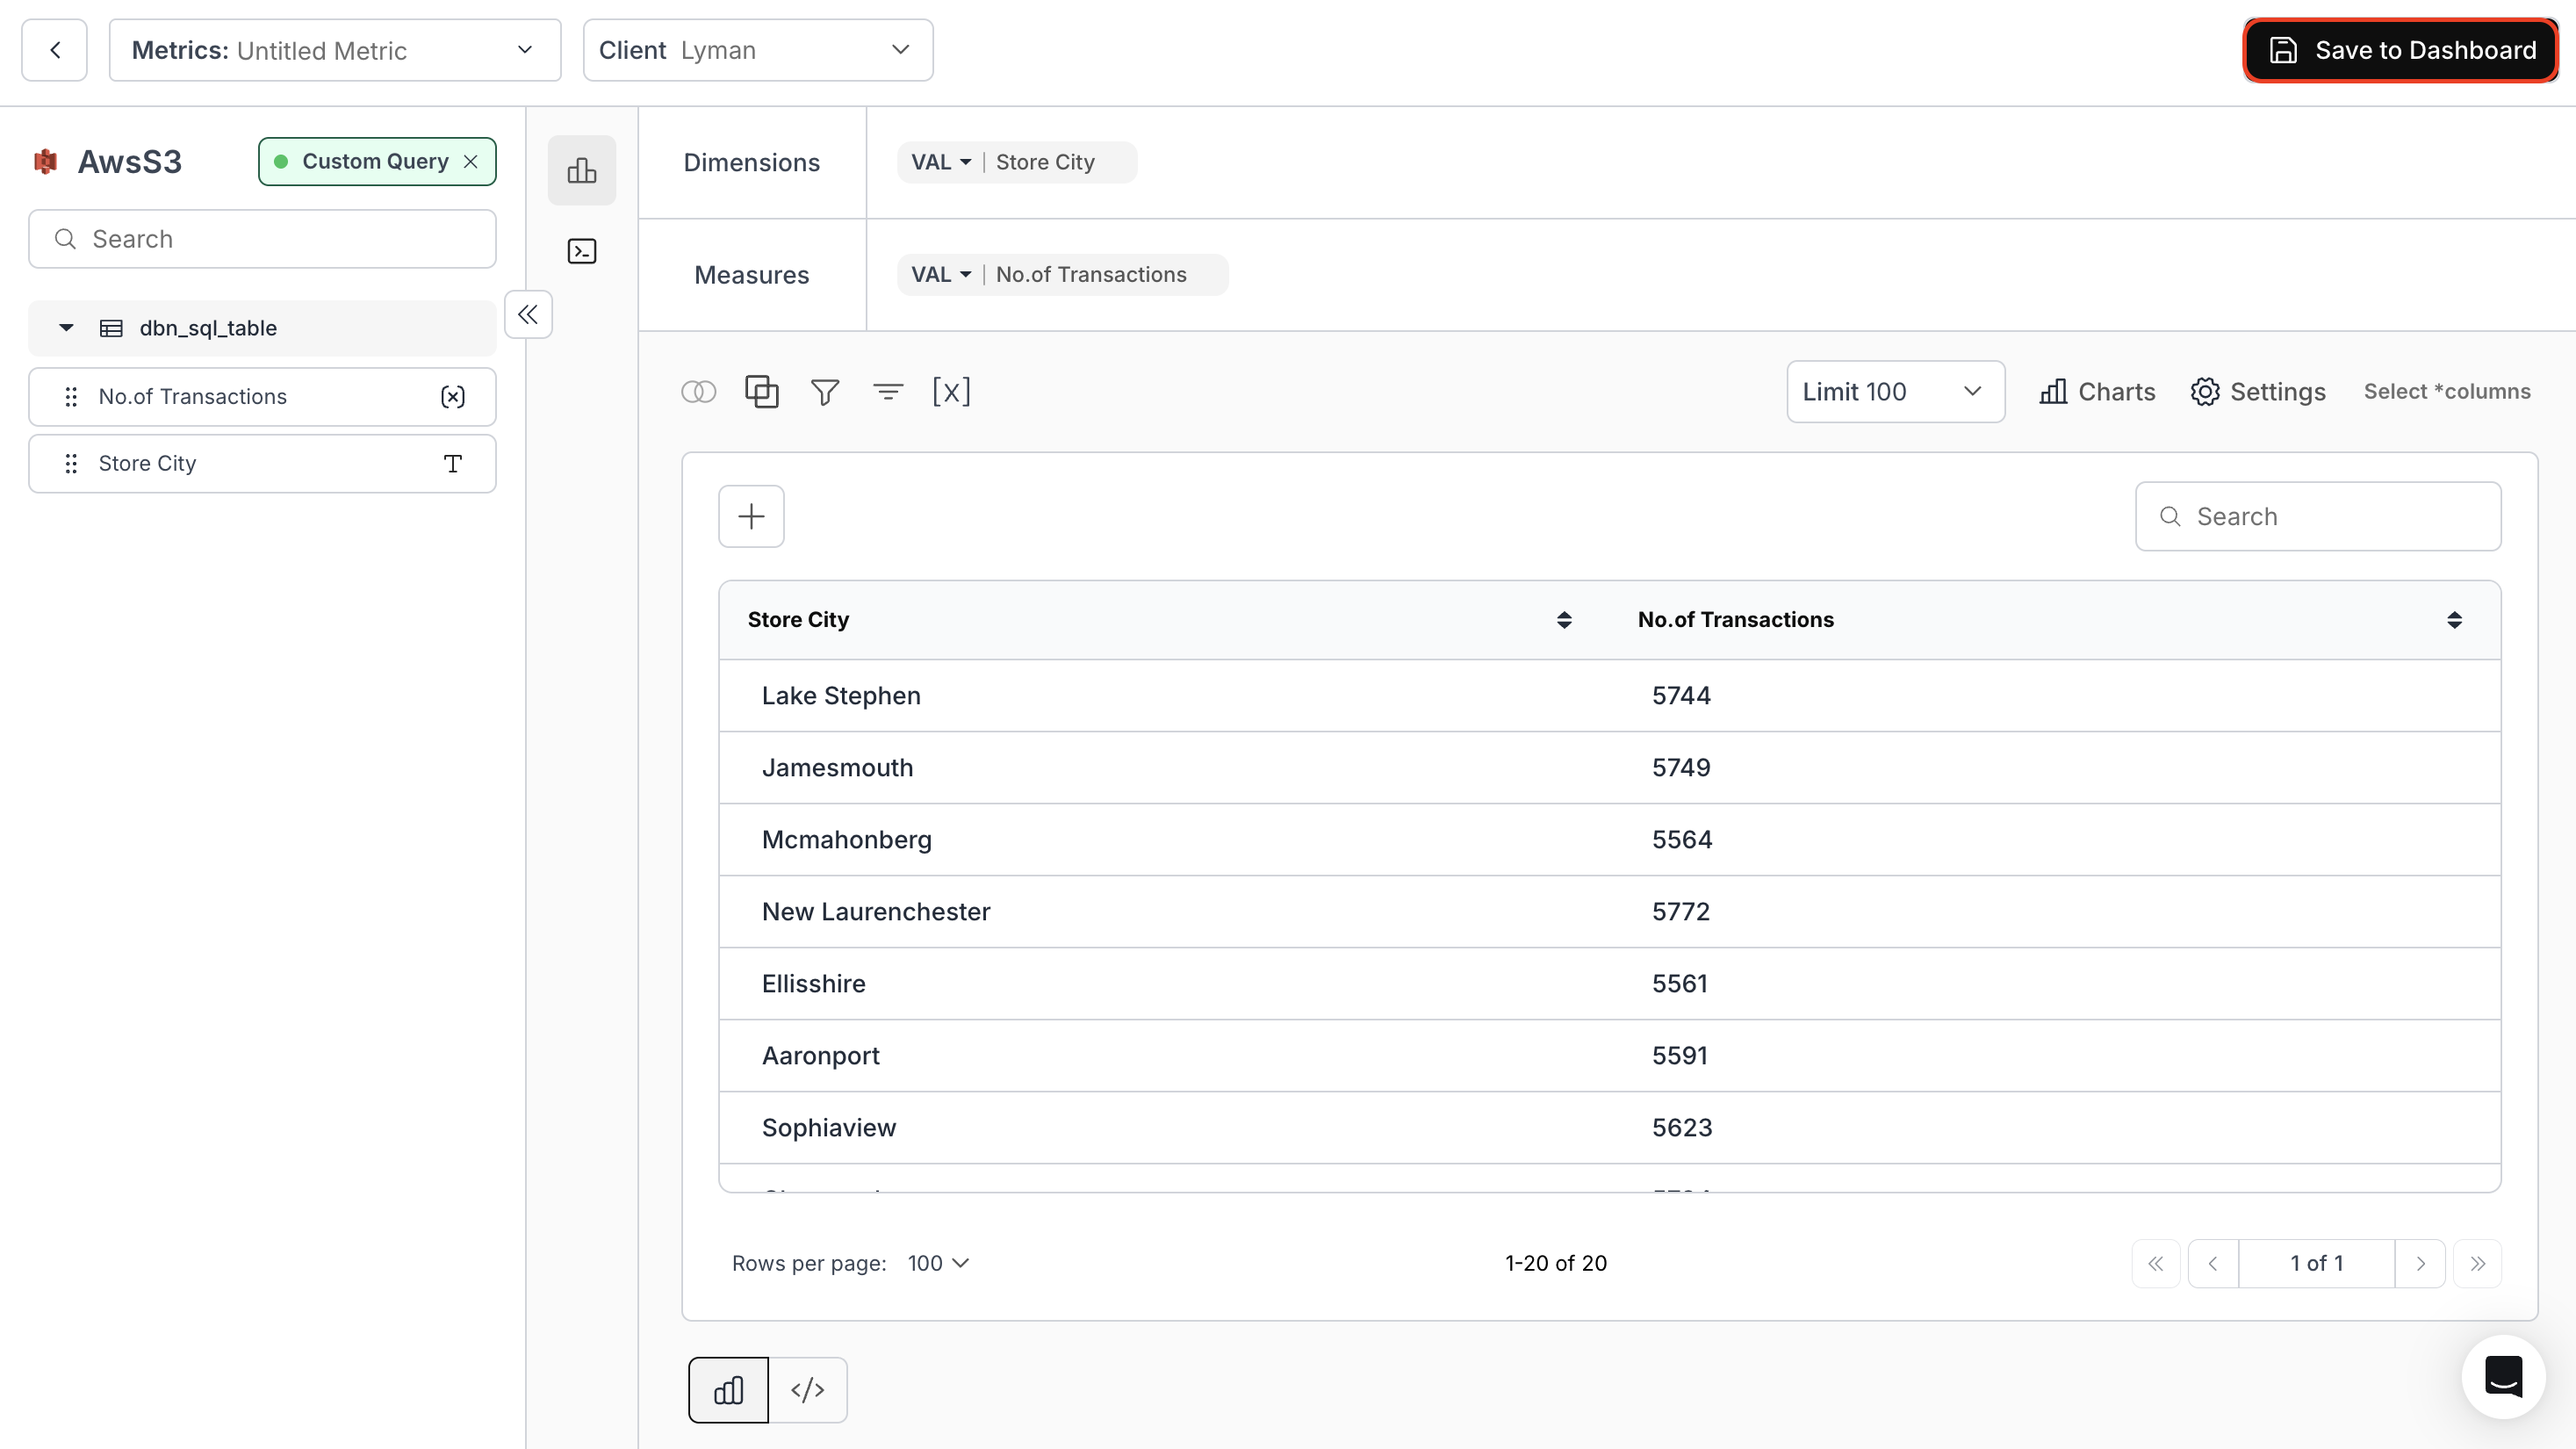
2. Table Chart with Dynamic Table PropertyThis automatically adjusts to the latest structure of your SQL query result — ideal for evolving datasets using
3. Publish as Custom DatasetProvide a dataset name, choose a schema, and click Save.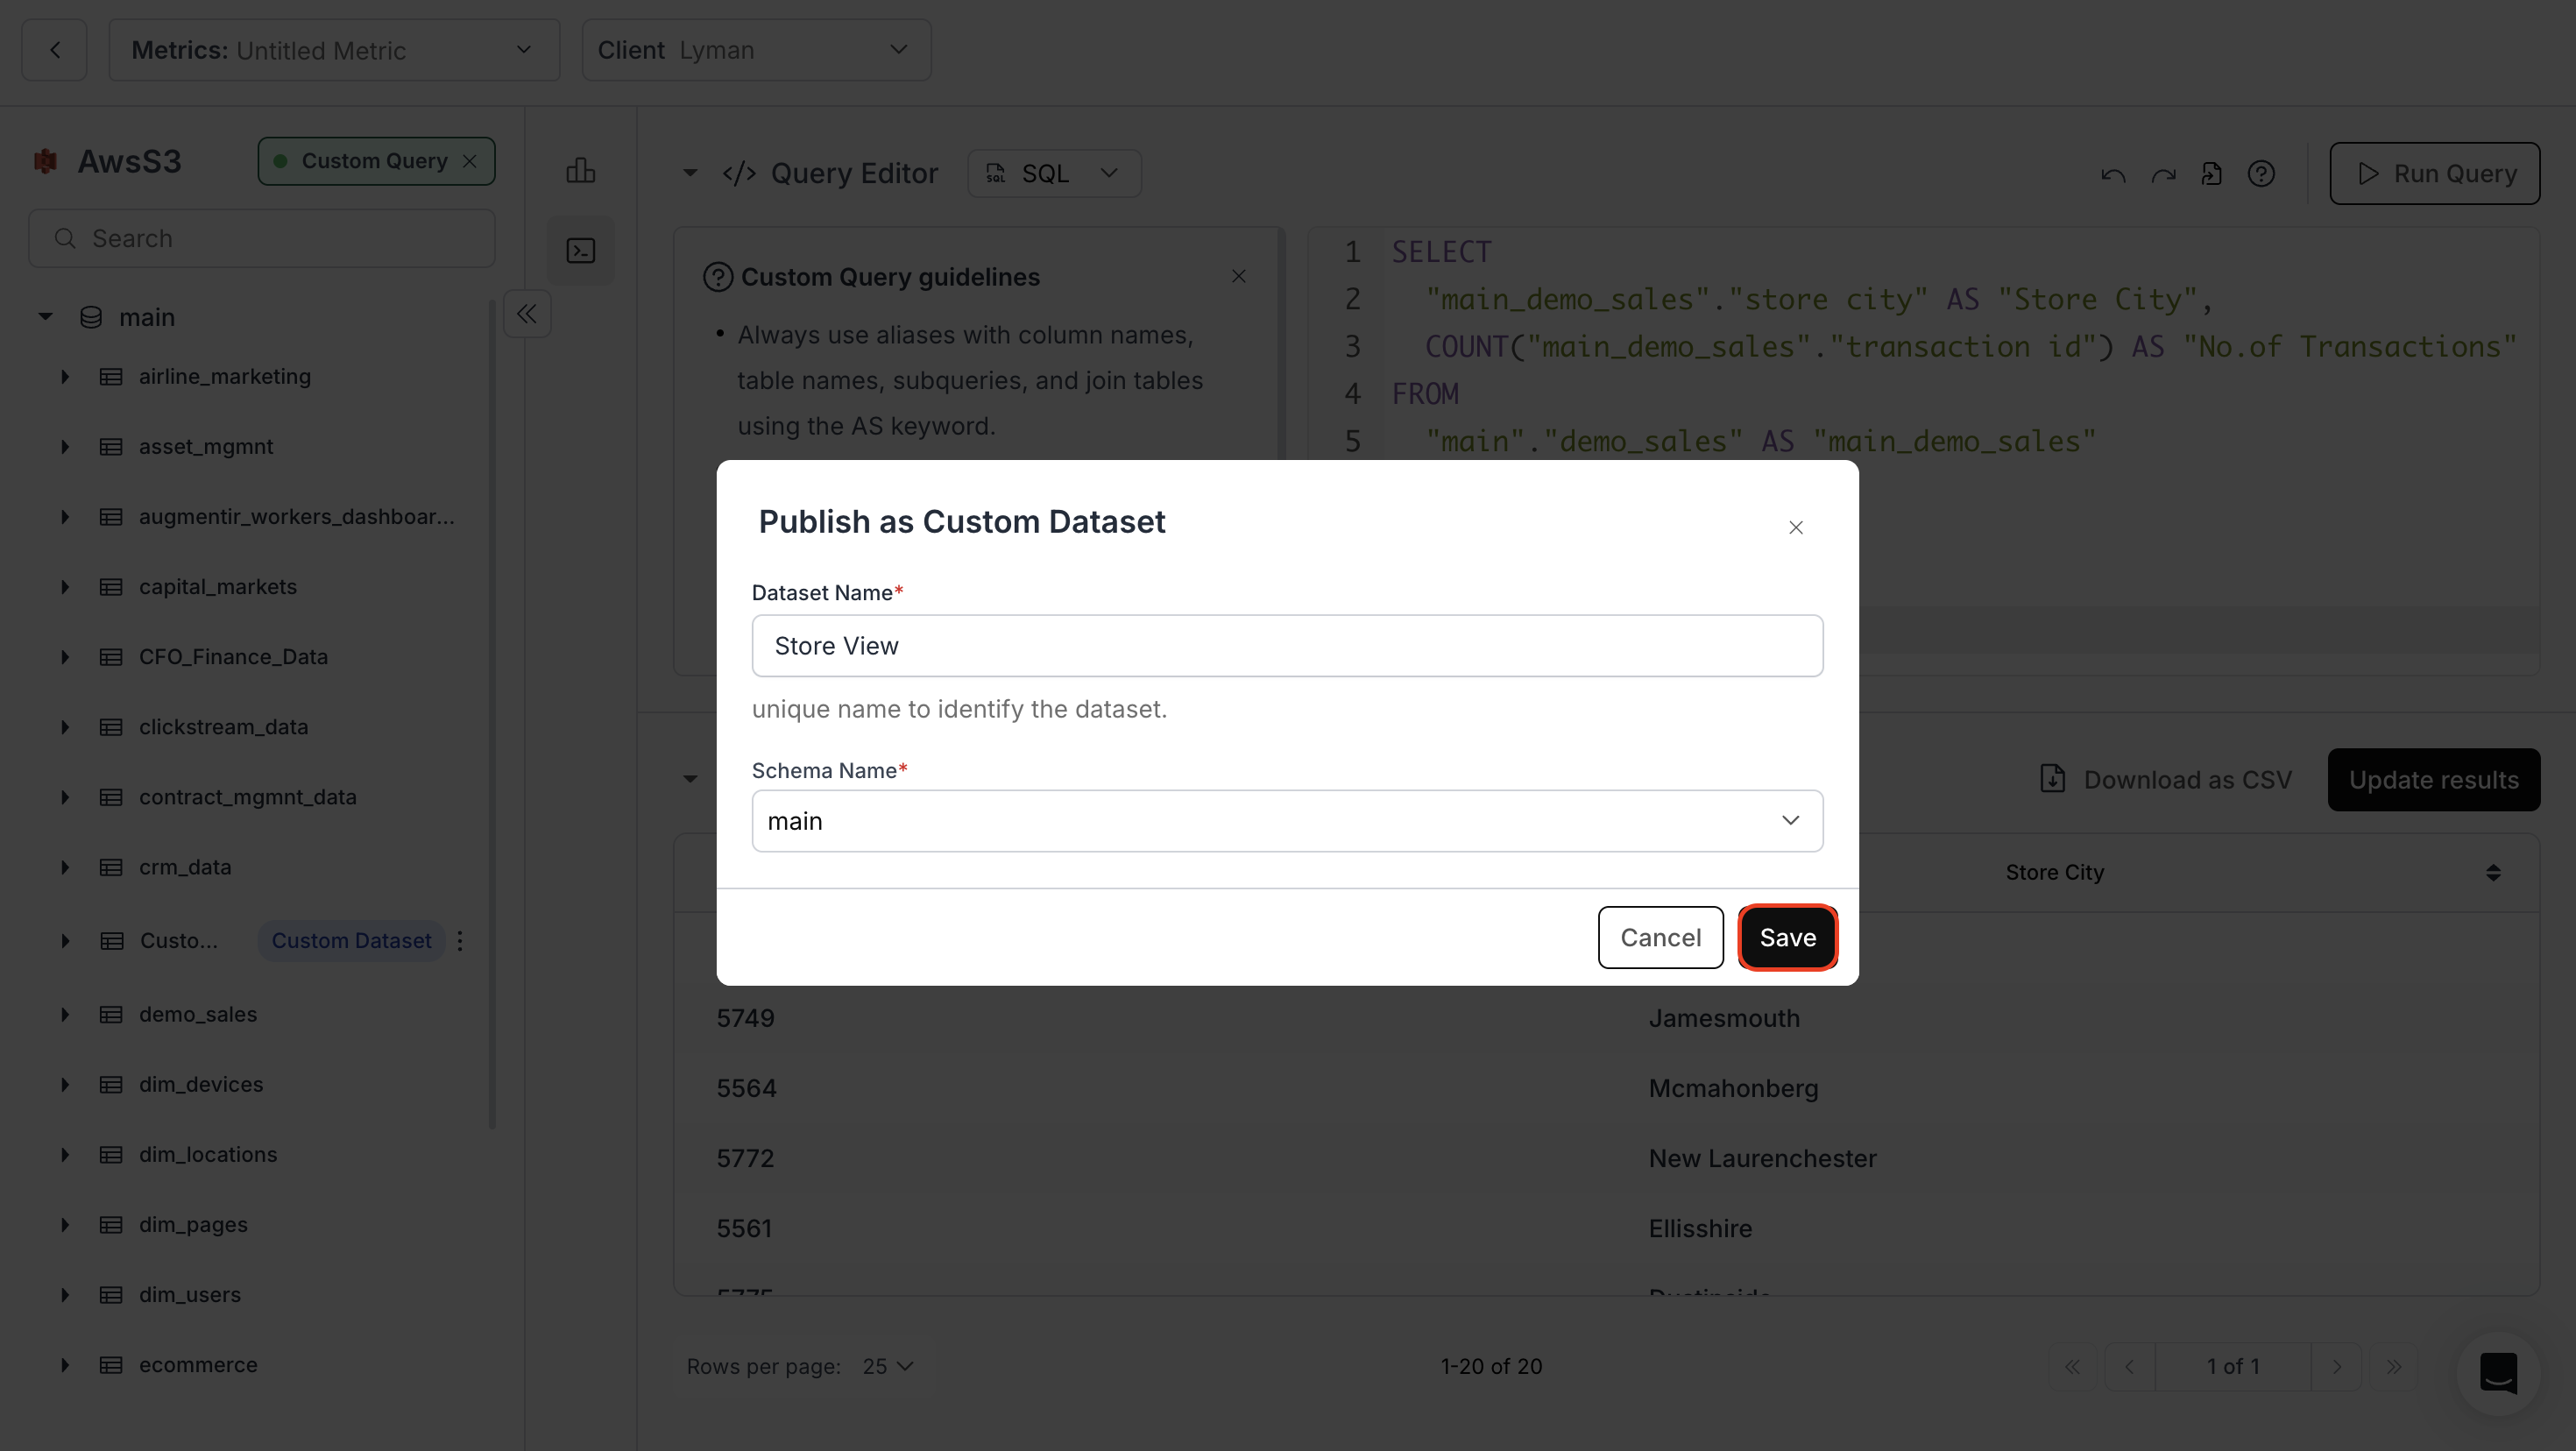
4. New ChartSelect your preferred chart type, configure it, and save.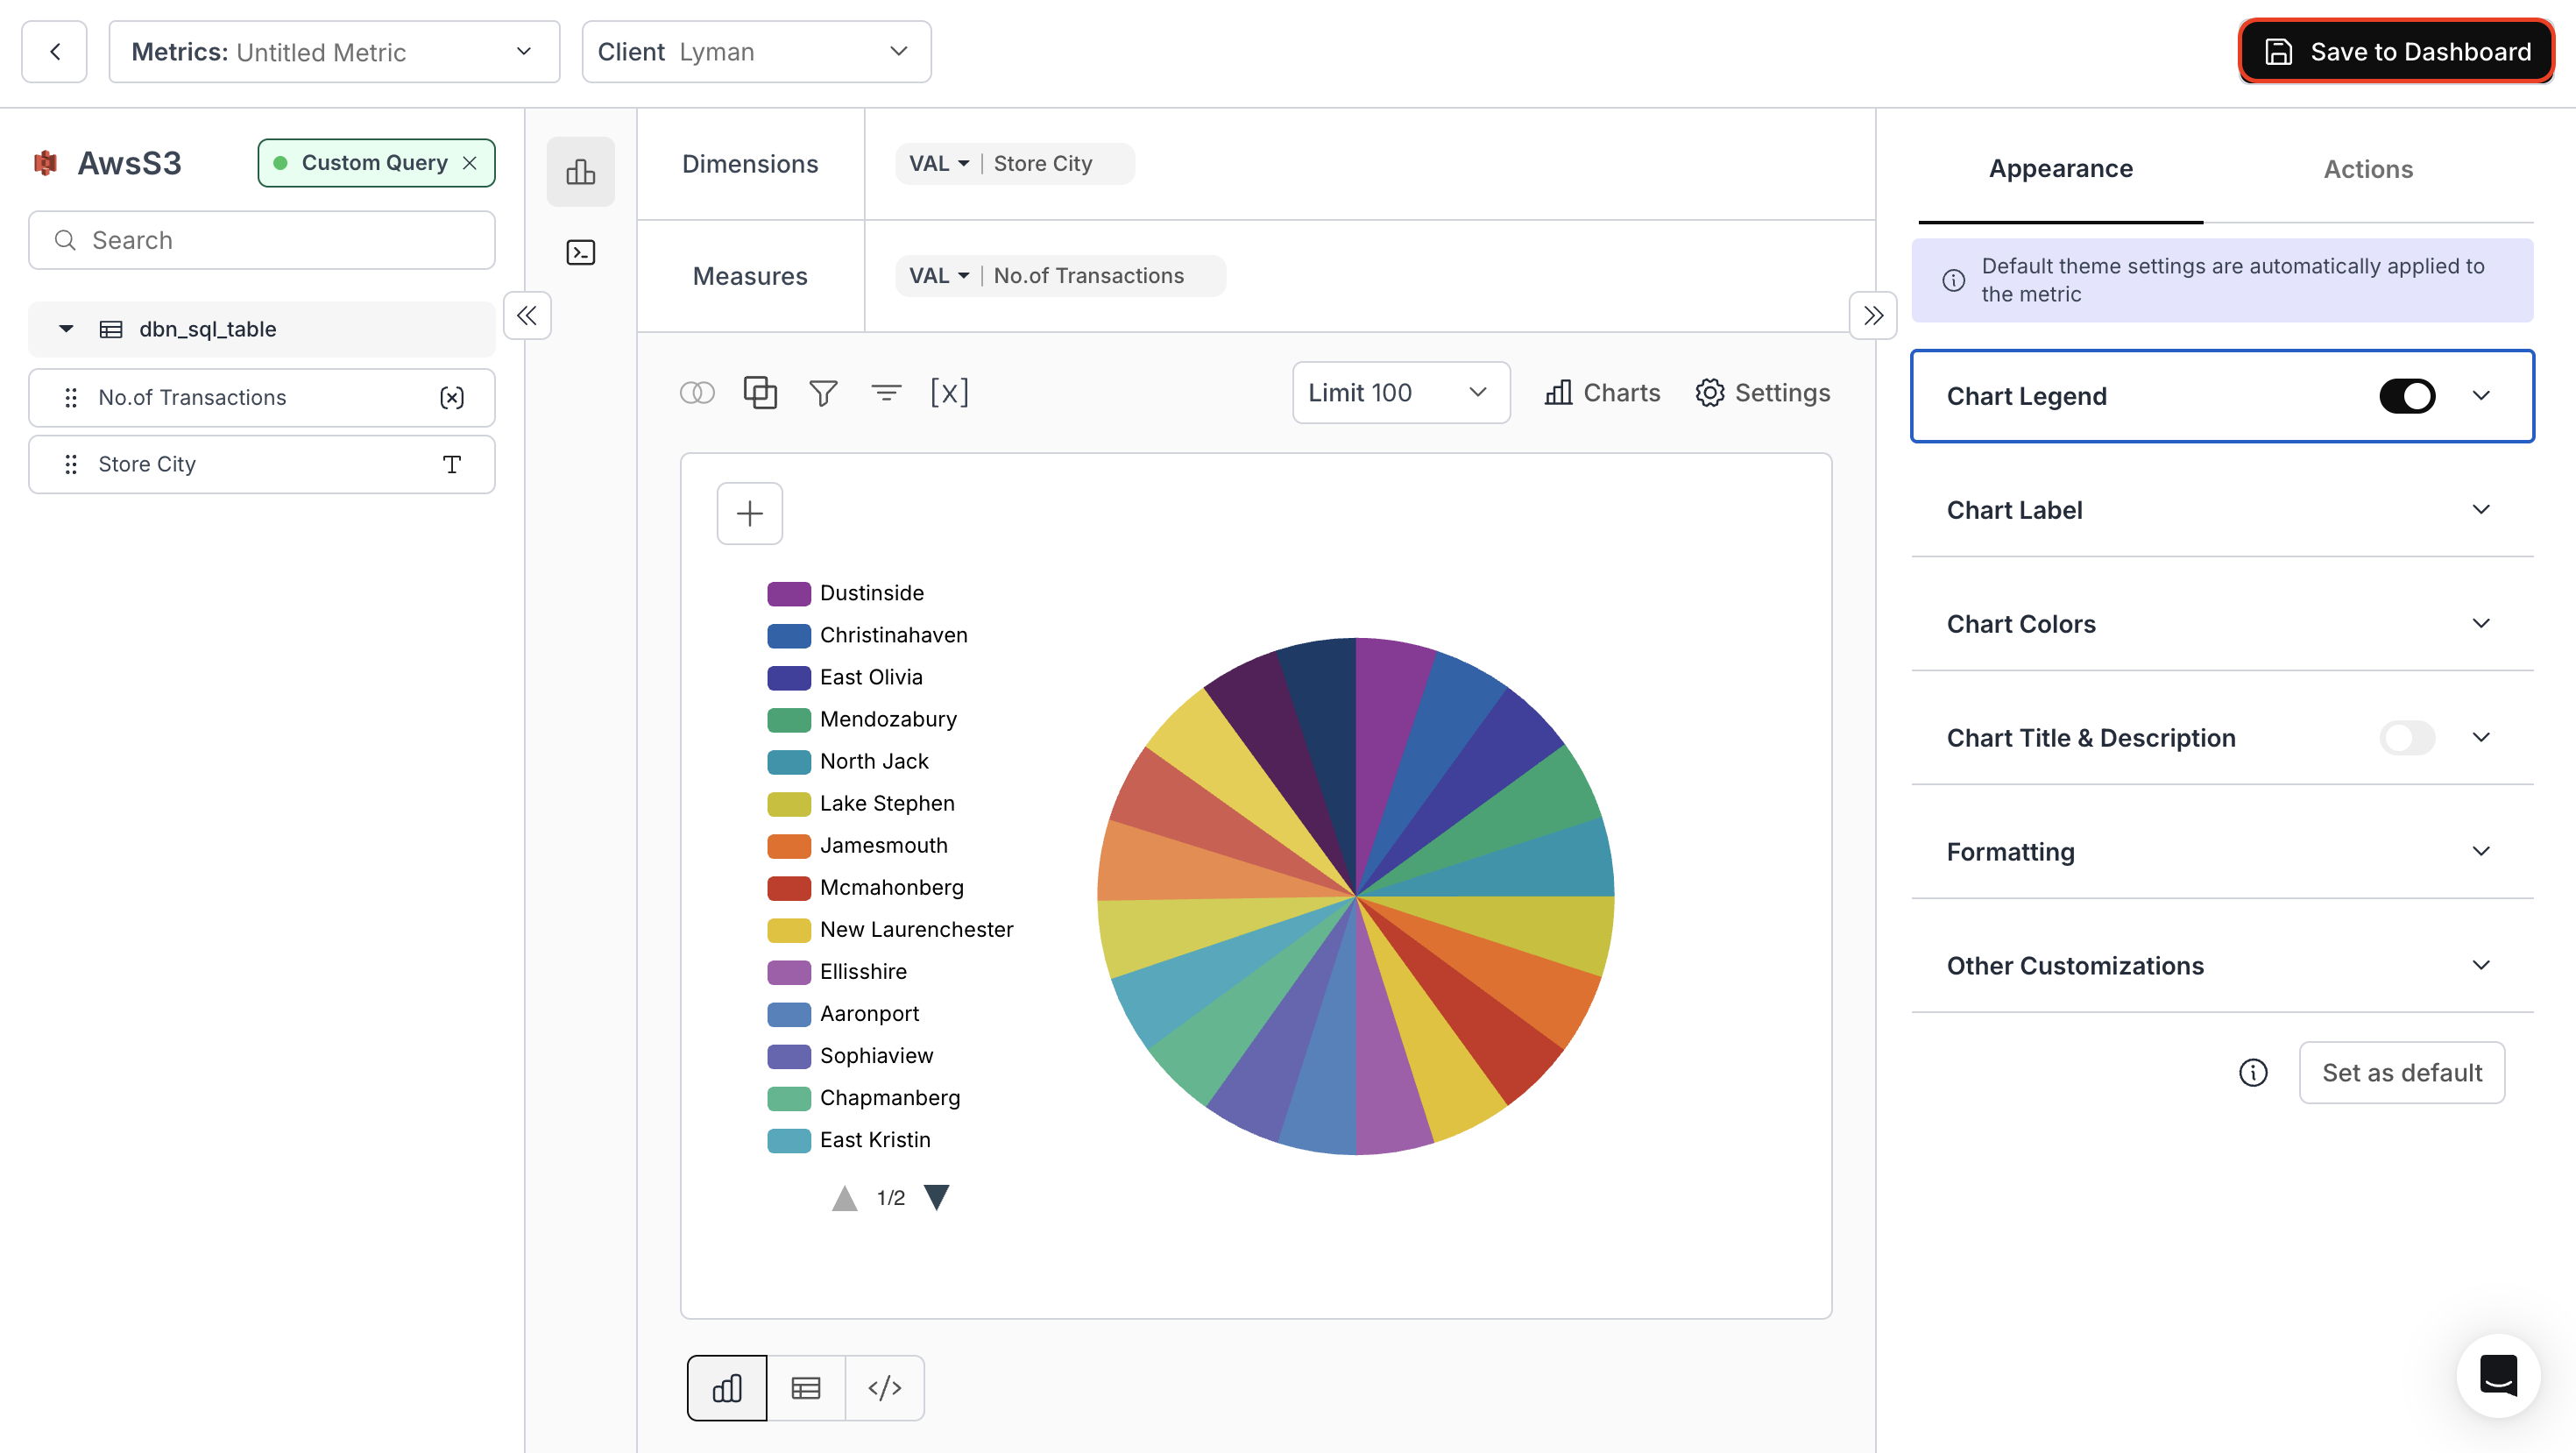
1. Table ChartClick “Use as Table Chart”, configure additional settings, and save it to your dashboard.
2. Table Chart with Dynamic Table PropertyThis automatically adjusts to the latest structure of your SQL query result — ideal for evolving datasets using
SELECT *.3. Publish as Custom DatasetProvide a dataset name, choose a schema, and click Save.
4. New ChartSelect your preferred chart type, configure it, and save.
You’ve successfully created a metric using Custom SQL in Databrain!
Your query-driven metric is now active, giving you full control over data transformation, advanced logic, and custom visualizations directly from your SQL output.
Your query-driven metric is now active, giving you full control over data transformation, advanced logic, and custom visualizations directly from your SQL output.