What is Cross Dashboard Drill Down?
Regular drill-down only affects the single metric you click on. Cross Dashboard Drill Down takes it further — when you click a data point, the selected dimension value is applied as a filter across all other metrics on the same dashboard. For example, if you click “West” on a revenue-by-region bar chart, every other metric on the dashboard (customer count, order trends, product breakdown) automatically filters to show only data for the “West” region. This is useful for:- Multi-metric correlation analysis — see how a dimension selection impacts all KPIs simultaneously
- Interactive executive dashboards — let stakeholders click once and see the full picture
- Customer-facing dashboards — provide self-service exploration without building separate filtered views
How It Works
When Cross Dashboard Drill Down is enabled on a metric:- You click a data point (e.g., a bar segment for “West”)
- The system extracts the drilled dimension and its value (e.g.,
region = 'West') - This value is applied as a row-level security (RLS) filter condition to all other metrics on the dashboard
- All metrics re-query their data with the additional filter applied
- The entire dashboard updates to reflect the selected dimension value
Cross-dashboard drill-down filters work alongside existing dashboard filters. Both are applied simultaneously — the drill filter does not replace your dashboard filters, it adds to them.
Setting Up Cross Dashboard Drill Down
1. Activate Cross Dashboard Drill Down
On the metric page, click the “Settings” icon, navigate to the “Actions” tab, and enable the “Drill down” toggle. Then activate “Cross Dashboard Drill Down” beneath it.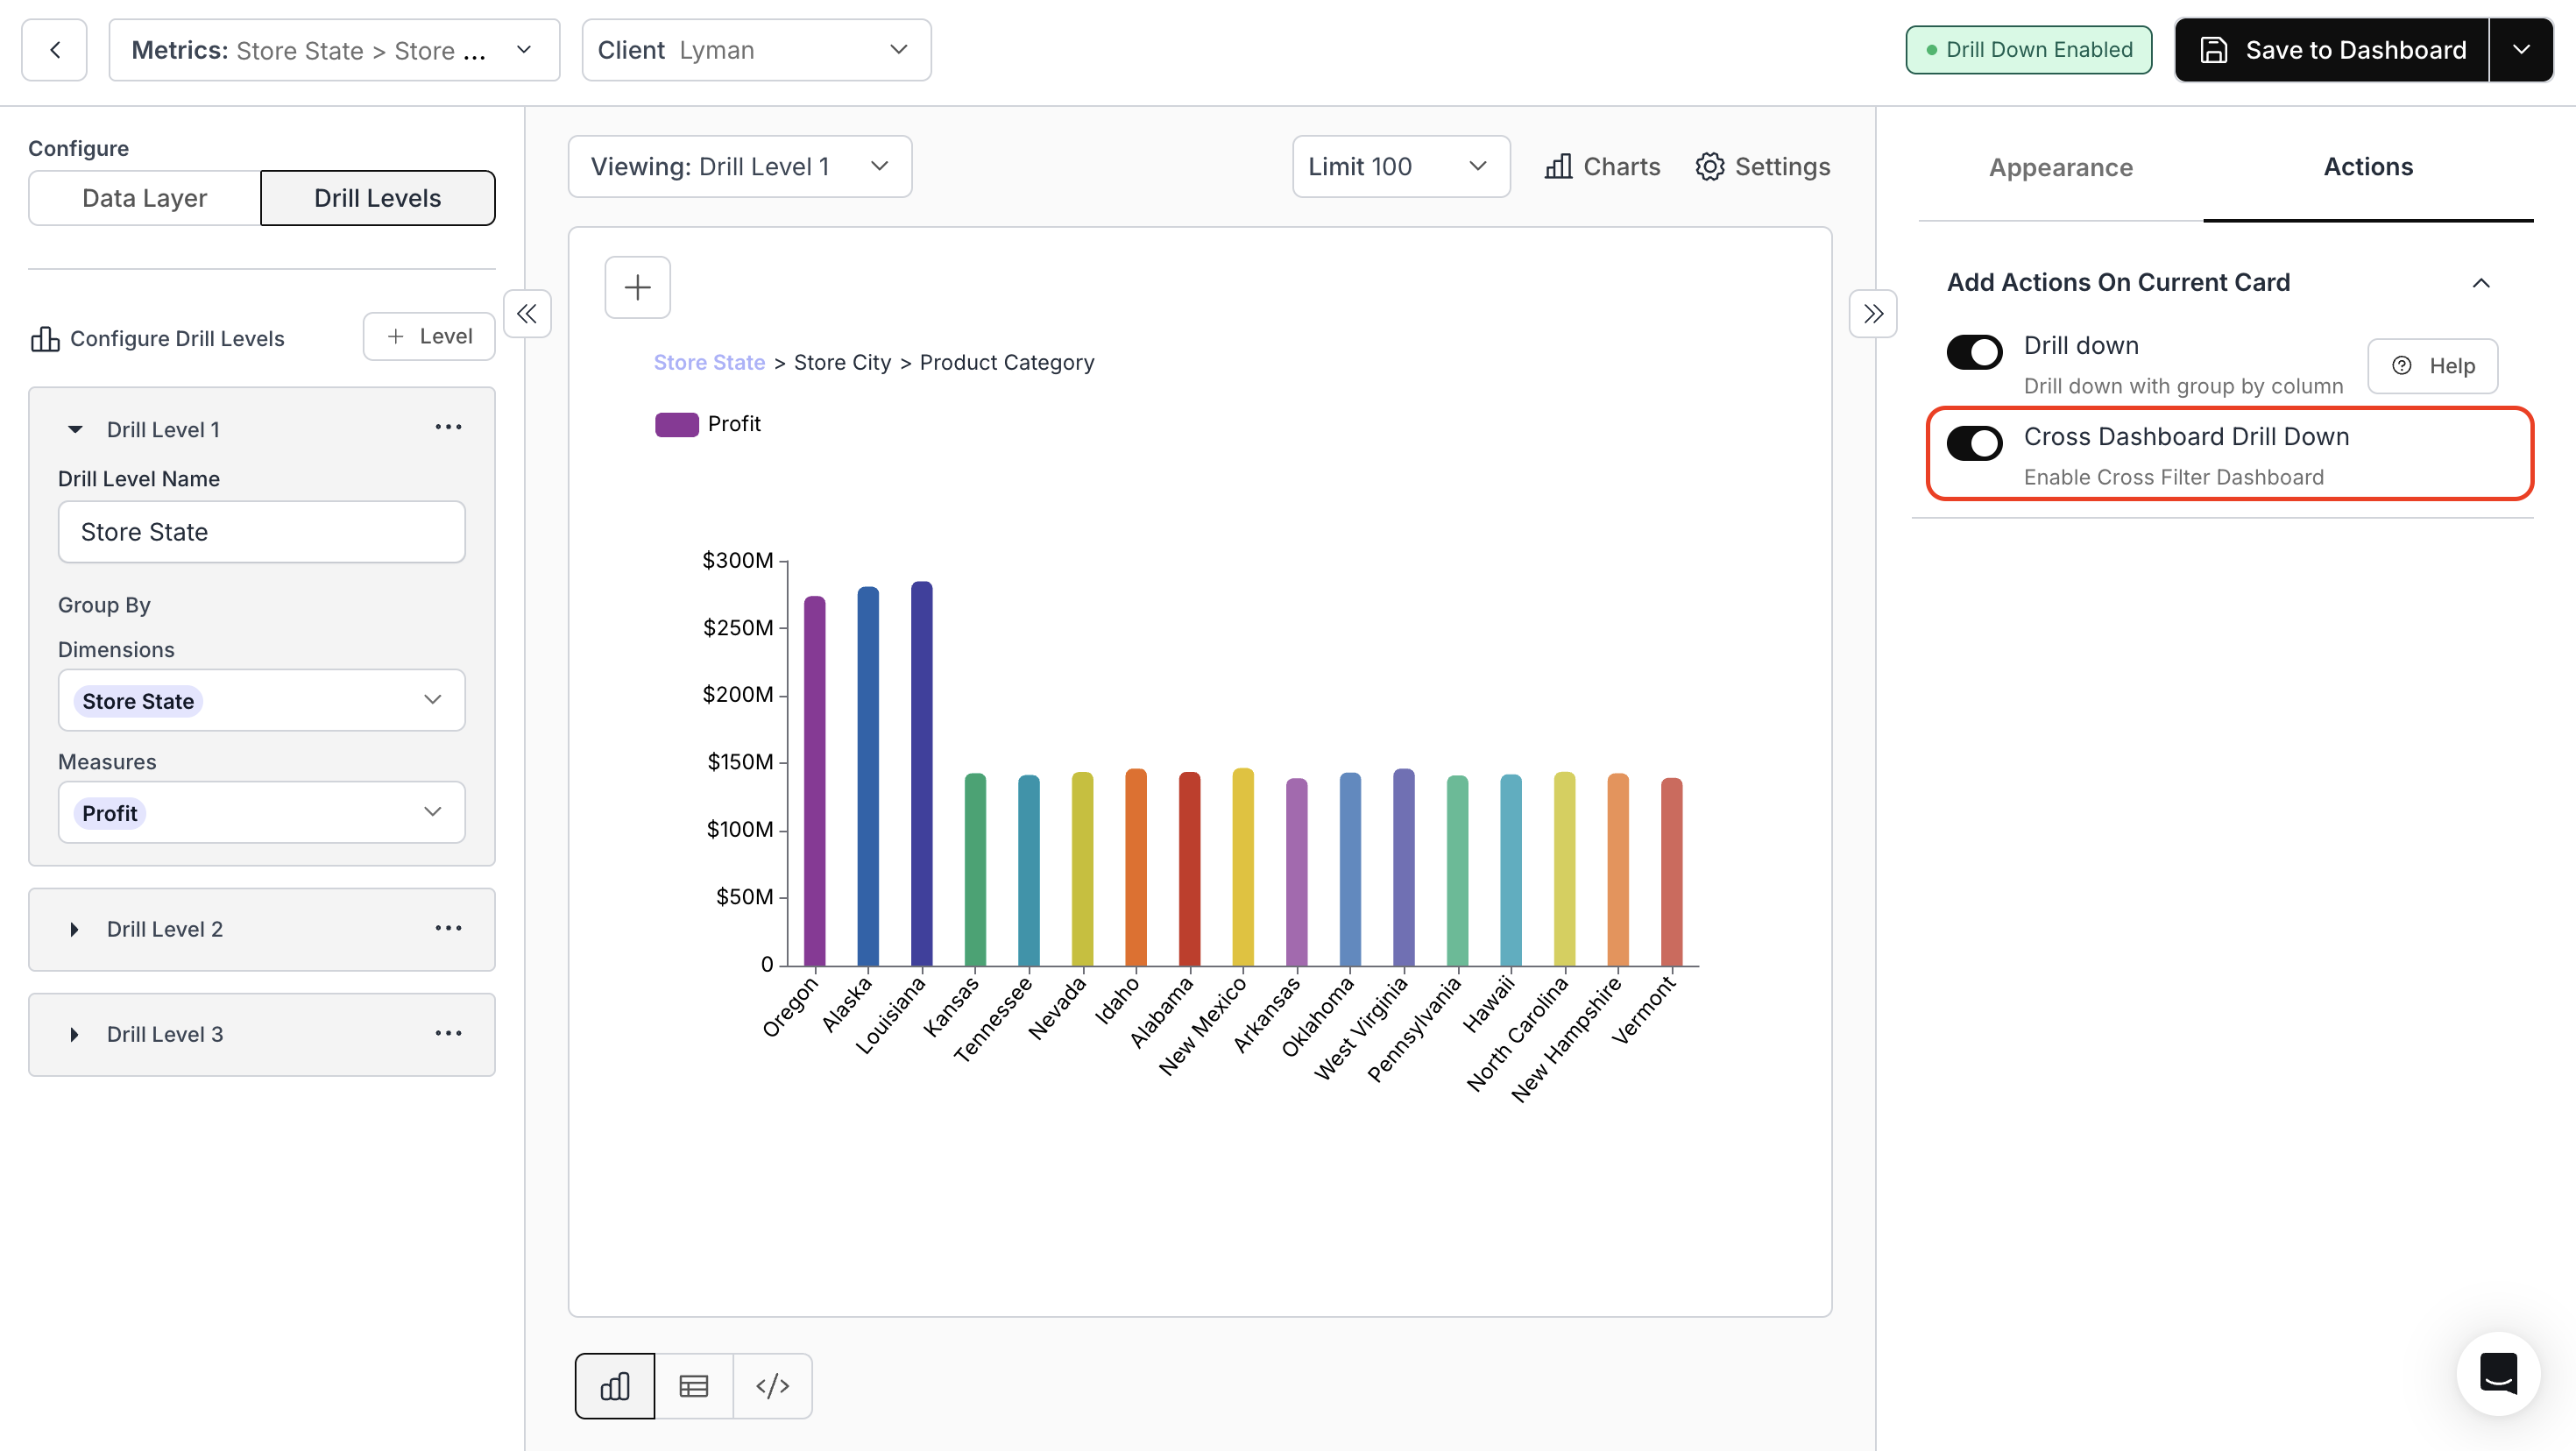
2. View Changes in the Dashboard
Click on a segment of the chart where drill down is enabled. All other metrics on the dashboard will update to reflect the selected value.
3. Clear the Cross-Dashboard Filter
Click on the same dimension in the drilled-down chart to revert all changes and remove the cross-dashboard filter.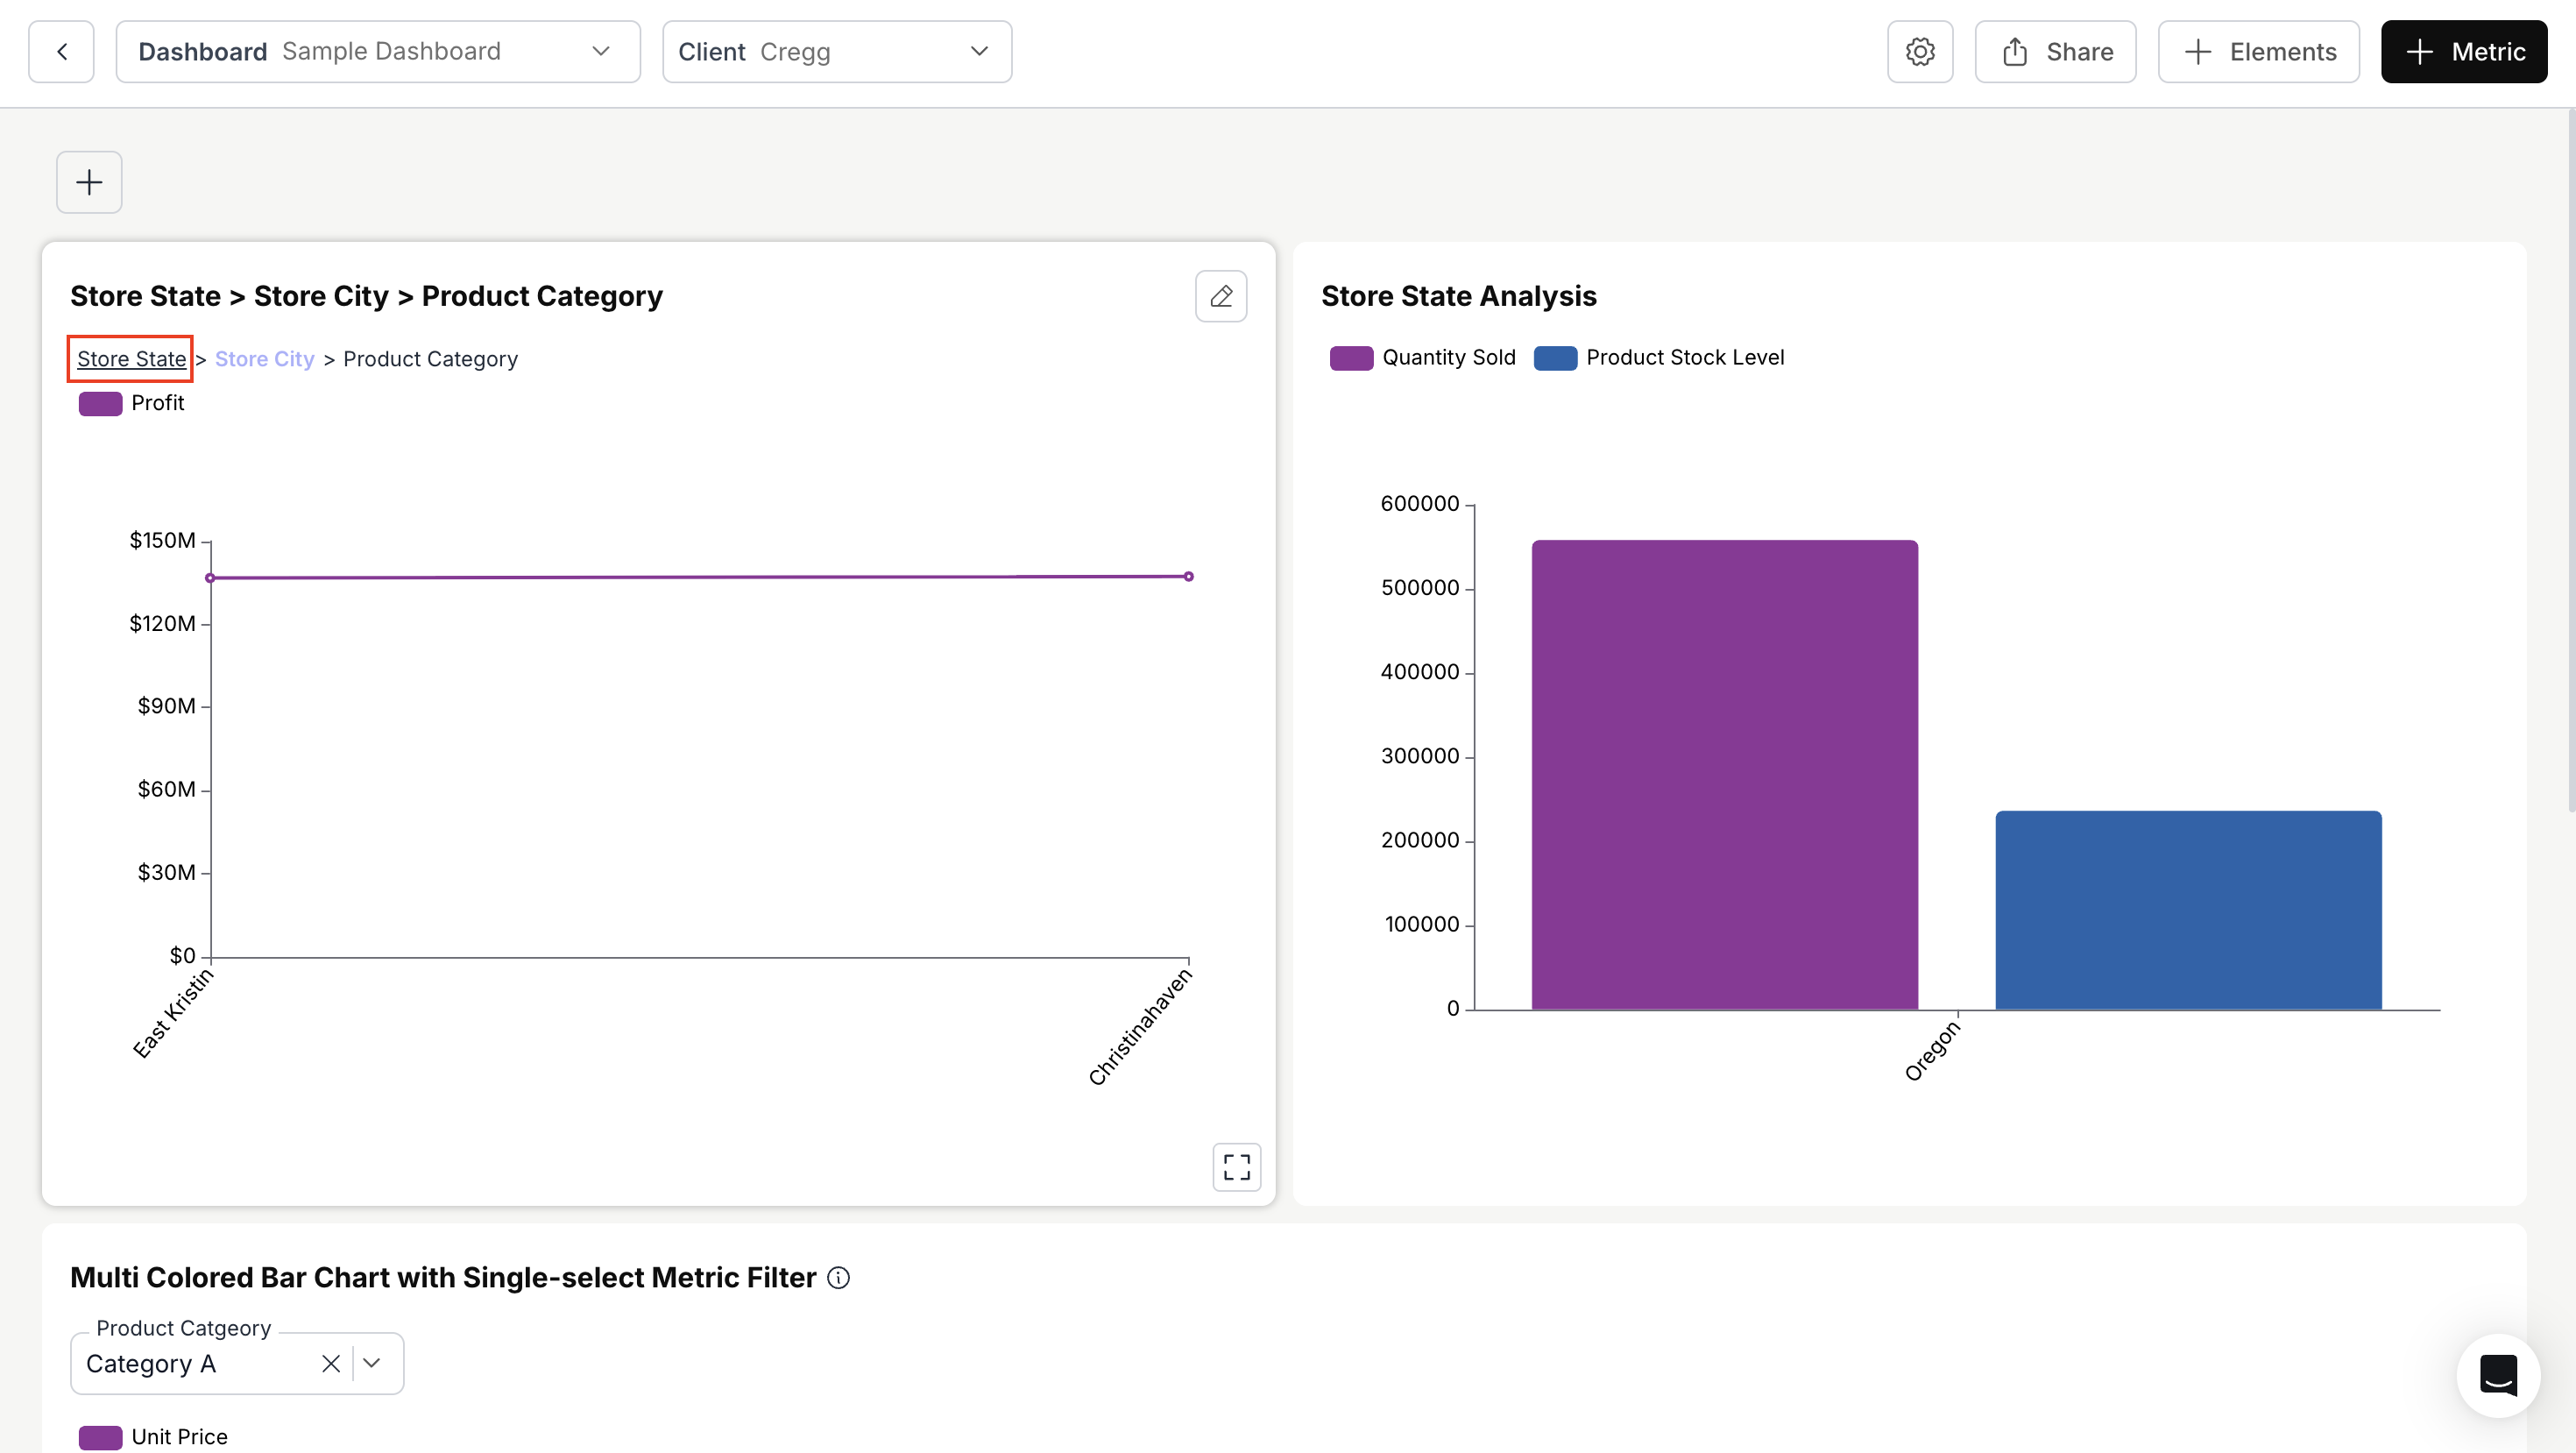
Which Metrics Are Affected?
When you trigger a cross-dashboard drill, the filter is applied to all metrics on the same dashboard. The drilled value is passed as an additional filter condition to every metric’s query.- Metrics whose underlying data includes the drilled column will filter their results accordingly.
- Metrics whose queries do not reference that column may show no change or may return an error depending on the SQL generated. For best results, ensure metrics on the same dashboard share common dimensions when using cross-dashboard drill.
- The filter uses the column name from the drilled metric, so consistent naming across metrics improves reliability.
Cross Dashboard vs. Regular Drill Down
You can enable both regular drill-down and cross-dashboard drill-down on the same metric. The cross-dashboard filter applies to other metrics while the originating metric drills into its own hierarchy.
Troubleshooting
Other metrics don't update when I drill
Other metrics don't update when I drill
Cause: Cross Dashboard Drill Down is not enabled, or other metrics don’t share the drilled column.Fix:
- Verify Cross Dashboard Drill Down is enabled in the originating metric’s Settings > Actions tab.
- Check that other metrics on the dashboard have the same dimension column (by name or alias) as the drilled value.
Dashboard filters conflict with cross-dashboard drill
Dashboard filters conflict with cross-dashboard drill
Cause: Both dashboard filters and the cross-dashboard drill filter are applied simultaneously.Fix:
- This is expected behavior — both filters are additive. If the dashboard filter already restricts to a different value, the combined filter may return no data.
- Clear either the dashboard filter or the cross-dashboard drill to see results.
Cannot clear the cross-dashboard filter
Cannot clear the cross-dashboard filter
Fix: Click on the same dimension value in the originating chart (the one where you first drilled) to clear the cross-dashboard filter and restore all metrics.
You’ve successfully enabled Cross Dashboard Drill Down.
Your dashboard now responds dynamically to drilled dimensions, giving users deeper, interconnected analysis across views.