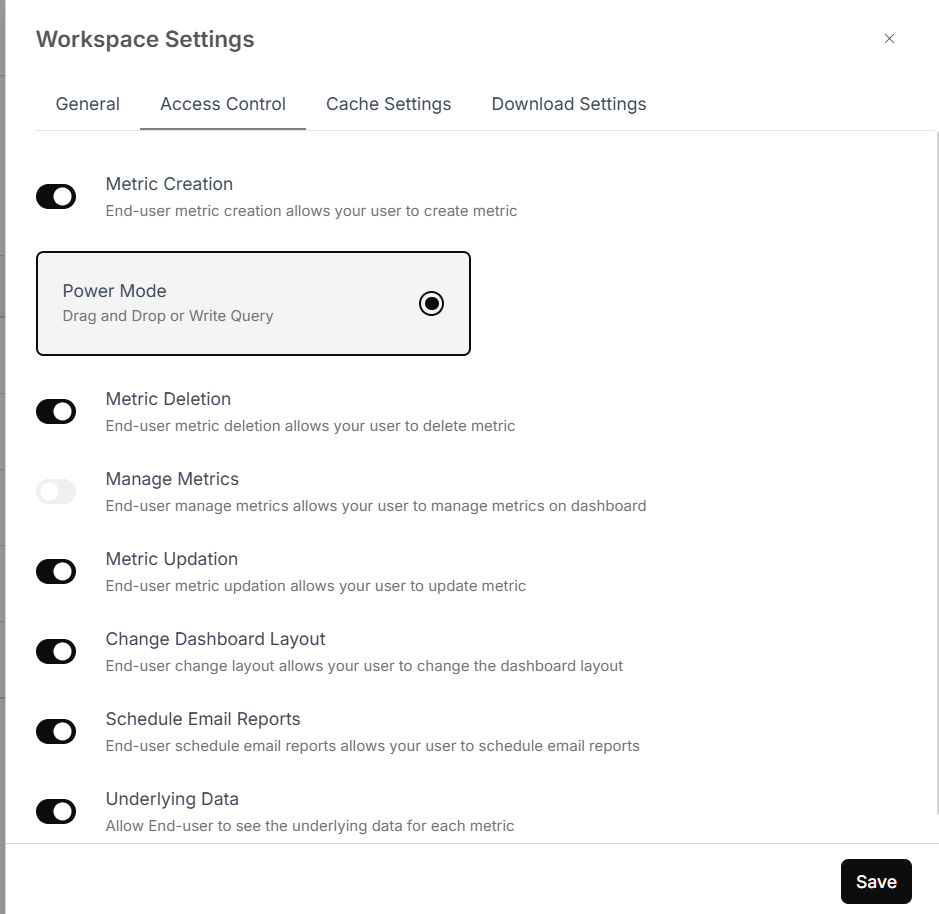
Configure Access Control
In the “Access Control” section, you can set access permissions for your end users by toggling the following options:- Metric Creation – Allows users to create metrics.
- Metric Deletion – Allows users to delete metrics.
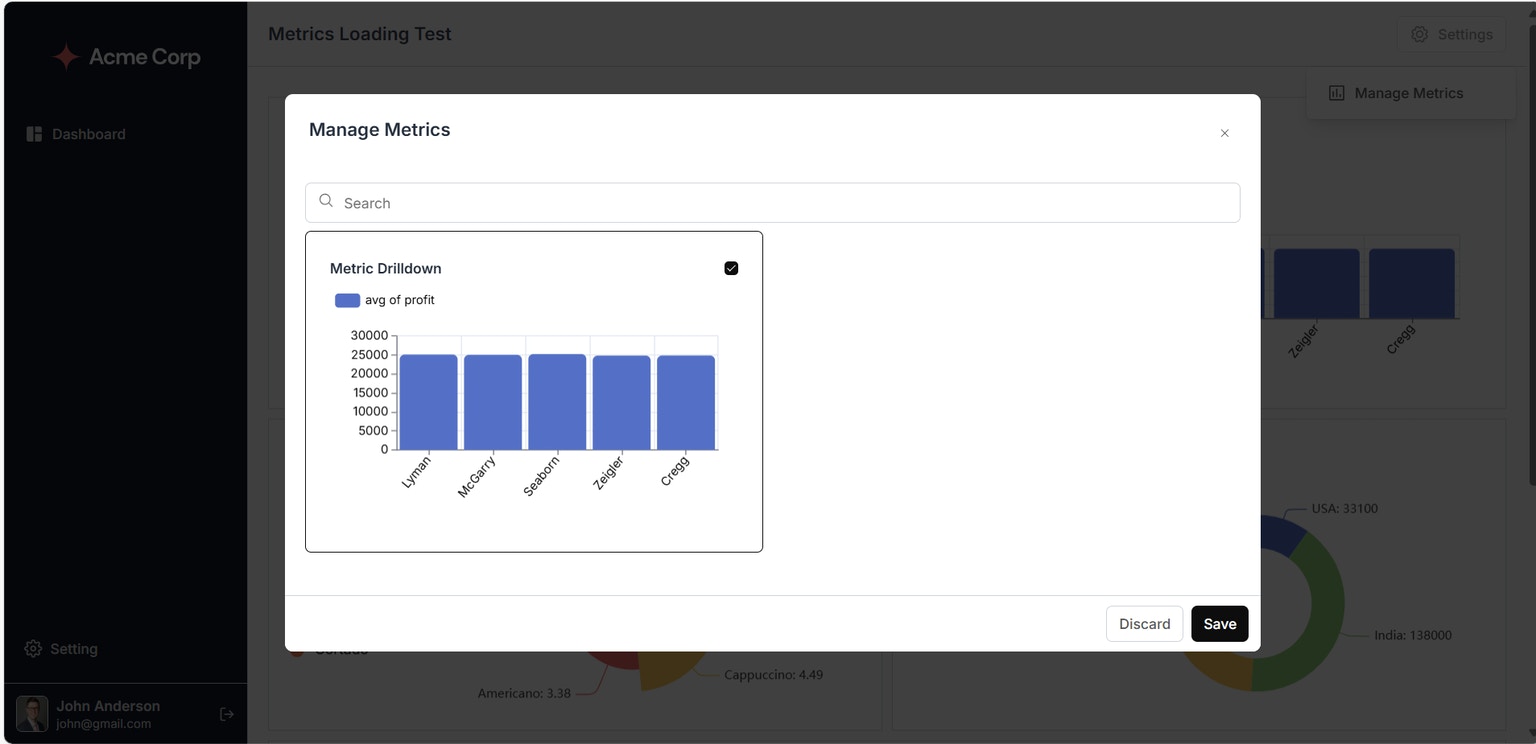
- Manage Metrics – Enables management of metrics on the dashboard.
- Metric Updation – Lets users update existing metrics.
- Change Dashboard Layout – Grants permission to rearrange dashboard elements.
- Schedule Email Reports – Allows users to schedule report emails.
- Underlying Data – Provides access to raw data behind the metric.
- You can also choose between Power Mode and Chat Mode based on user experience preference.
Metric Permissions Breakdown
- “Metric Creation”: Lets users create metrics.
- “Metric Deletion”: Grants users the capability to erase metrics.
- “Manage Metrics”: Enables users to manage the metrics displayed on your dashboard. They can archive/unarchive metrics from Manage Metric in embedded dashboard settings.
- “Metric Updation”: Enables users to update metrics.
- “Change Dashboard Layout”: Permits users to alter the dashboard’s layout.
- “Schedule Email Reports”: Enables users to schedule automated email reports for your metrics.
- “Underlying Data”: Grants you access to view the raw data that supports each metric.
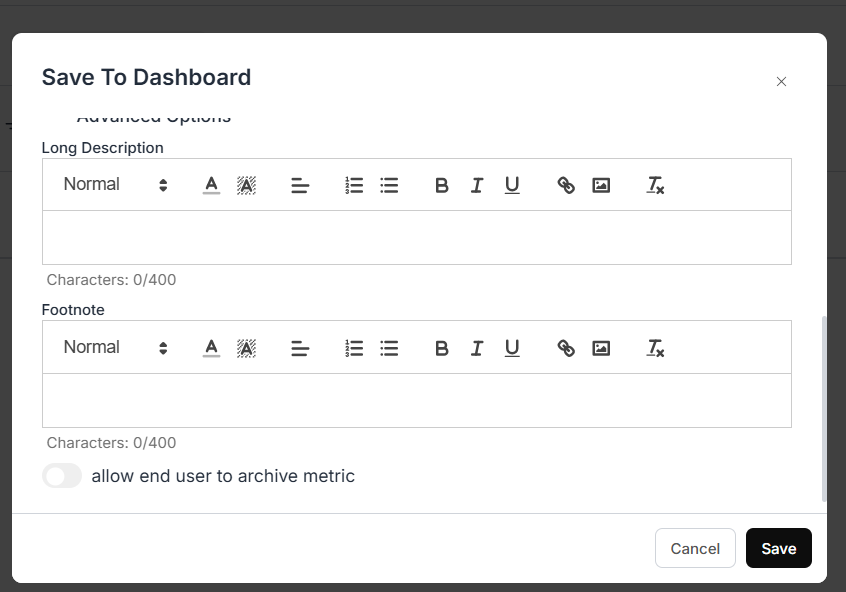
To allow an end user to archive a metric from the dashboard, mark the allowed metric on the Save to Dashboard form and save it.