Guides
Visit our websiteDeveloper Docs
  • Getting Started with Databrain
    • What is Databrain?
  • ❄️Onboarding & Configuration
    • 📝Sign-Up
    • ✍️Sign-In
    • ✏️Google Sign In Setup for Self-hosted app
    • 🤔Forgot password? Recover your Databrain Account
    • 🌟Onboarding
    • 💾Add a Data Source
    • 🧑Configure Tenants
    • 🆕Create a Workspace
    • 🔓Create a Private Workspace
    • 🆕Create a Dashboard
    • 💠Create a Metric
      • Create Custom Columns
      • Create a Metric using Chat Mode
      • Create a Metric using Custom SQL
    • Workspace Settings
      • General Settings
      • Access Control Settings
      • Cache Settings
      • Download Settings
    • 🗄️Explore Data
  • 🛢️Datasources
    • Connecting Data Sources to Databrain
      • Amazon Redshift
      • Snowflake
      • BigQuery
      • MySQL
      • Postgres
      • MongoDB
      • ElasticSearch
      • DataBricks
      • ClickHouse
      • MSSQL
      • Amazon S3
      • CSV
      • Firebolt
      • SingleStore
      • Athena
    • Allow Access to our IP
    • Add a Data Source
    • Configure Tenants
    • How to Sync a Data Source
    • Edit Tenancy
    • Create a Datamart
    • Semantic Layer
    • Create a Data App
    • Creating a Custom Dataset/View in a Multi-Datasource Environment
  • Workspace
    • Multi Datasource Workspace
  • 🔍DASHBOARDS
    • Edit a Dashboard
    • Share Dashboard
    • Dashboard Settings
    • Create/Modify Dashboard Filter
      • Dashboard Filter - Variable Apply On
      • Add LHS and RHS custom sql support for dashboard filter
    • Customize Layout
    • Adding Elements to Dashboard
    • Import/Export Dashboard
    • Report Scheduler
  • 📉METRIC
    • Edit a Metric
    • Joins , Filter, Sort, Group By
    • Complex Filter
    • Apply Metric Filter
      • Metric Filter - Variable
      • Metric Filter - Custom
    • Switch X axis and Switch Y axis
    • Group By
    • Footnote and Long Description
    • Dynamic Property
    • Archive/Unarchive Metric Card
    • Download Metric Card
    • Download Underlying Data
    • Metric Summary
    • Metric Expression for Single Value Card
    • AI Summary
    • Merge Metrics
    • Section Filters
    • View Unpublished Metrics
  • 📊VISUALIZATIONS - ACTIONS & APPEARANCE
    • Chart Actions
      • Chart Click Action
      • Chart Click Action with Metric
      • Card Click Action
      • Drill Down
      • Cross Dashboard Drill Down
    • Chart Appearance
      • Chart-Specific Appearance Options
  • 🛢️PREVIEW OF DASHBOARDS
    • Email Settings for Scheduled Reports
    • Scheduled Reports for End User
  • 🔍FILTERS
    • Dashboard Filter
    • Metric Filter
    • App filter
  • 💡Features
    • Python Editor Console
    • Custom SQL Console
    • Custom SQL Query Guidelines
  • 🏢Integrating Plugin
    • ✳️Get an auth token
    • 🙏Get a guest token
  • 🛃THEMEING & CUSTOMIZATION
    • 🎨Creating a theme
    • 🖼️View the theme in action
    • ⚙️Reset a saved theme
  • 📊Metric Component (upto version v0.11.15)
    • ✨Quick start
  • 🕸️Web Components
    • ✨Quick start
    • ⚛️Framework Specific Guide
  • 🚀Product Changelog
  • 🤳Self Hosted Changelog
Powered by GitBook
On this page
  1. Onboarding & Configuration
  2. Create a Metric

Create Custom Columns

This guide offers a straightforward approach to creating custom columns by utilizing calculated fields and SQL queries, enabling users to tailor their data analysis to specific needs.

PreviousCreate a MetricNextCreate a Metric using Chat Mode

Last updated 1 month ago

Purpose of Custom Columns:

Custom columns in Databrain enable users to create and save new data fields derived from their existing data. These columns are mathematically calculated, transformed, or altered to suit specific business needs. Once created, they can be reused across all metrics and analyses.

Example Use Cases:

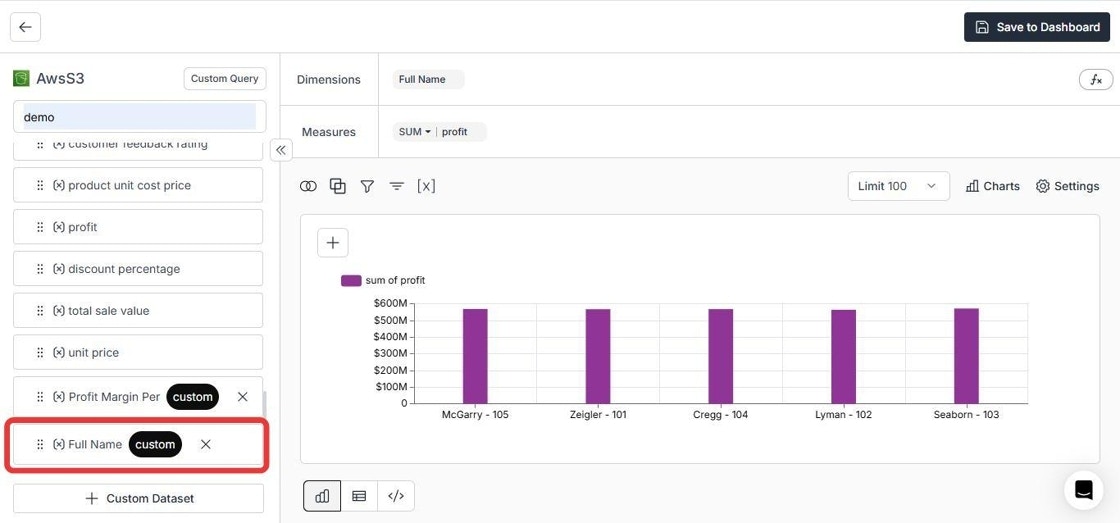
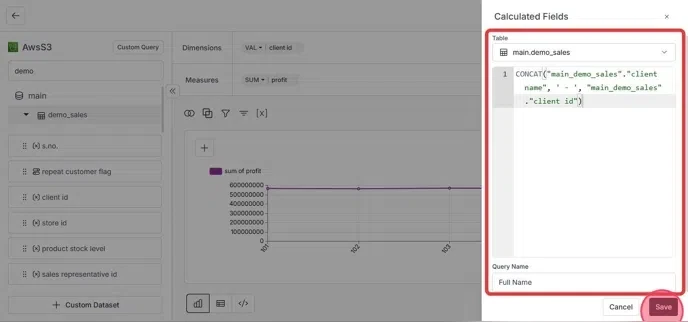
  • Combining fields: Merge first and last names into a "Full Name" column for consistent use across datasets.

  • Standardizing calculations: Create a "Net Revenue" column by subtracting refunds and discounts from total sales, ensuring consistent formulas across reports.

  • Defining business-specific KPIs: Calculate "Customer Lifetime Value" based on purchase frequency, average order value, and customer lifespan to track business performance.

1. Access Calculated Field:

In the metric creation page, hover over the "Measures" area and click on the "+fx" icon.

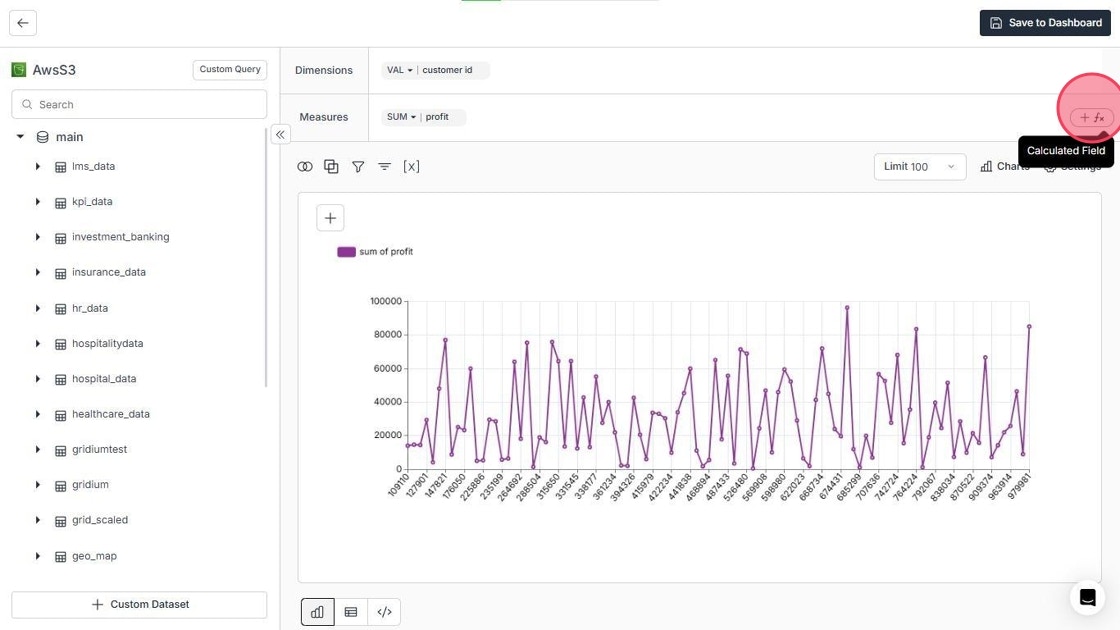
Databrain offers two methods for creating custom columns:

  1. Quick Field: For simple calculations and basic metrics

    Use Cases:

    • Simple mathematical operations (e.g., addition, subtraction).

    • Basic business metrics (e.g., profit margins, conversion rates).

    • Standardized calculations across reports

  2. Complex Field: For advanced calculations and data transformations

    Use Cases:

    • Advanced calculations with multiple conditions

    • Custom aggregations

    • Complex business logic implementation

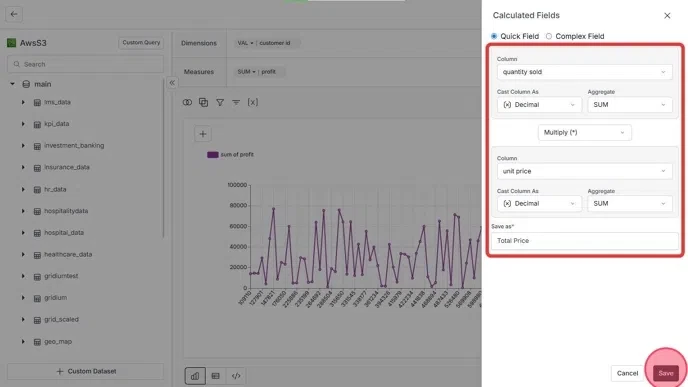
Method 1: Quick Field

  • Column Selection: Choose your input columns.

  • Data Configuration: Set data type and then choose aggregate function.

  • Operation Selection: Pick a mathematical operator (+ - * /).

  • Assign an alias for the calculated field and click on "Save" to save the calculated field.

Method 2: Complex Field

  • In the Metric Creation page, hover over the Measures area and click on the "+fx" icon.

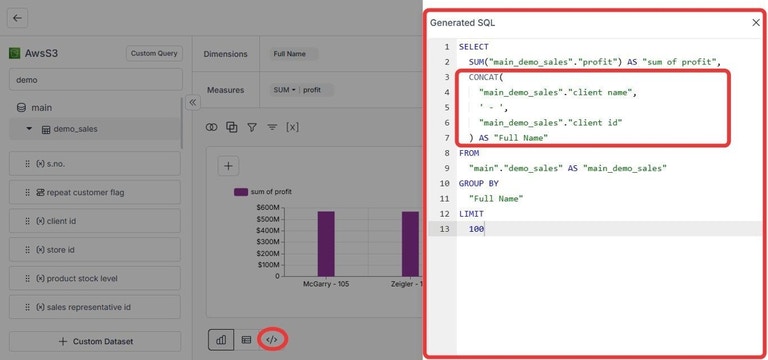
  • Select the target table name, then enter your SQL query in the code area.

  • For the SQL query, please follow the syntax

    "schemaName_tableName"."columnName"

    Replace "schemaName_tableName" with your actual schema and table names.

  • Assign an alias to the query and click "Add".

  • Finally, "Save to Dashboard" to save the metric to the dashboard.

Once saved, the custom column is added to the specified table (e.g., "demo_sales") and is ready for use in any metric or analysis.

Here is an illustration of Generated SQL after adding the Custom SQL Column:

❄️
💠