Guides
Visit our websiteDeveloper Docs
  • Getting Started with DataBrain
    • What is DataBrain?
  • ❄️Onboarding & Configuration
    • 📝Sign-Up
    • ✍️Sign-In
    • ✏️Google Sign In Setup for Self-hosted app
    • 🤔Forgot password? Recover your DataBrain Account
    • 🌟Onboarding
    • 💾Add a Data Source
    • 🧑Configure Tenants
    • 🆕Create a Workspace
    • 🔓Create a Private Workspace
    • 🆕Create a Dashboard
    • 💠Create a Metric
      • Create Custom Columns
      • Create a Metric using Chat Mode
      • Create a Metric using Custom SQL
    • Workspace Settings
      • General Settings
      • Access Control Settings
      • Cache Settings
      • Download Settings
    • 🗄️Explore Data
  • 🛢️Datasources
    • Connecting Data Sources to DataBrain
      • Amazon Redshift
      • Snowflake
      • BigQuery
      • MySQL
      • Postgres
      • MongoDB
      • ElasticSearch
      • DataBricks
      • ClickHouse
      • MSSQL
      • Amazon S3
      • CSV
      • Firebolt
      • SingleStore
      • Athena
    • Allow Access to our IP
    • Add a Data Source
    • Configure Tenants
    • How to Sync a Data Source
    • Edit Tenancy
    • Create a Datamart
    • Semantic Layer
    • Create a Data App
    • Creating a Custom Dataset/View in a Multi-Datasource Environment
  • Workspace
    • Multi Datasource Workspace
  • 🔍DASHBOARDS
    • Edit a Dashboard
    • Share Dashboard
    • Dashboard Settings
    • Create/Modify Dashboard Filter
      • Dashboard Filter - Variable Apply On
      • Add LHS and RHS custom sql support for dashboard filter
    • Customize Layout
    • Adding Elements to Dashboard
    • Import/Export Dashboard
    • Report Scheduler
  • 📉METRIC
    • Edit a Metric
    • Joins , Filter, Sort, Group By
    • Complex Filter
    • Apply Metric Filter
      • Metric Filter - Variable
      • Metric Filter - Custom
    • Switch X axis and Switch Y axis
    • Group By
    • Footnote and Long Description
    • Dynamic Property
    • Archive/Unarchive Metric Card
    • Download Metric Card
    • Download Underlying Data
    • Metric Summary
    • Metric Expression for Single Value Card
    • AI Summary
    • Merge Metrics
    • Section Filters
    • View Unpublished Metrics
  • 📊VISUALIZATIONS - ACTIONS & APPEARANCE
    • Chart Actions
      • Chart Click Action
      • Chart Click Action with Metric
      • Card Click Action
      • Drill Down
      • Cross Dashboard Drill Down
    • Chart Appearance
      • Chart-Specific Appearance Options
  • 🛢️PREVIEW OF DASHBOARDS
    • Email Settings for Scheduled Reports
    • Scheduled Reports for End User
  • 🔍FILTERS
    • Dashboard Filter
    • Metric Filter
    • App filter
  • 💡Features
    • Python Editor Console
    • Custom SQL Console
    • Custom SQL Query Guidelines
  • 🏢Integrating Plugin
    • ✳️Get an auth token
    • 🙏Get a guest token
  • 🛃THEMEING & CUSTOMIZATION
    • 🎨Creating a theme
    • 🖼️View the theme in action
    • ⚙️Reset a saved theme
  • 📊Metric Component (upto version v0.11.15)
    • ✨Quick start
  • 🕸️Web Components
    • ✨Quick start
    • ⚛️Framework Specific Guide
  • 🚀Product Changelog
  • 🤳Self Hosted Changelog
Powered by GitBook
On this page
  1. VISUALIZATIONS - ACTIONS & APPEARANCE

Chart Appearance

Personalize your metric charts with an array of appearance settings for clarity and visual appeal.

PreviousCross Dashboard Drill DownNextChart-Specific Appearance Options

Last updated 5 months ago

In DataBrain, charts are highly customizable and extensible - you can control the appearance, format the labels, manage click behavior and drilldowns, and much more. This guide walks you through the key customization options to help you create professional and effective data visualizations.

Access Chart Appearance:

  • Navigate to your metric card, click the “Appearance & Actions” icon, and select the “Appearance” tab.
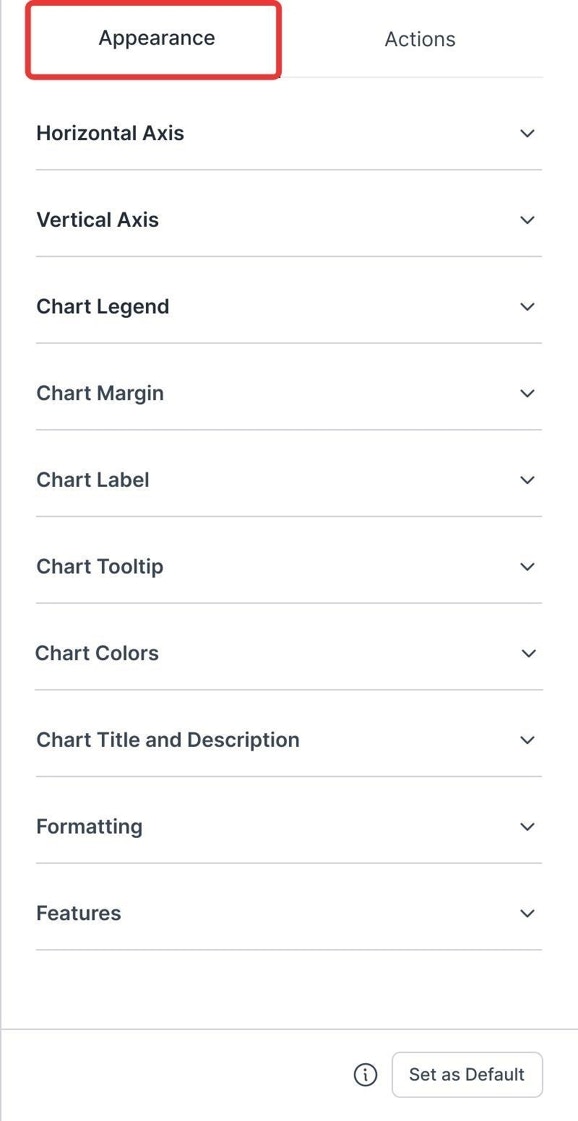
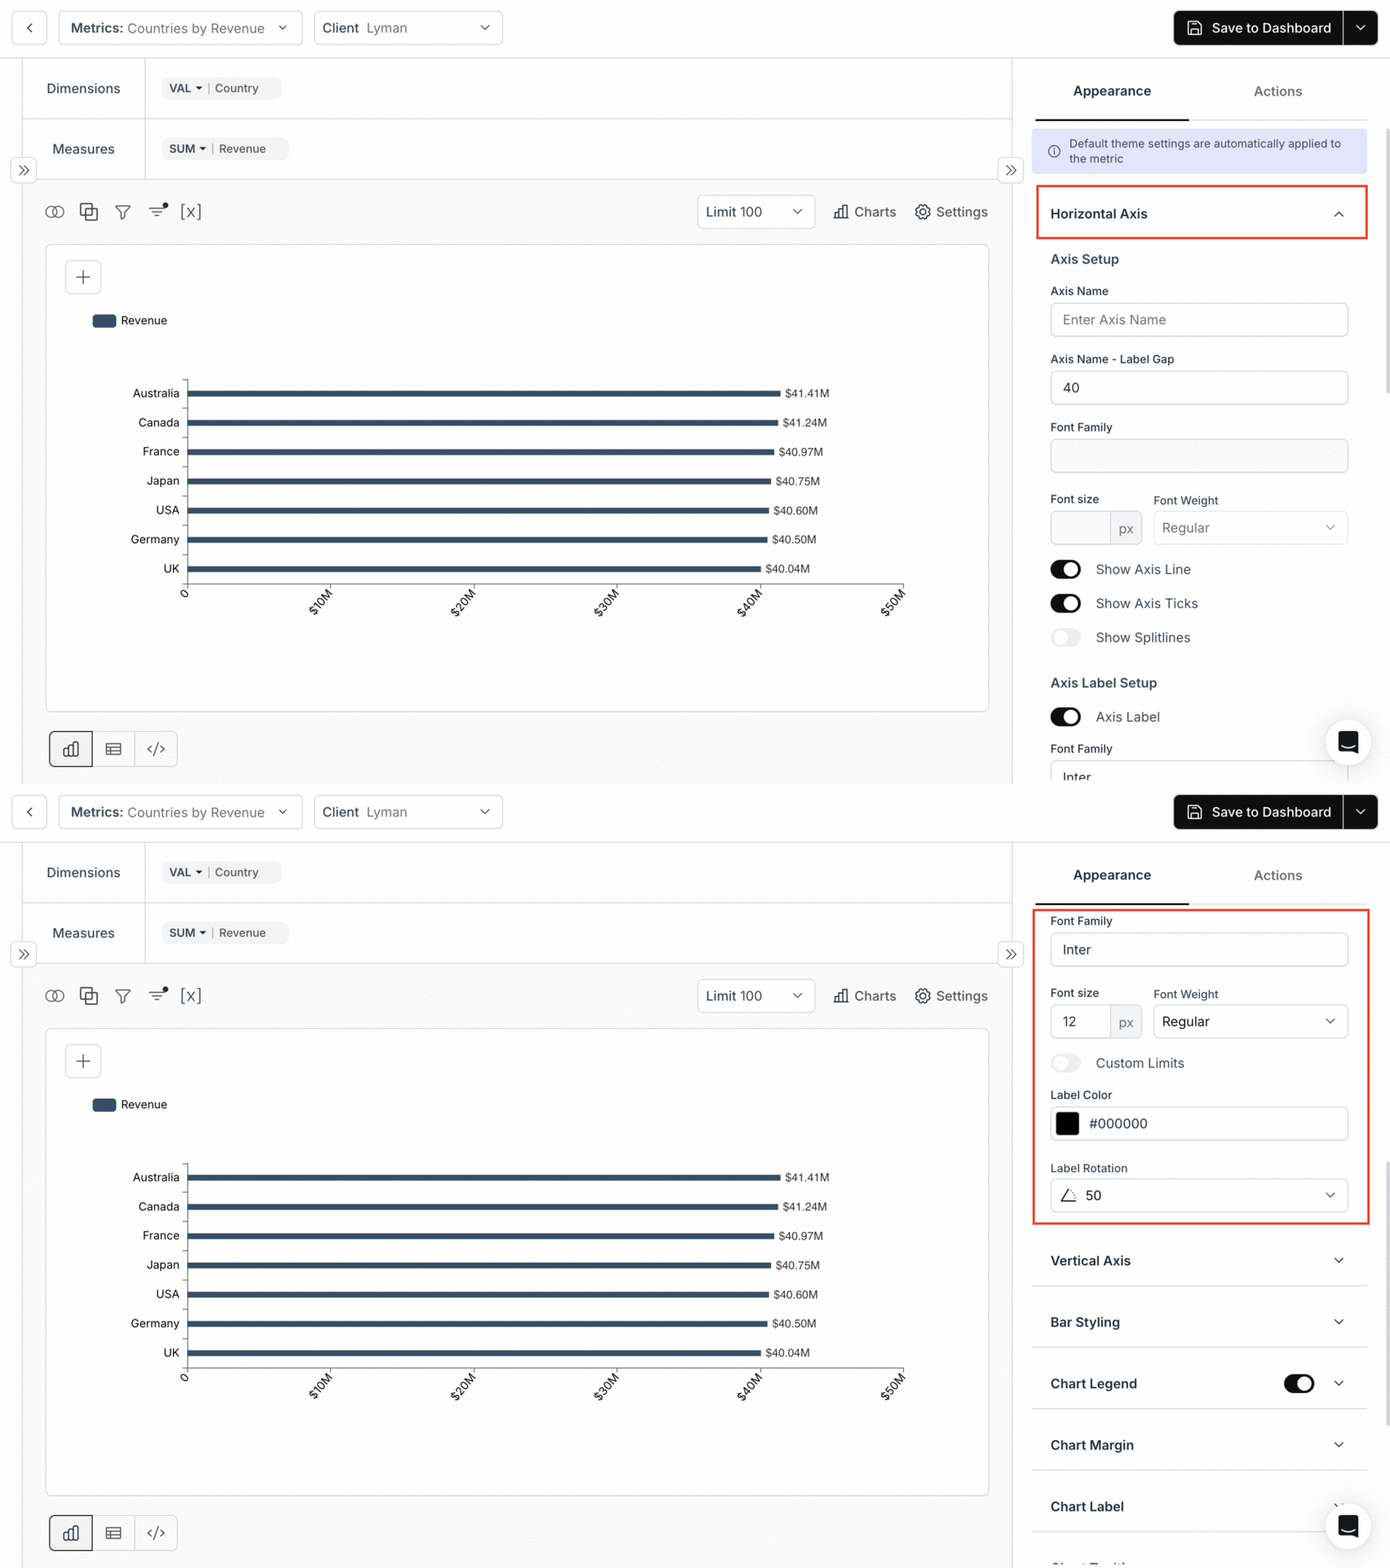
  1. Horizontal Axis Customizations:

  • Toggles: Axis Line, Splitlines, Axis Labels, Truncate Label.

  • Set Values: Label Rotation, Custom Rotation, Truncate Label Value, Distance between name and labels.

  • Adjust: Font properties and color.

  1. Vertical Axis Customizations:

  • Toggles: Axis Line, Splitlines, Axis Labels.

  • Set Values: Distance between name and labels.

  • Adjust: Axis Position and font properties.

  1. Chart Legend:

Customize: Display, appearance, position, truncation, and shape.

Use Case:

Let us take a combo multi-scales chart showing Revenue (purple bars) and YoY Growth (blue line). When you customize the Chart Legend, you can configure:

  • Position: Top-left, center, right; Middle-left, center, right; Bottom-left, center, right

  • Orientation: Horizontal (side by side) or Vertical (stacked)

  • Legend Shape: Square, Diamond, Triangle, Circle, Line

  • Set the Font, Font size, and Label Color and also truncate the size of label
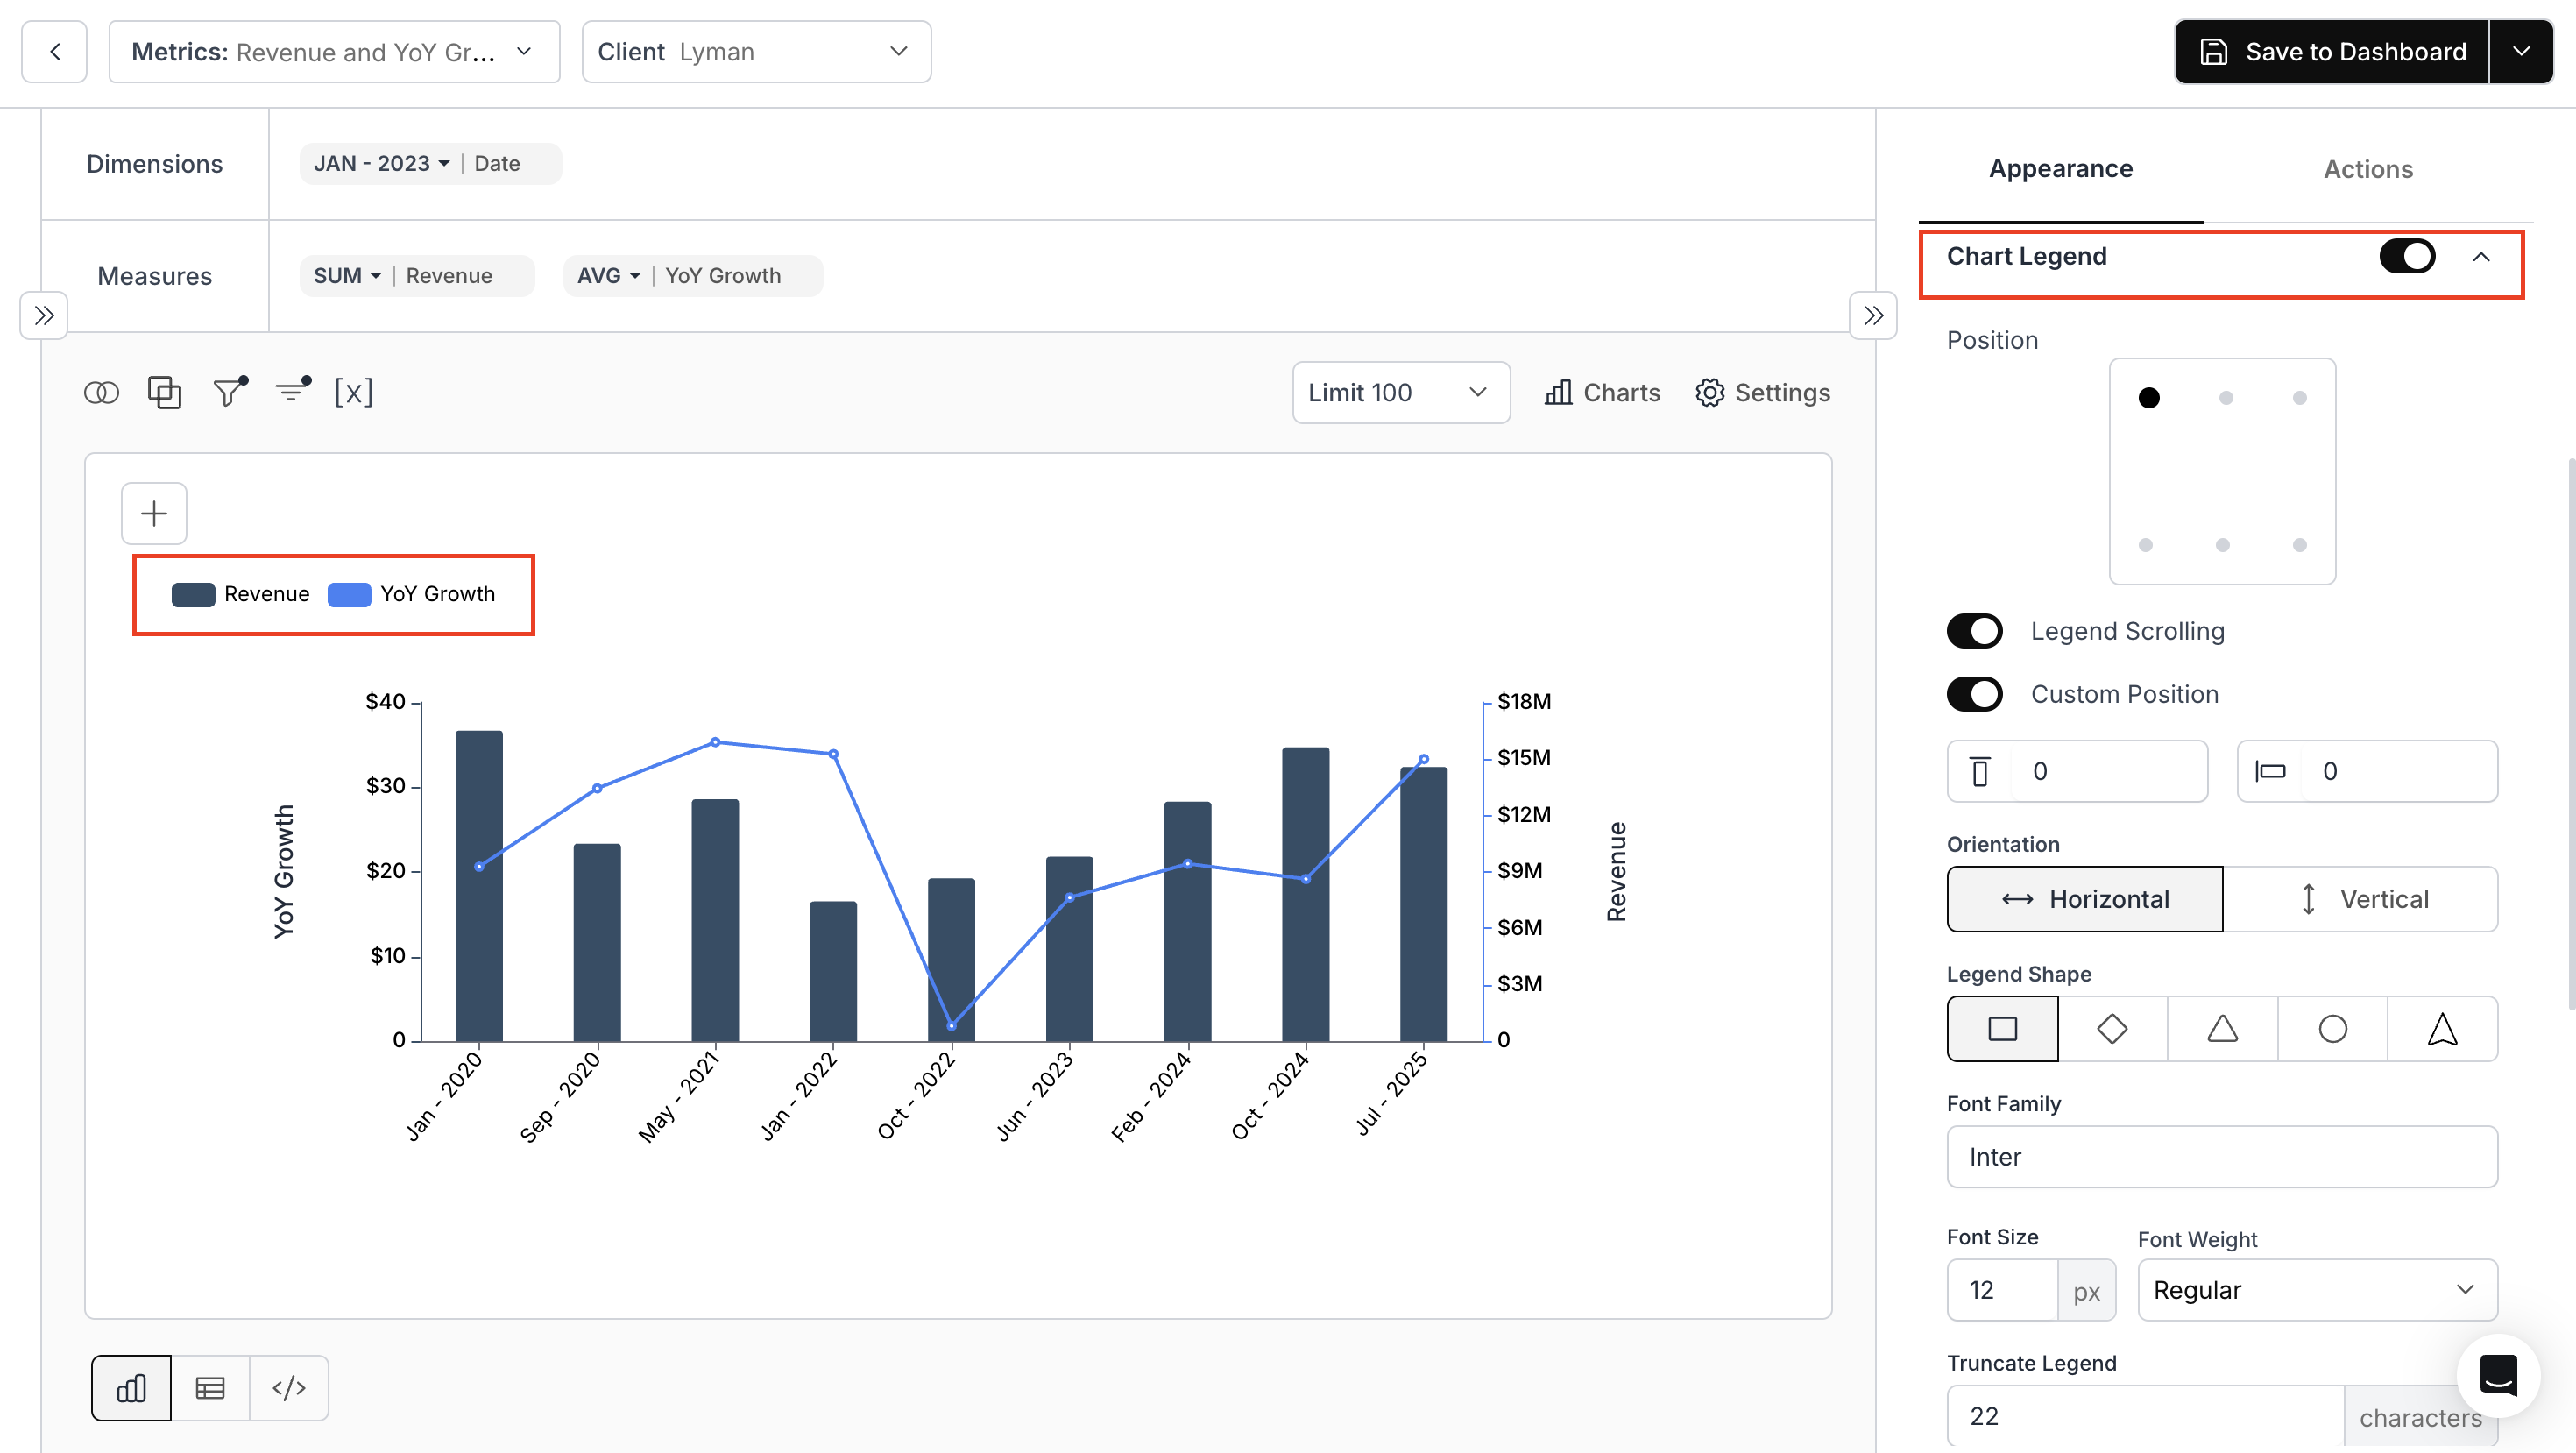
The legend now appears exactly how and where you want it, making the chart clearer and more professional.

  1. Chart Margin:

Define margins for all four sides of the chart.

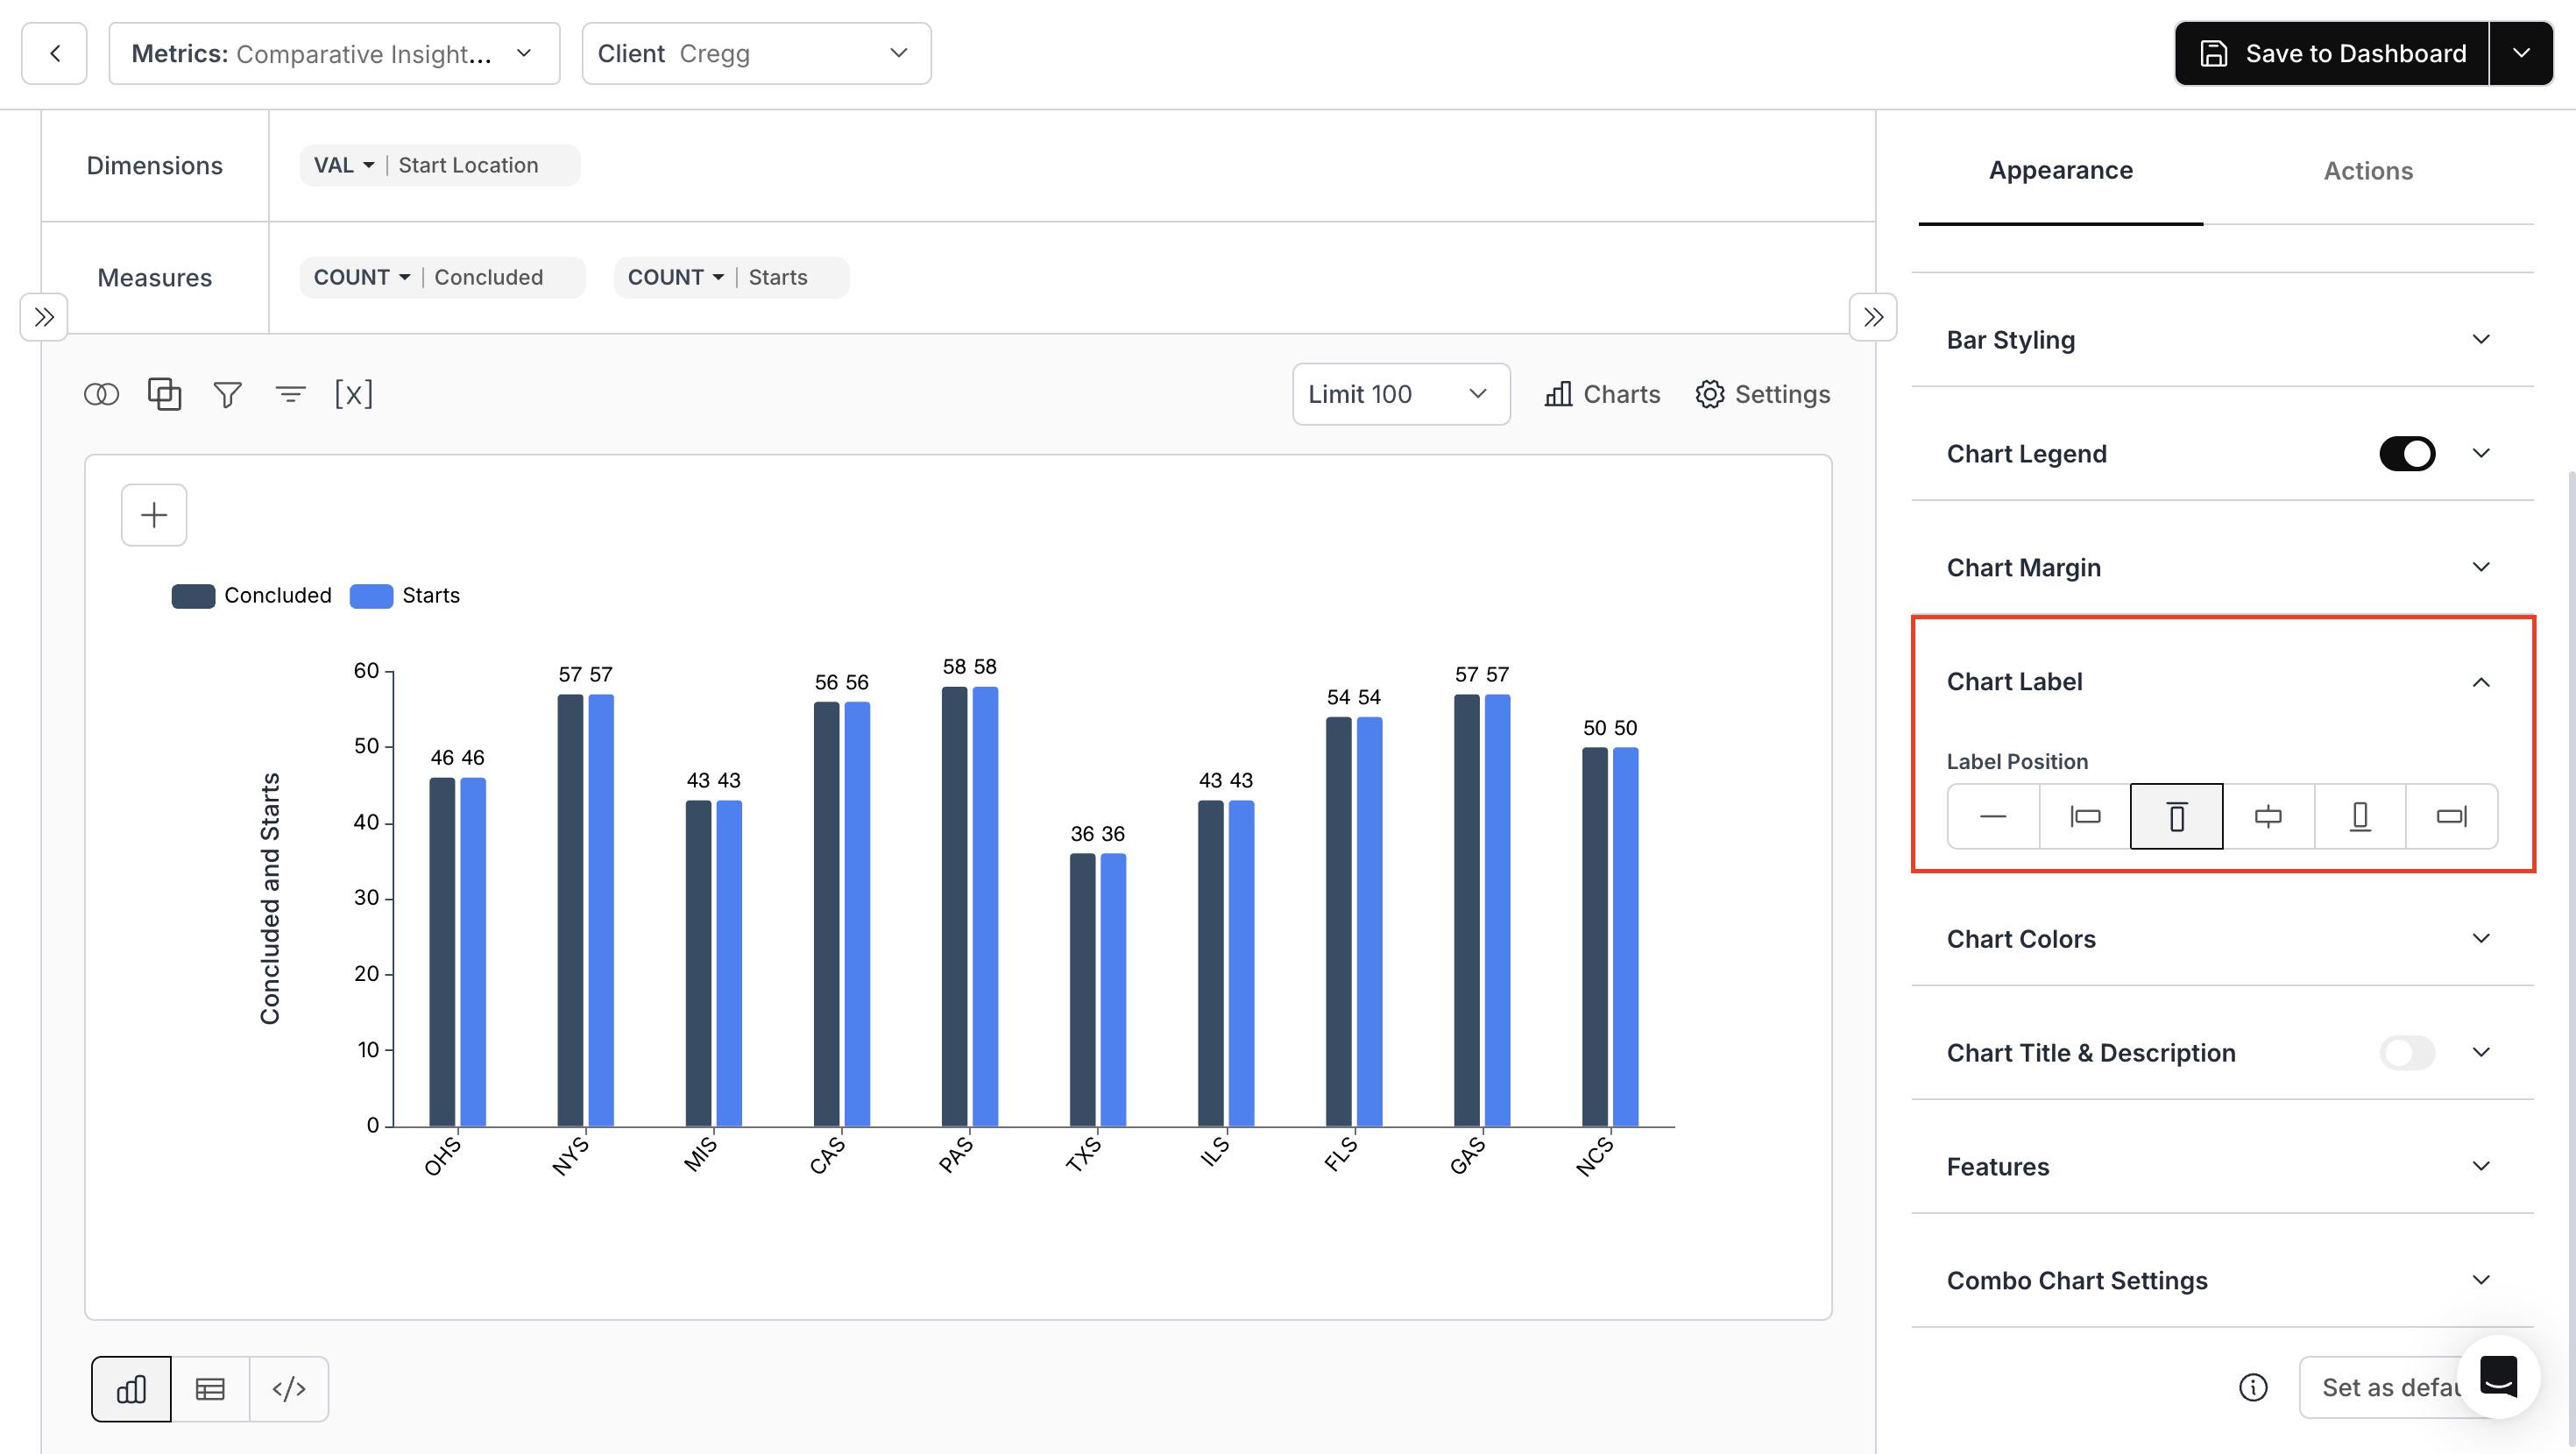
  1. Chart Label:

Position: Determine where value labels appear on the chart.

Use Case:

Let us take a bar chart showing repairs by inventory. When you select a label position, values can appear inside, above, center, left, or right of the bars, enhancing data readability.

The values are now clearly visible in your preferred position, making data reading more convenient.

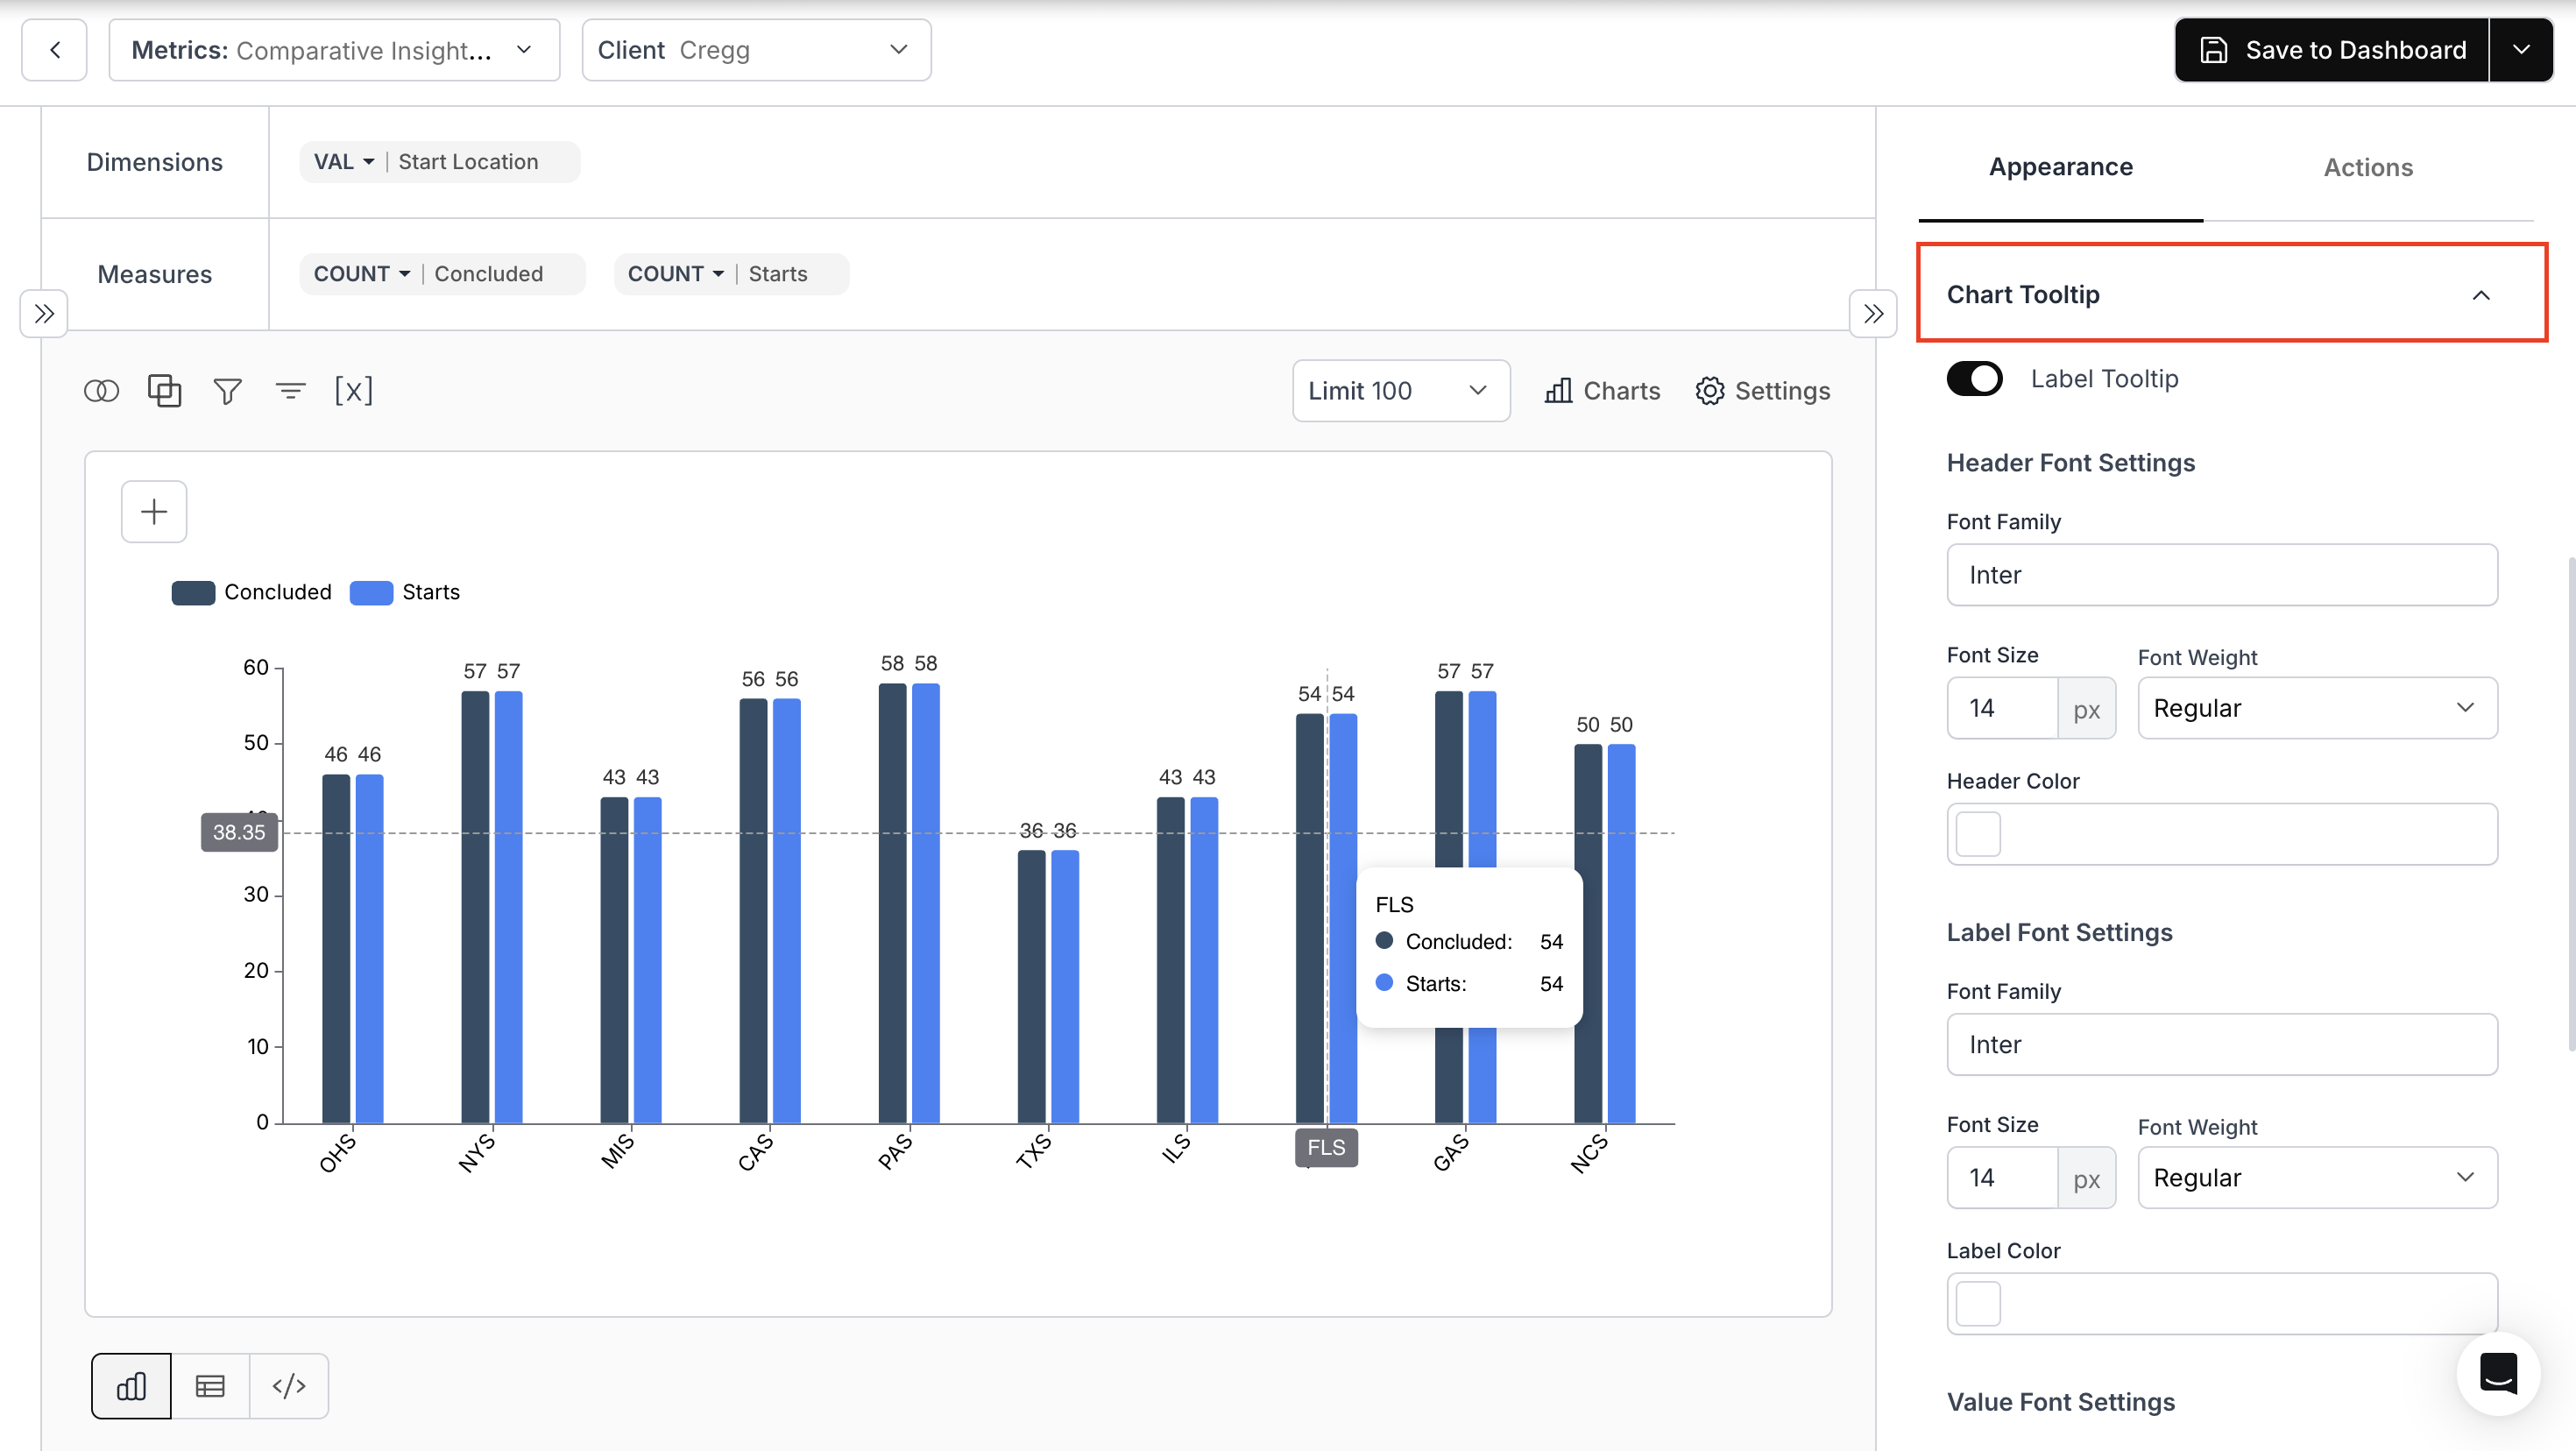
  1. Chart Tooltip

Adjust: Font and color for Header, Label, and Value.

Use Case:

Let us take a bar chart showing repairs by inventory. When you hover over a bar, customize the tooltip's header, label, and value appearance by adjusting their fonts and colors for better readability.

  1. Chart Colors:

Modify: Chart colors, gradients, and background gradients.

  1. Chart Title & Description:

Add: Titles and descriptions, and adjust their positions.

Use Case:

Let us take a combo chart showing Revenue and YoY Growth. Add suitable title and description, and adjust their position to make the chart's purpose instantly clear.

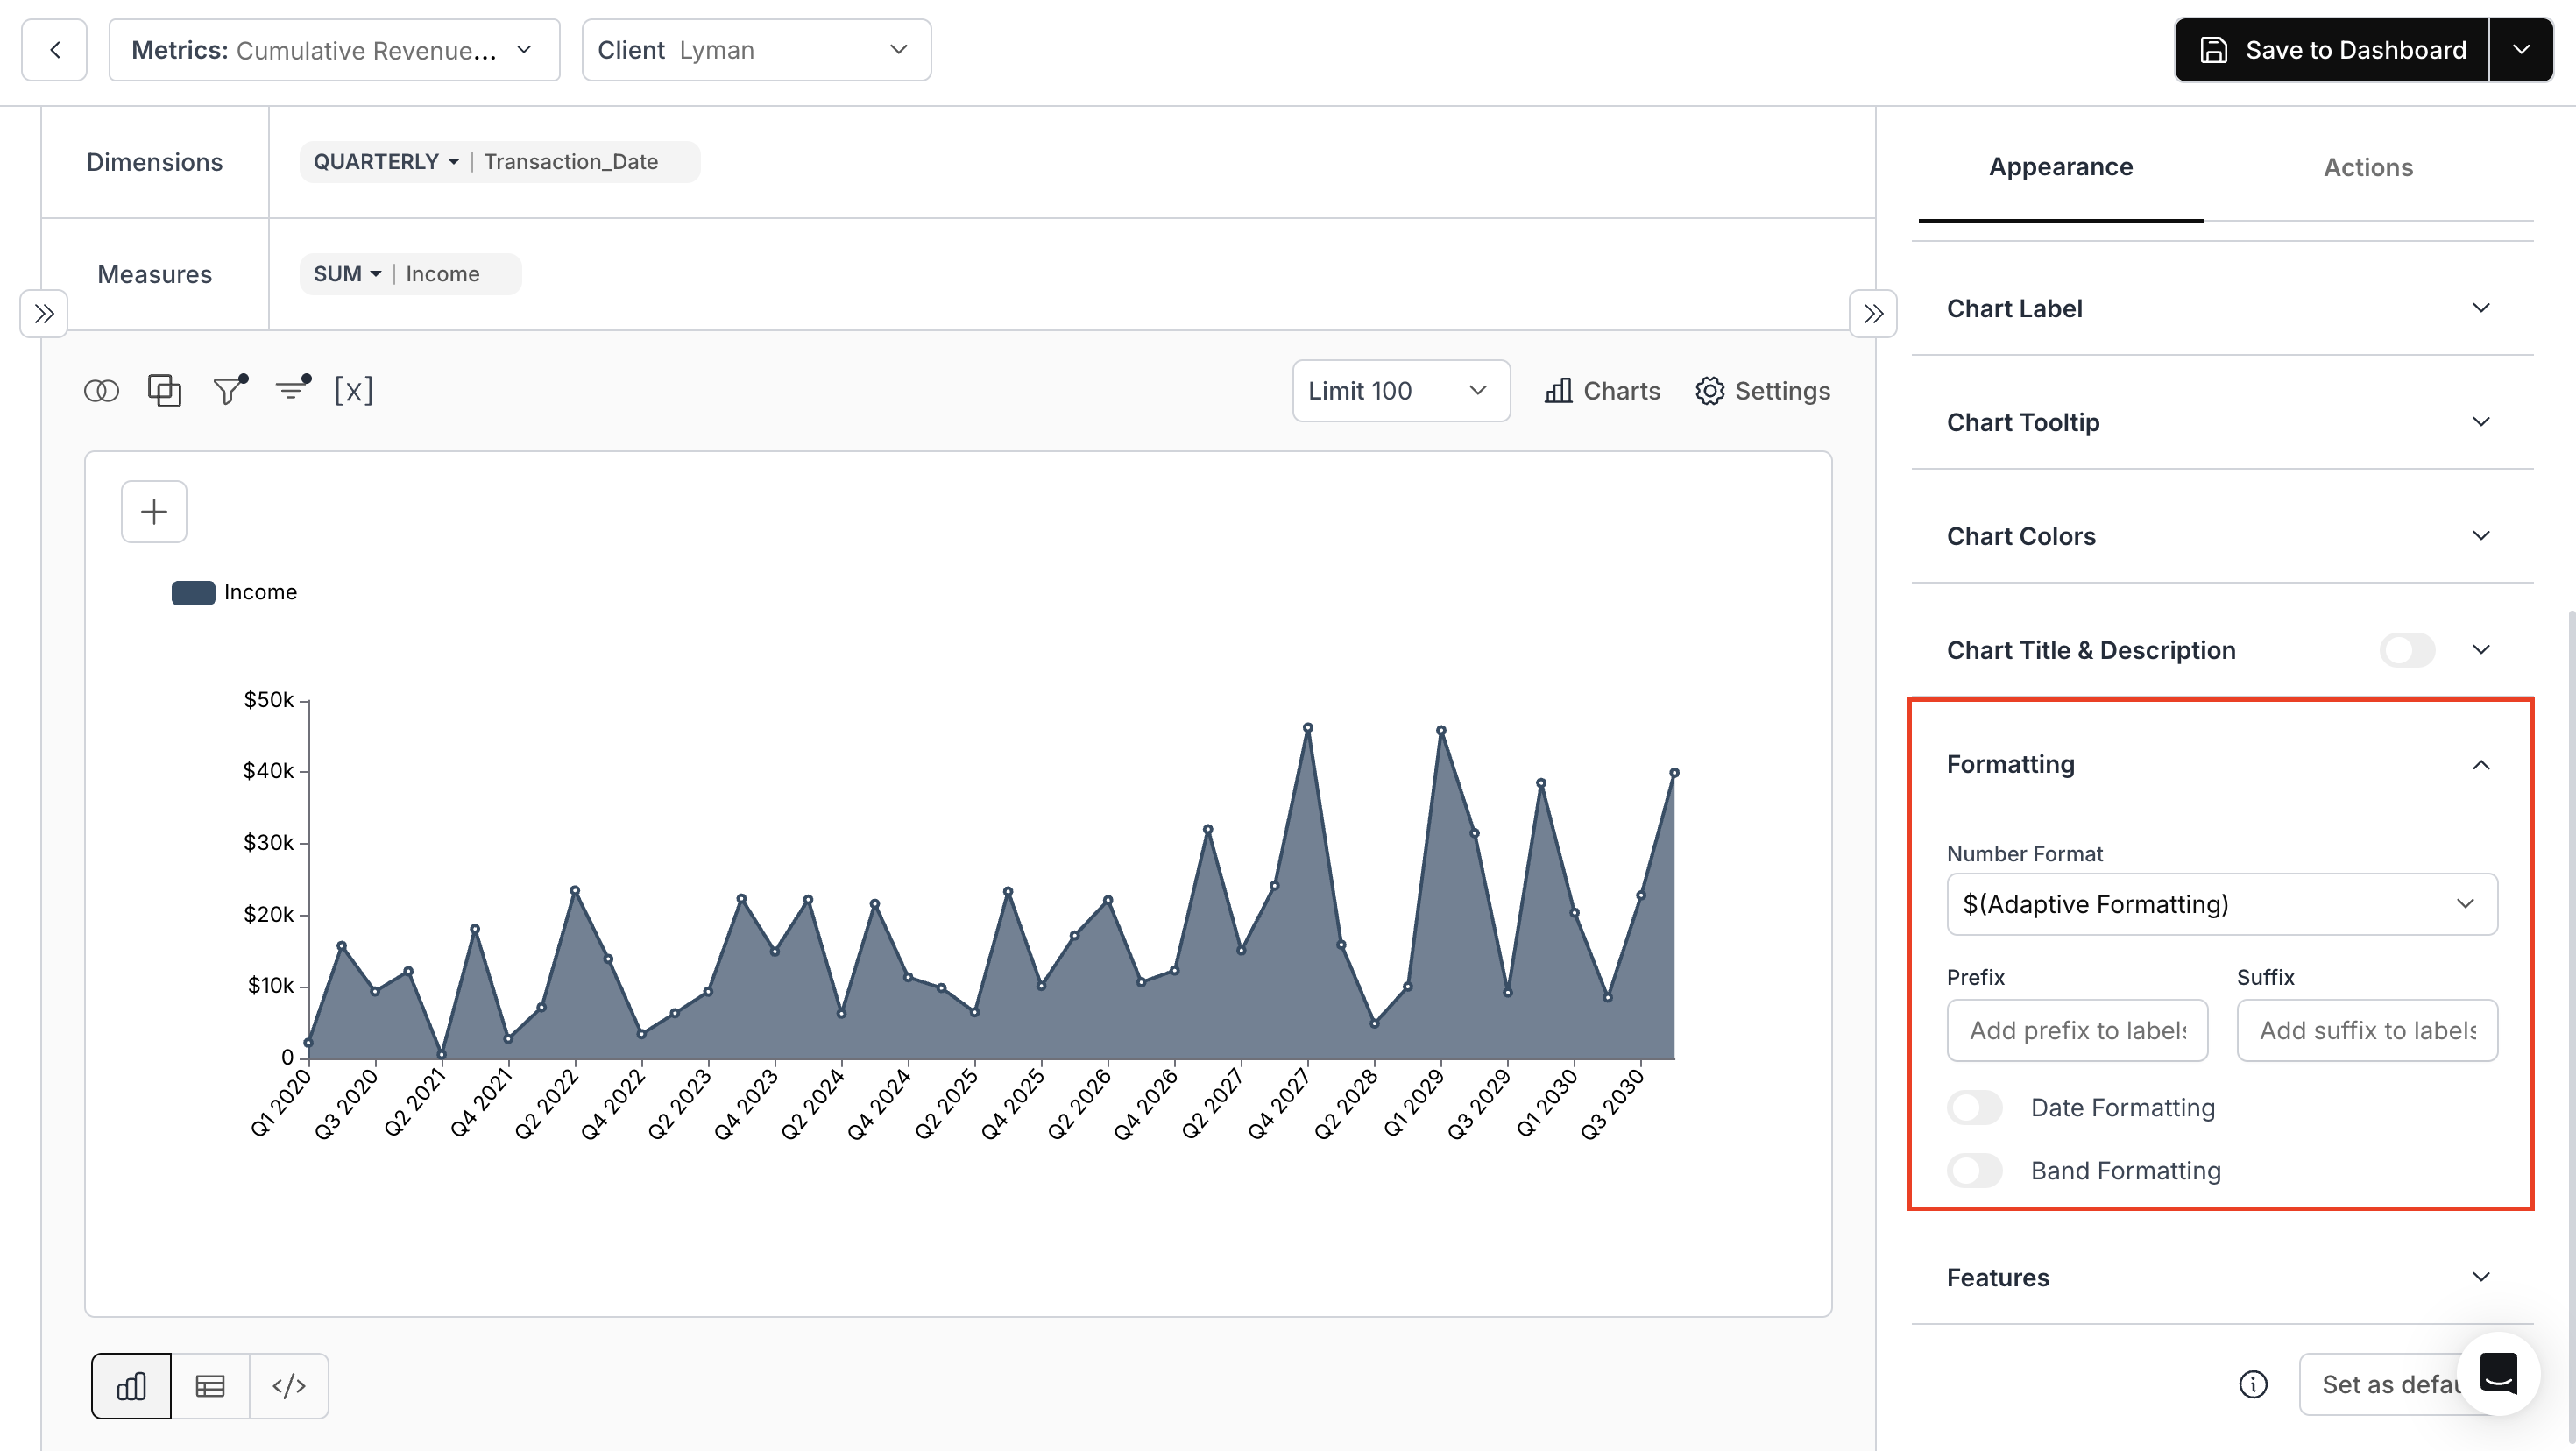
  1. Formatting:

Set: Number formatting, and add prefixes or suffixes to value labels.

Use Case:

Let us take an area chart showing Income. Format values with a preferred number format and add prefix/suffix to make data more readable.

  1. Features:

Options under this category vary based on the chosen chart type. Common functionalities include:

  • Enabling chart zoom, bar background, and cumulative bar, hiding null/0 values, and dynamic behavior

    Use Case for Chart Zoom, Bar Background, and Cumulative Bar features:

    Let us take a bar chart showing repairs by inventory. Enable features like:

    • Chart zoom: Focus on data ranges

    • Bar background: Add visual contrast

    • Cumulative bar: Show progressive totals

    Enhancing chart interactivity and visual analysis.

Use Case for Show 0/null values feature:

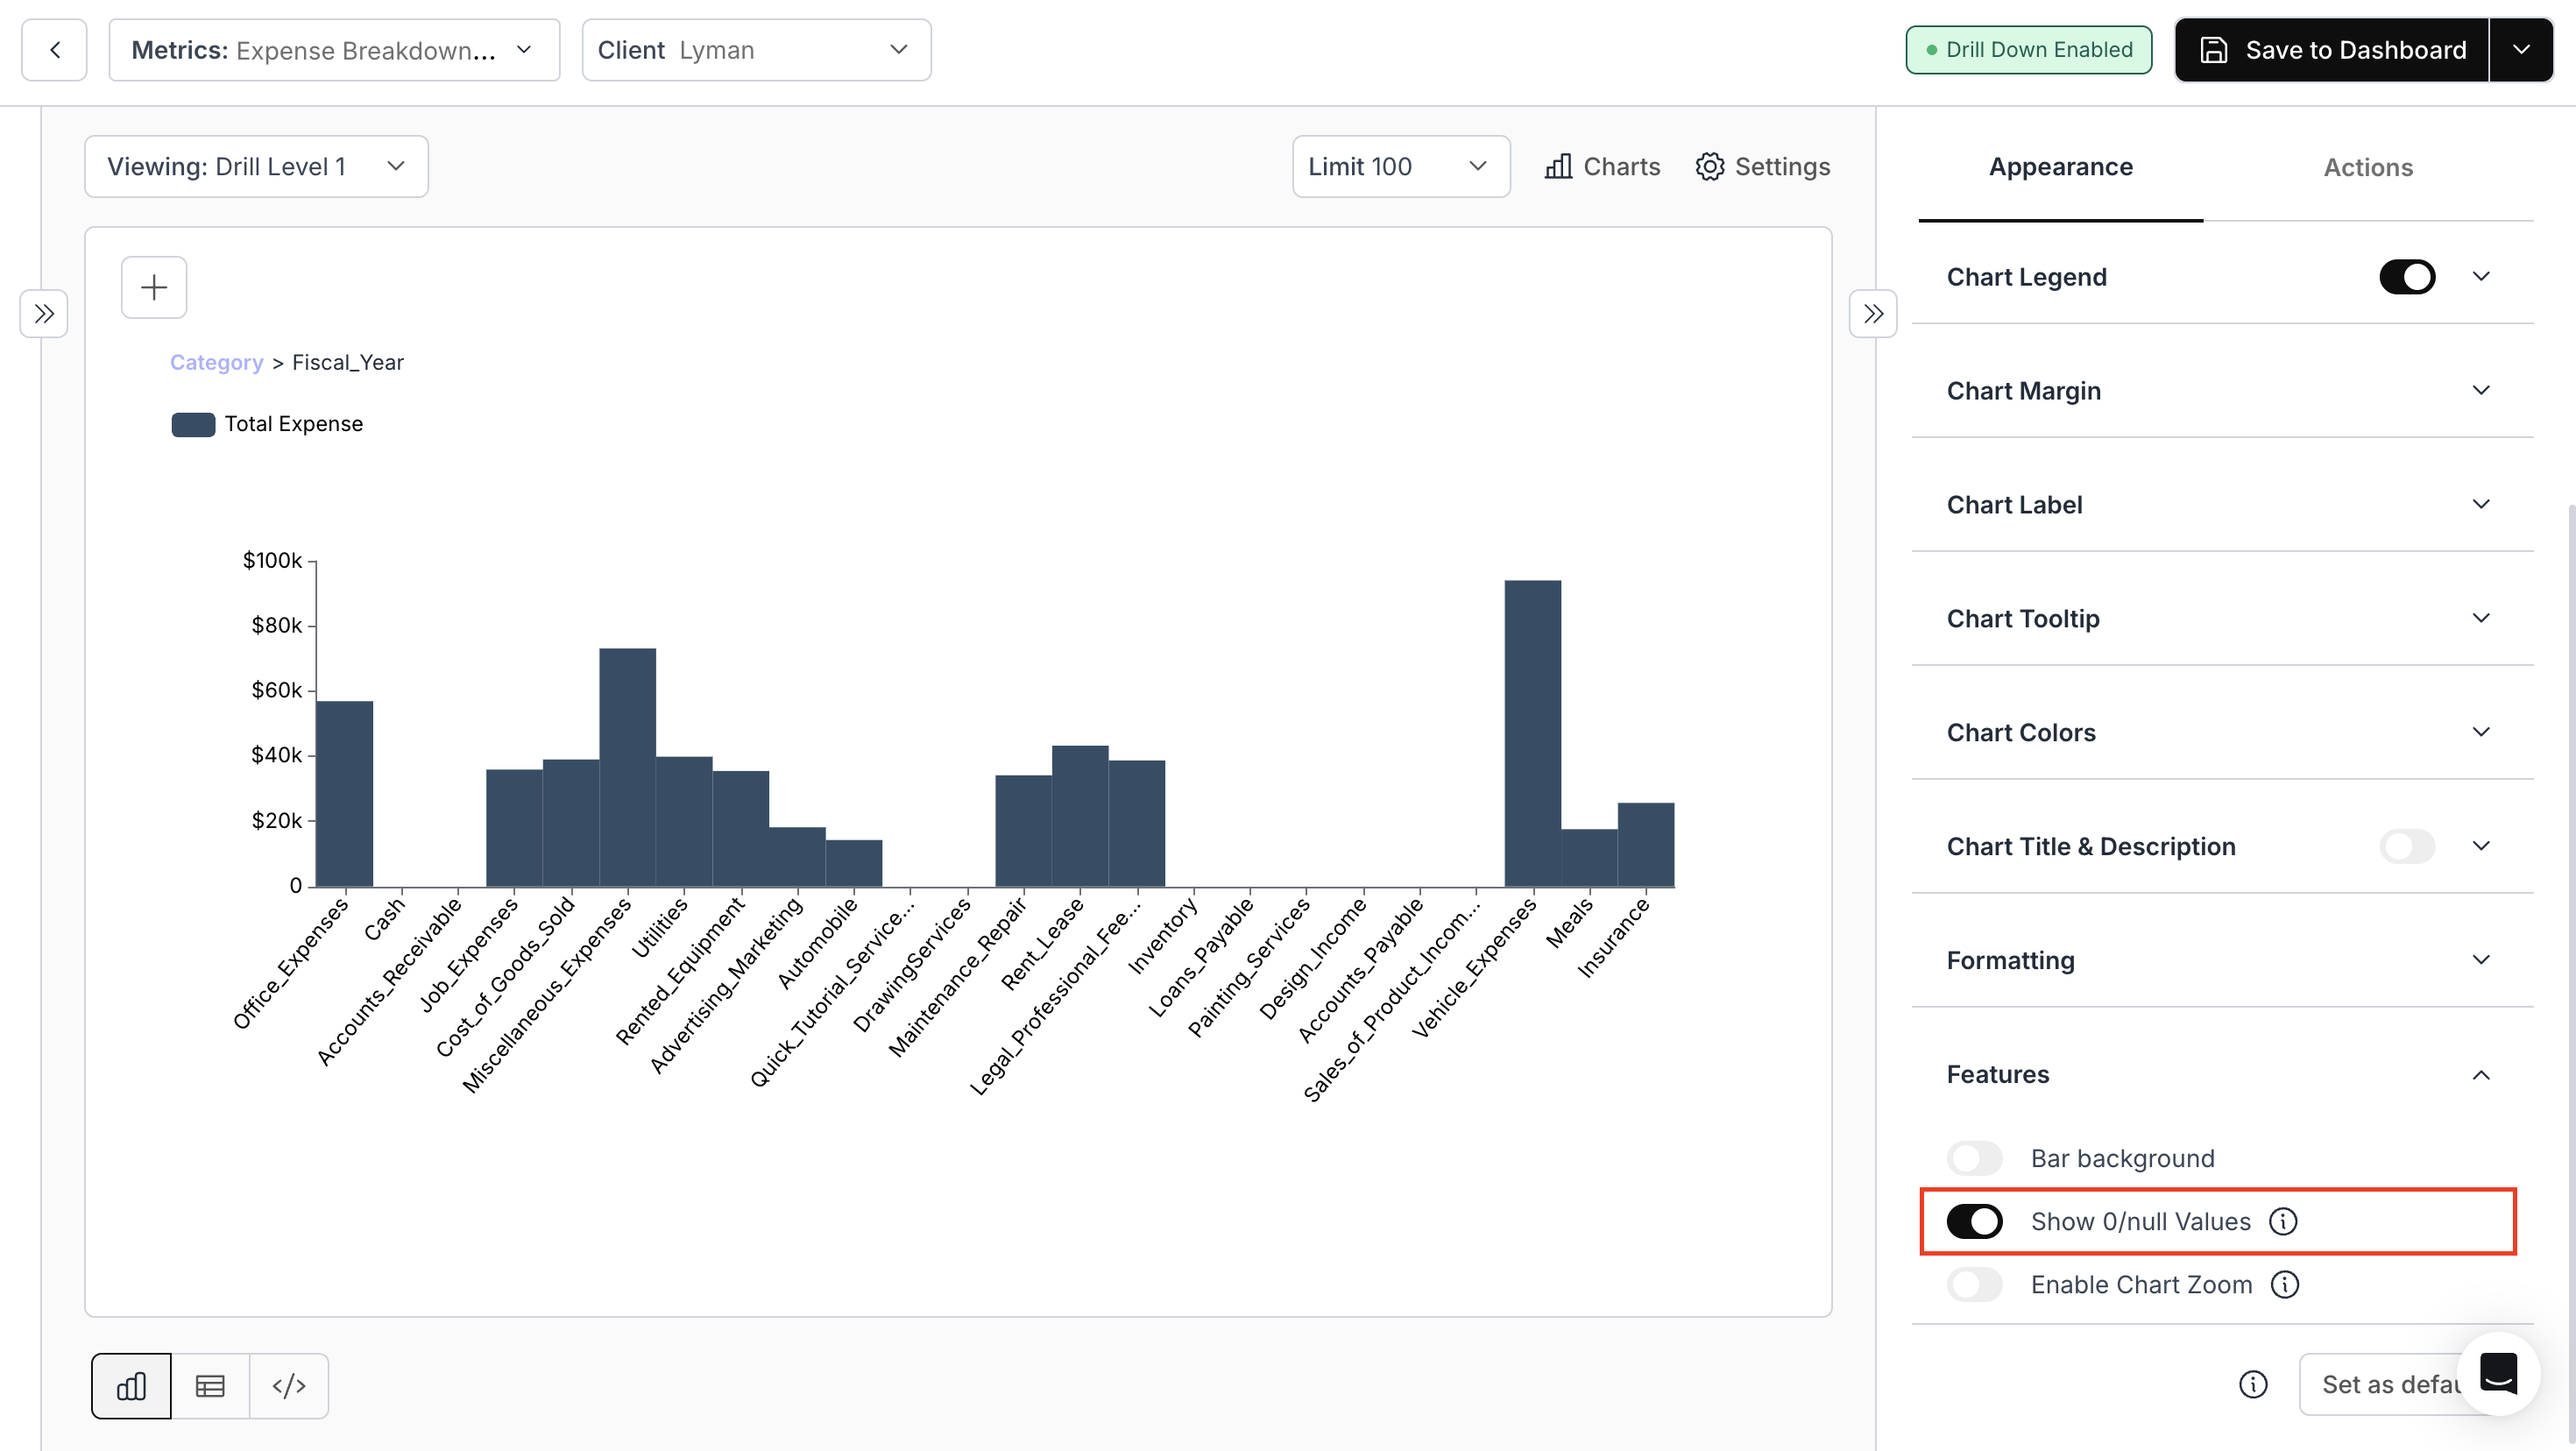
Let us take a bar chart showing Total Expense by Category. Toggle off "Show 0/null Values" to hide categories with no expenses, making the chart cleaner and focused on actual data.

Use case for Dynamic Behavior:

Let us take a line chart showing total sale value over time. When you toggle ON "Enable Dynamic Behavior", the chart dynamically updates to reflect changes in the displayed data, providing a more interactive and adaptable view of the trends.

Specific chart types offer unique customizations, like group-by settings for time series or color adjustments for bar charts.

Note: Options may vary based on the "Chart Type" chosen. The features listed above are commonly found across various chart types.

For chart-specific appearance options, kindly refer the below link:

📊
Chart-Specific Appearance Options